Report: UKCBC Student Experience and Satisfaction Survey Analysis
VerifiedAdded on 2020/02/03
|23
|5030
|79
Report
AI Summary
This report presents a detailed analysis of a survey conducted to assess the student experience and satisfaction levels at UKCBC. The report begins with an introduction to decision-making in business, highlighting the use of statistical tools for data analysis. Task 1 outlines the data collection plan, which includes primary data gathered through a survey and secondary data from alumni views and scholarly articles. The survey methodology, sampling frame, and a sample questionnaire are presented. Task 2 focuses on summarizing and analyzing the collected data. It includes the calculation of mean, median, and mode, along with a thematic analysis of student responses. The report also evaluates measures of dispersion, such as variance and standard deviation. Task 3 involves the use of spreadsheets to generate graphs and trend lines, along with the development of a PowerPoint presentation and a formal business report. Finally, Task 4 discusses information processing software for decision-making, project planning, and the evaluation of investment proposals. The report concludes with recommendations for improving the student experience and enhancing decision-making processes at UKCBC.

Business Decision Making
Paraphrase This Document
Need a fresh take? Get an instant paraphrase of this document with our AI Paraphraser
Table of Contents
INTRODUCTION......................................................................................................................3
TASK 1......................................................................................................................................3
a. Collection of primary and secondary data..........................................................................3
b. Designing survey methodology and sampling frame.........................................................4
c. Presenting a questionnaire for primary data collection......................................................5
TASK 2......................................................................................................................................7
a. Summarizing data for decision making..............................................................................7
b. Analyzing results to draw valid conclusion.......................................................................9
c. Evaluating the measures of dispersion.............................................................................11
d. Drawing framework for decision making by computing quartile, percentile and
correlation co-efficient.........................................................................................................12
TASK 3....................................................................................................................................13
a. Producing graphs by using spreadsheet............................................................................13
b. Creating trend line for analyzing pattern.........................................................................15
c. Developing a power point presentation............................................................................16
d. Preparing a formal business report...................................................................................16
TASK 4....................................................................................................................................17
a. Assessing information processing software that facilitates decision making at all level.17
b. Preparing a project plan and determination of critical path.............................................18
c. Evaluating the viability of investment proposal...............................................................18
CONCLUSION........................................................................................................................20
REFERENCES.........................................................................................................................21

⊘ This is a preview!⊘
Do you want full access?
Subscribe today to unlock all pages.
Trusted by 1+ million students worldwide
INTRODUCTION
Decision making is the vital part of every profit and non-profit making business
organization. In the strategic business environment, firm can attain success only when it takes
suitable decision within the appropriate time frame. Hence, by using both statistical and non-
statistical tools and techniques business unit can undertake strategic action that contributes in
its growth and success. Moreover, statistical tools help in evaluating the large data set in a
highly structured way. This report is drafted on UK CBC that offers educational services to
students regarding Business and computing. In this, report will shed light on the experience
and satisfaction level of students through the means of primary as well as secondary data.
Further, it will also develop understanding about the manner in which statistical tools help in
generating valuable information from data set. Report will also helps in identifying the
manner in which information processing and investment appraisal tools helps in decision
making.
TASK 1
a. Collection of primary and secondary data
On the basis of cited case situation, UK CBC wants to get information about the
experience and satisfaction level of students. The rationale behind this, college institution
cans suitable modifications in the existing framework only when they have idea about the
student’s point of view. With the motive to fulfill the research aim scholar has taken decision
to gather data from both primary and secondary source. Primary data may be defined as one
that is collected by the researcher for first time specifically to meet research aim (Bickel and
Lehmann, 2012). There are several methods that provide high level of assistance to the
researcher in collection of primary data such as survey, focus group, observation etc. Data
gathered through the means of primary data sources are highly reliable in nature and helps in
determining the suitable solution of issue. Further, secondary data is one that has gathered
and analyzed by other researchers. Hence, by making evaluation of books, journals and
scholarly articles scholar can gather secondary data (Chen, So and Kuruoglu, 2016). In order
to carry out research more effectually scholar has undertaken below mentioned plan for data
collection:
Paraphrase This Document
Need a fresh take? Get an instant paraphrase of this document with our AI Paraphraser
Primary data collection: Survey technique has been selected by the scholar to gather
primary data. The main reasons for the selection of survey technique are that it helps in
extracting suitable information from respondents. In survey, respondents are not obliged to
disclose their identity. Thus, by doing survey researcher can easily assess the extent to which
students are satisfied from UK CBC. To conduct survey, primarily researcher has selected 10
students by using purposive sampling technique. Once, sample size and respondents have
been determined thereafter scholar will frame questionnaire. Moreover, without having
questionnaire scholar would not able to get suitable information from respondents. By
considering this, researcher will include questions regarding teaching staff, course
advancement, classrooms and other facilities. In the next step, researcher will sent
questionnaire on the mail id of students and thereby become able to get suitable primary
information.
Secondary data collection: To collect secondary data researcher will approach
administrative department of UK CBC record to get information about the views of alumni’s.
Moreover, alumni’s have better idea regarding the quality of educational services maintained
by UK CBC. Along with this, to get deeper insight about student’s preferences while making
selection of college scholar will gather data via books, journals and articles associated with
such topic. For this purpose, researcher will do internet surfing because Google contains wide
range of information. In this way, by making evaluation of scholarly articles researcher will
develop brief thesis for the data analysis section.
b. Designing survey methodology and sampling frame
Survey methodology: When researchers take decision in relation to conducting survey
then they require selecting suitable method as well as tools for the same. Hence, by preparing
suitable methodology researcher can conduct survey in an appropriate manner. Saving cost
and meeting research aim within the suitable time frame is one of the main objectives of
researcher. Hence, by keeping such aspect in mind online survey methodology has been
selected by the researcher (Gigerenzer and Gaissmaier, 2011). In this regard, researcher will
primarily collect information regarding the main-id of students from administrative office or
department. Thus, by sending questionnaire on the personal mail-id of students researcher
will gather data regarding educational facilities provided by UK CBC. Hence, by undertaking
such methodology researcher can gather as well as evaluate data set within the time frame
and thereby would become able to gain competitive edge.
Sampling frame: Sampling is highly concerned with the selection of subset of
individuals who possess the characteristics of whole population. Effectiveness of survey is
highly dependent on the sample selected for this purpose. Hence, by using probabilistic and
non-probabilistic sampling technique researcher can determine suitable sample for the study.
According to probabilistic sampling technique, researcher offers opportunity to each
individual to being selected as sample (Ho, Xu and Dey, 2010). Simple random, strata,
stratified etc. are the main example of probabilistic sampling technique. Under non-
probabilistic technique, researcher selects sample according to the convenience level.
Probabilistic techniques are highly effectual which in turn avoids biasness to a great extent.
Hence, by taking into account such aspect 10 students have been selected by the scholar. It is
the part of probabilistic sampling technique that researcher has undertaken. Hence, by
evaluating the experience level of students researcher can present the fair view of study.
c. Presenting a questionnaire for primary data collection
Name…….
Age ……..
Batch no or year …..
1. How do you rate the education services of UK CBC?
Excellent ()
Better ()
Good ()
Average ()
Poor ()
Q.2 Are you satisfied with the course curriculum set by UK CBC?
Satisfied ()
Highly satisfied ()
Neither satisfied nor dissatisfied ()
Dissatisfied ()
Highly dissatisfied ()
Q.3 Do you agree that teaching staff of UK CBC is highly skilled and competent?
⊘ This is a preview!⊘
Do you want full access?
Subscribe today to unlock all pages.
Trusted by 1+ million students worldwide
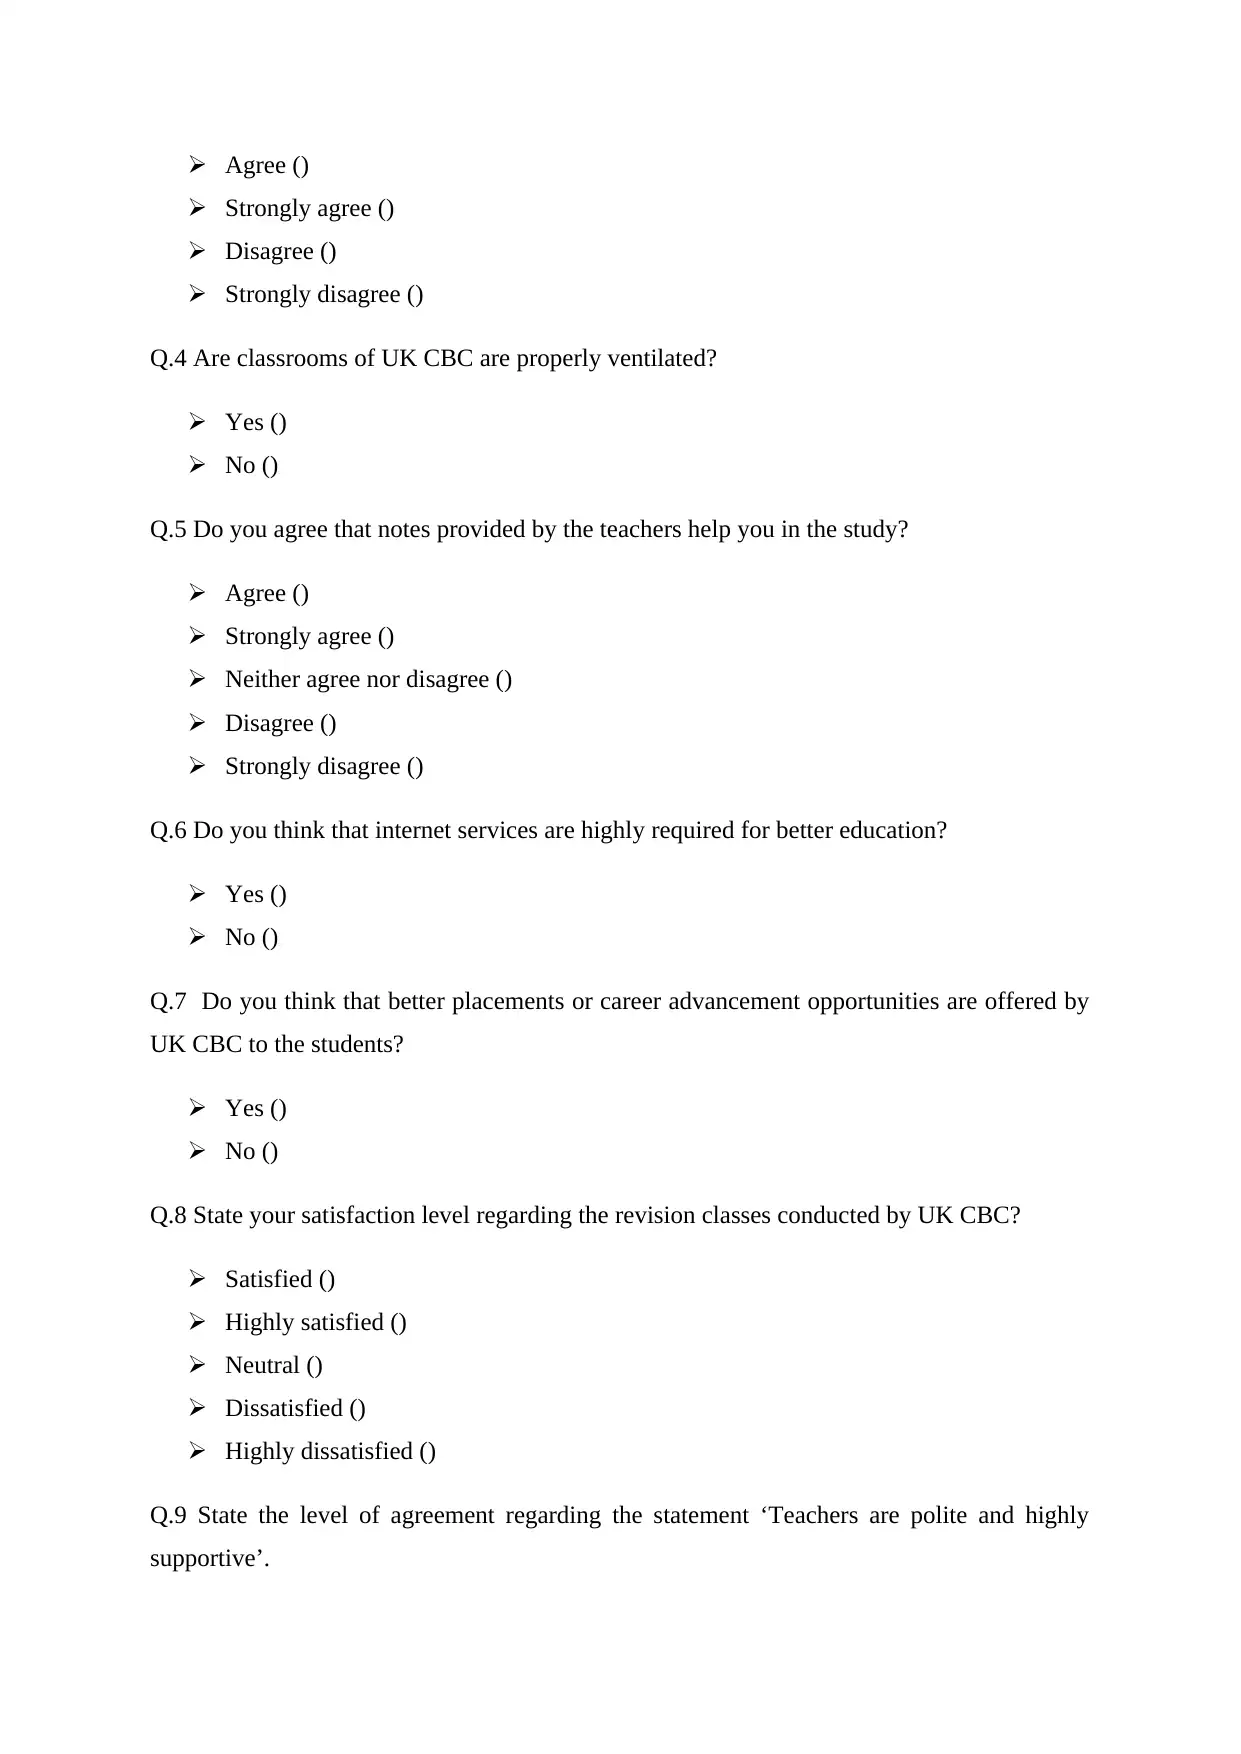
Agree ()
Strongly agree ()
Disagree ()
Strongly disagree ()
Q.4 Are classrooms of UK CBC are properly ventilated?
Yes ()
No ()
Q.5 Do you agree that notes provided by the teachers help you in the study?
Agree ()
Strongly agree ()
Neither agree nor disagree ()
Disagree ()
Strongly disagree ()
Q.6 Do you think that internet services are highly required for better education?
Yes ()
No ()
Q.7 Do you think that better placements or career advancement opportunities are offered by
UK CBC to the students?
Yes ()
No ()
Q.8 State your satisfaction level regarding the revision classes conducted by UK CBC?
Satisfied ()
Highly satisfied ()
Neutral ()
Dissatisfied ()
Highly dissatisfied ()
Q.9 State the level of agreement regarding the statement ‘Teachers are polite and highly
supportive’.
Strongly agree ()
Disagree ()
Strongly disagree ()
Q.4 Are classrooms of UK CBC are properly ventilated?
Yes ()
No ()
Q.5 Do you agree that notes provided by the teachers help you in the study?
Agree ()
Strongly agree ()
Neither agree nor disagree ()
Disagree ()
Strongly disagree ()
Q.6 Do you think that internet services are highly required for better education?
Yes ()
No ()
Q.7 Do you think that better placements or career advancement opportunities are offered by
UK CBC to the students?
Yes ()
No ()
Q.8 State your satisfaction level regarding the revision classes conducted by UK CBC?
Satisfied ()
Highly satisfied ()
Neutral ()
Dissatisfied ()
Highly dissatisfied ()
Q.9 State the level of agreement regarding the statement ‘Teachers are polite and highly
supportive’.
Paraphrase This Document
Need a fresh take? Get an instant paraphrase of this document with our AI Paraphraser
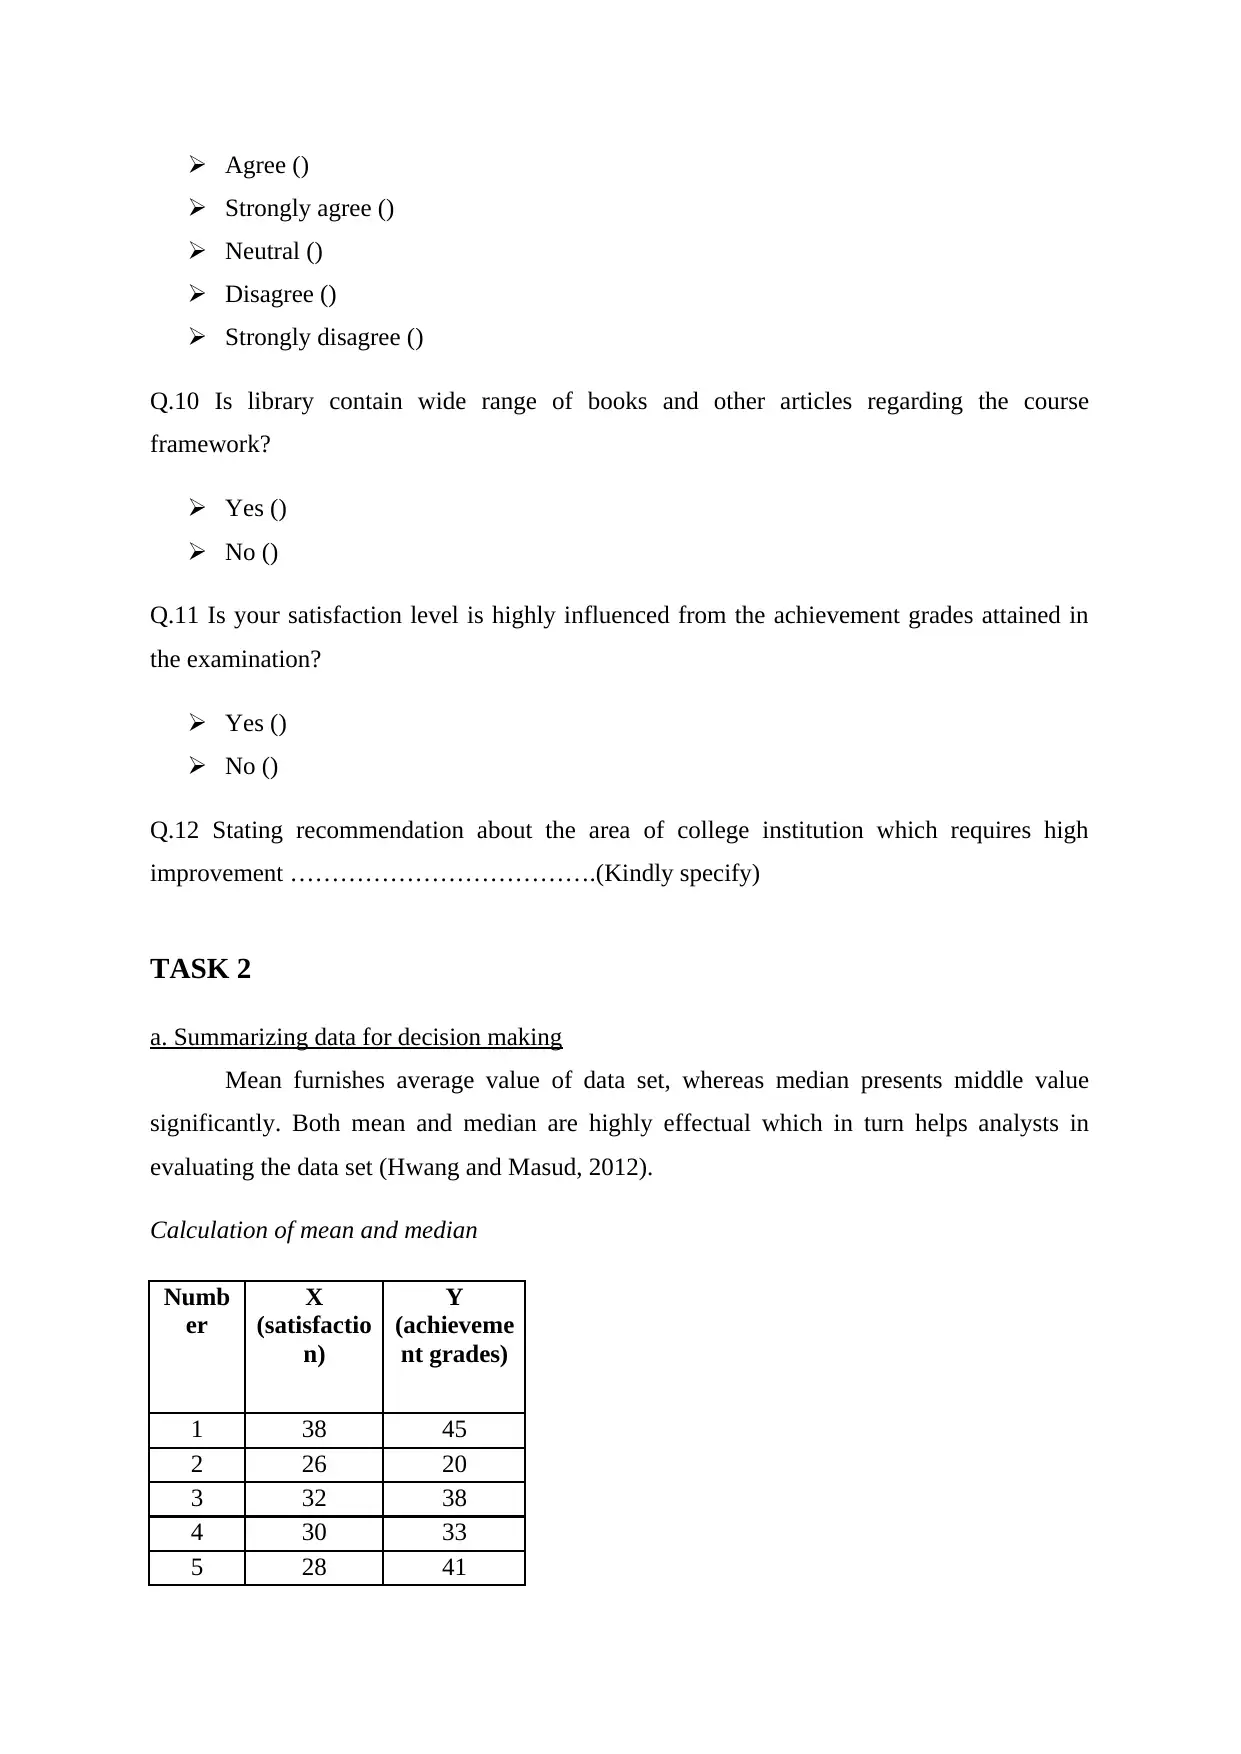
Agree ()
Strongly agree ()
Neutral ()
Disagree ()
Strongly disagree ()
Q.10 Is library contain wide range of books and other articles regarding the course
framework?
Yes ()
No ()
Q.11 Is your satisfaction level is highly influenced from the achievement grades attained in
the examination?
Yes ()
No ()
Q.12 Stating recommendation about the area of college institution which requires high
improvement ……………………………….(Kindly specify)
TASK 2
a. Summarizing data for decision making
Mean furnishes average value of data set, whereas median presents middle value
significantly. Both mean and median are highly effectual which in turn helps analysts in
evaluating the data set (Hwang and Masud, 2012).
Calculation of mean and median
Numb
er
X
(satisfactio
n)
Y
(achieveme
nt grades)
1 38 45
2 26 20
3 32 38
4 30 33
5 28 41
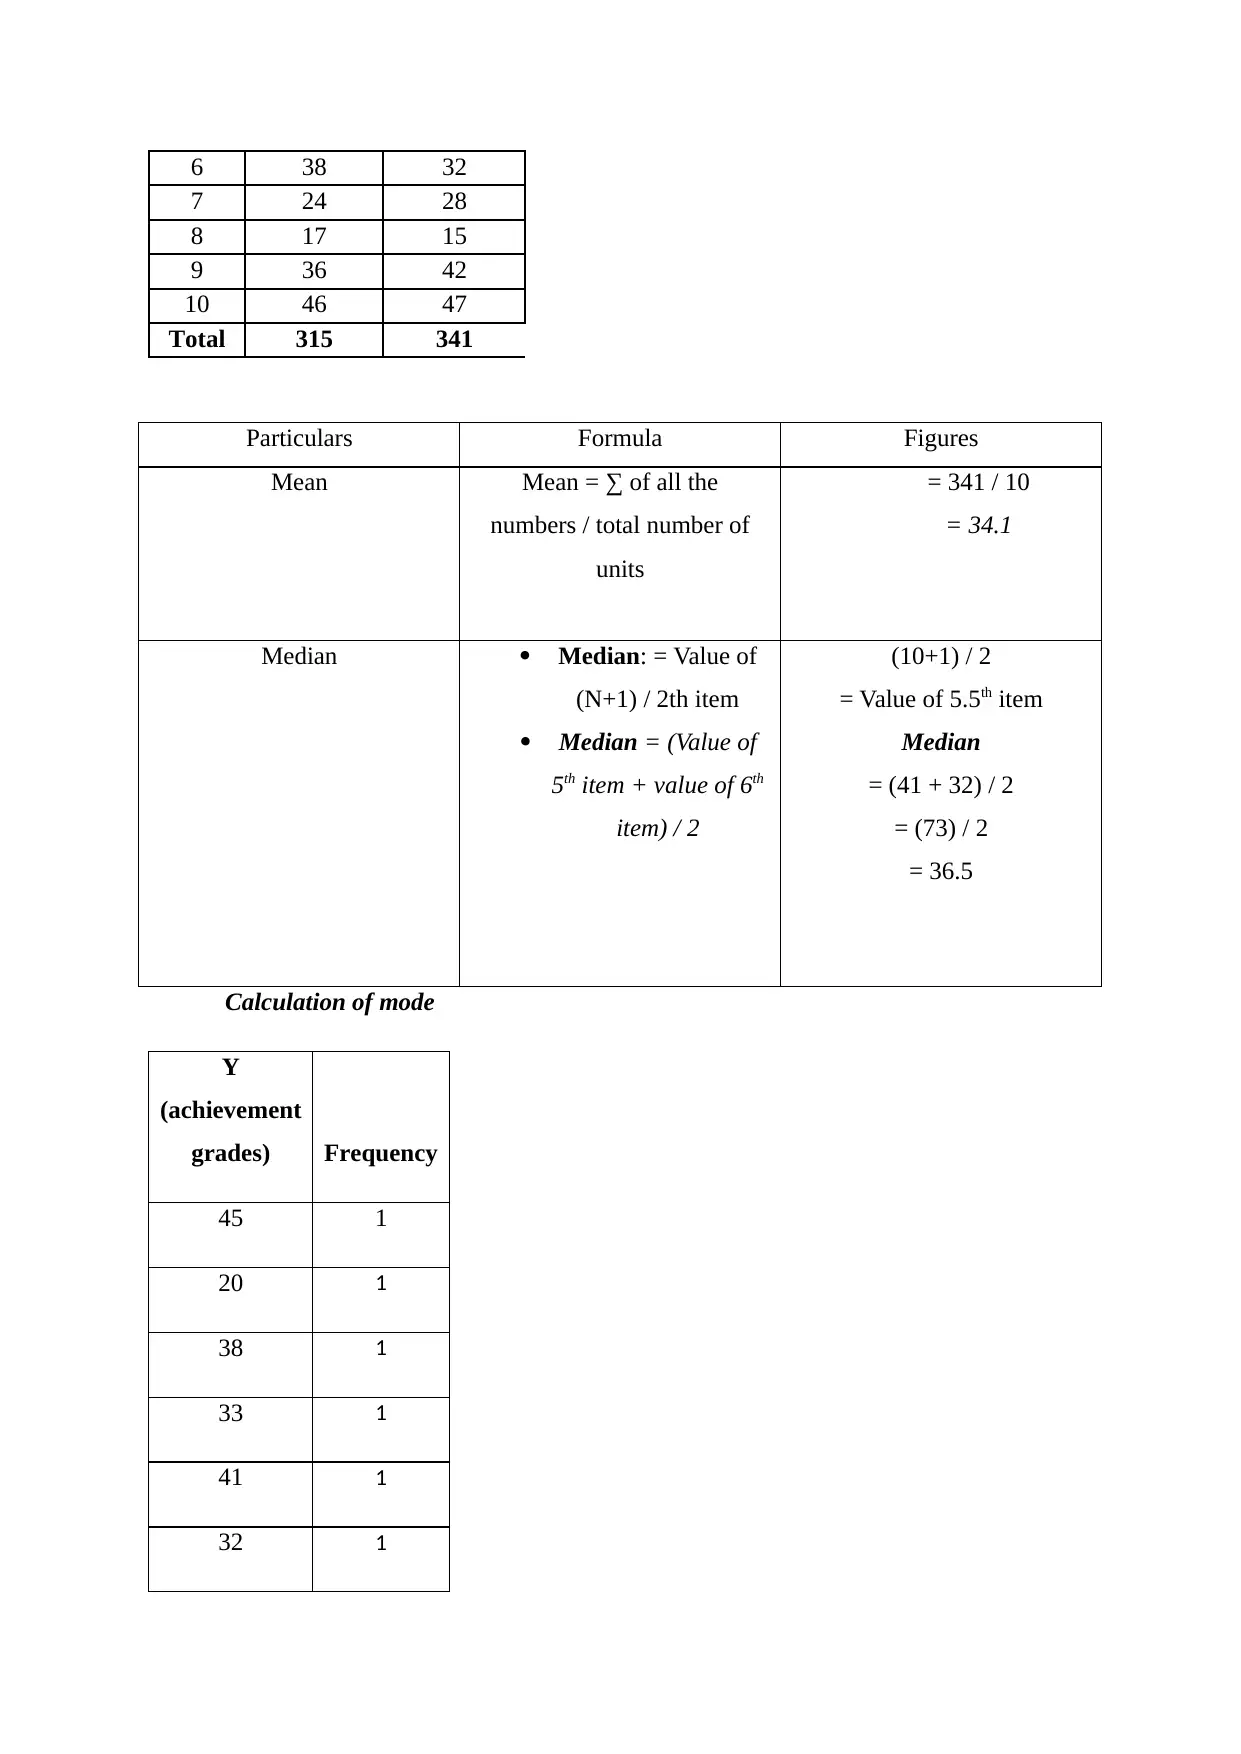
6 38 32
7 24 28
8 17 15
9 36 42
10 46 47
Total 315 341
Particulars Formula Figures
Mean Mean = ∑ of all the
numbers / total number of
units
= 341 / 10
= 34.1
Median Median: = Value of
(N+1) / 2th item
Median = (Value of
5th item + value of 6th
item) / 2
(10+1) / 2
= Value of 5.5th item
Median
= (41 + 32) / 2
= (73) / 2
= 36.5
Calculation of mode
Y
(achievement
grades) Frequency
45 1
20 1
38 1
33 1
41 1
32 1
⊘ This is a preview!⊘
Do you want full access?
Subscribe today to unlock all pages.
Trusted by 1+ million students worldwide
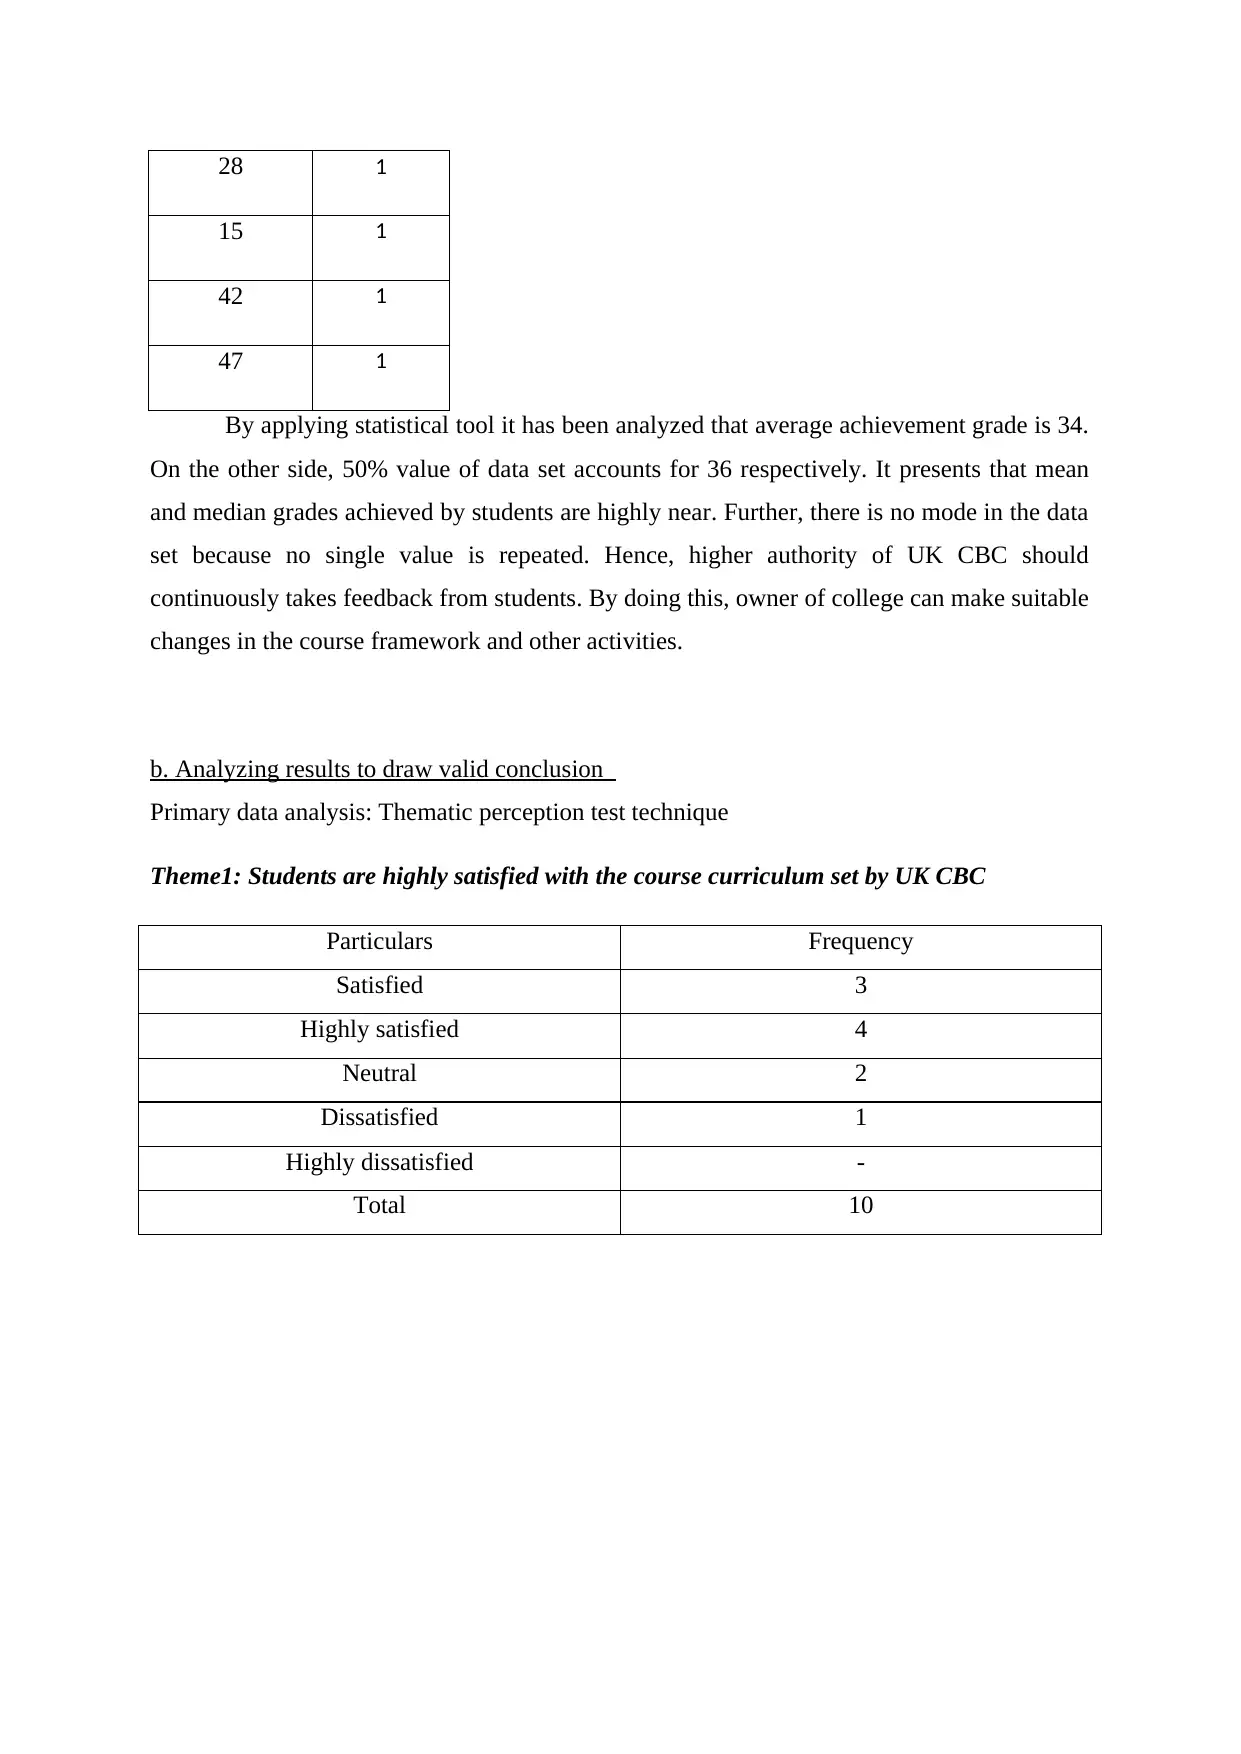
28 1
15 1
42 1
47 1
By applying statistical tool it has been analyzed that average achievement grade is 34.
On the other side, 50% value of data set accounts for 36 respectively. It presents that mean
and median grades achieved by students are highly near. Further, there is no mode in the data
set because no single value is repeated. Hence, higher authority of UK CBC should
continuously takes feedback from students. By doing this, owner of college can make suitable
changes in the course framework and other activities.
b. Analyzing results to draw valid conclusion
Primary data analysis: Thematic perception test technique
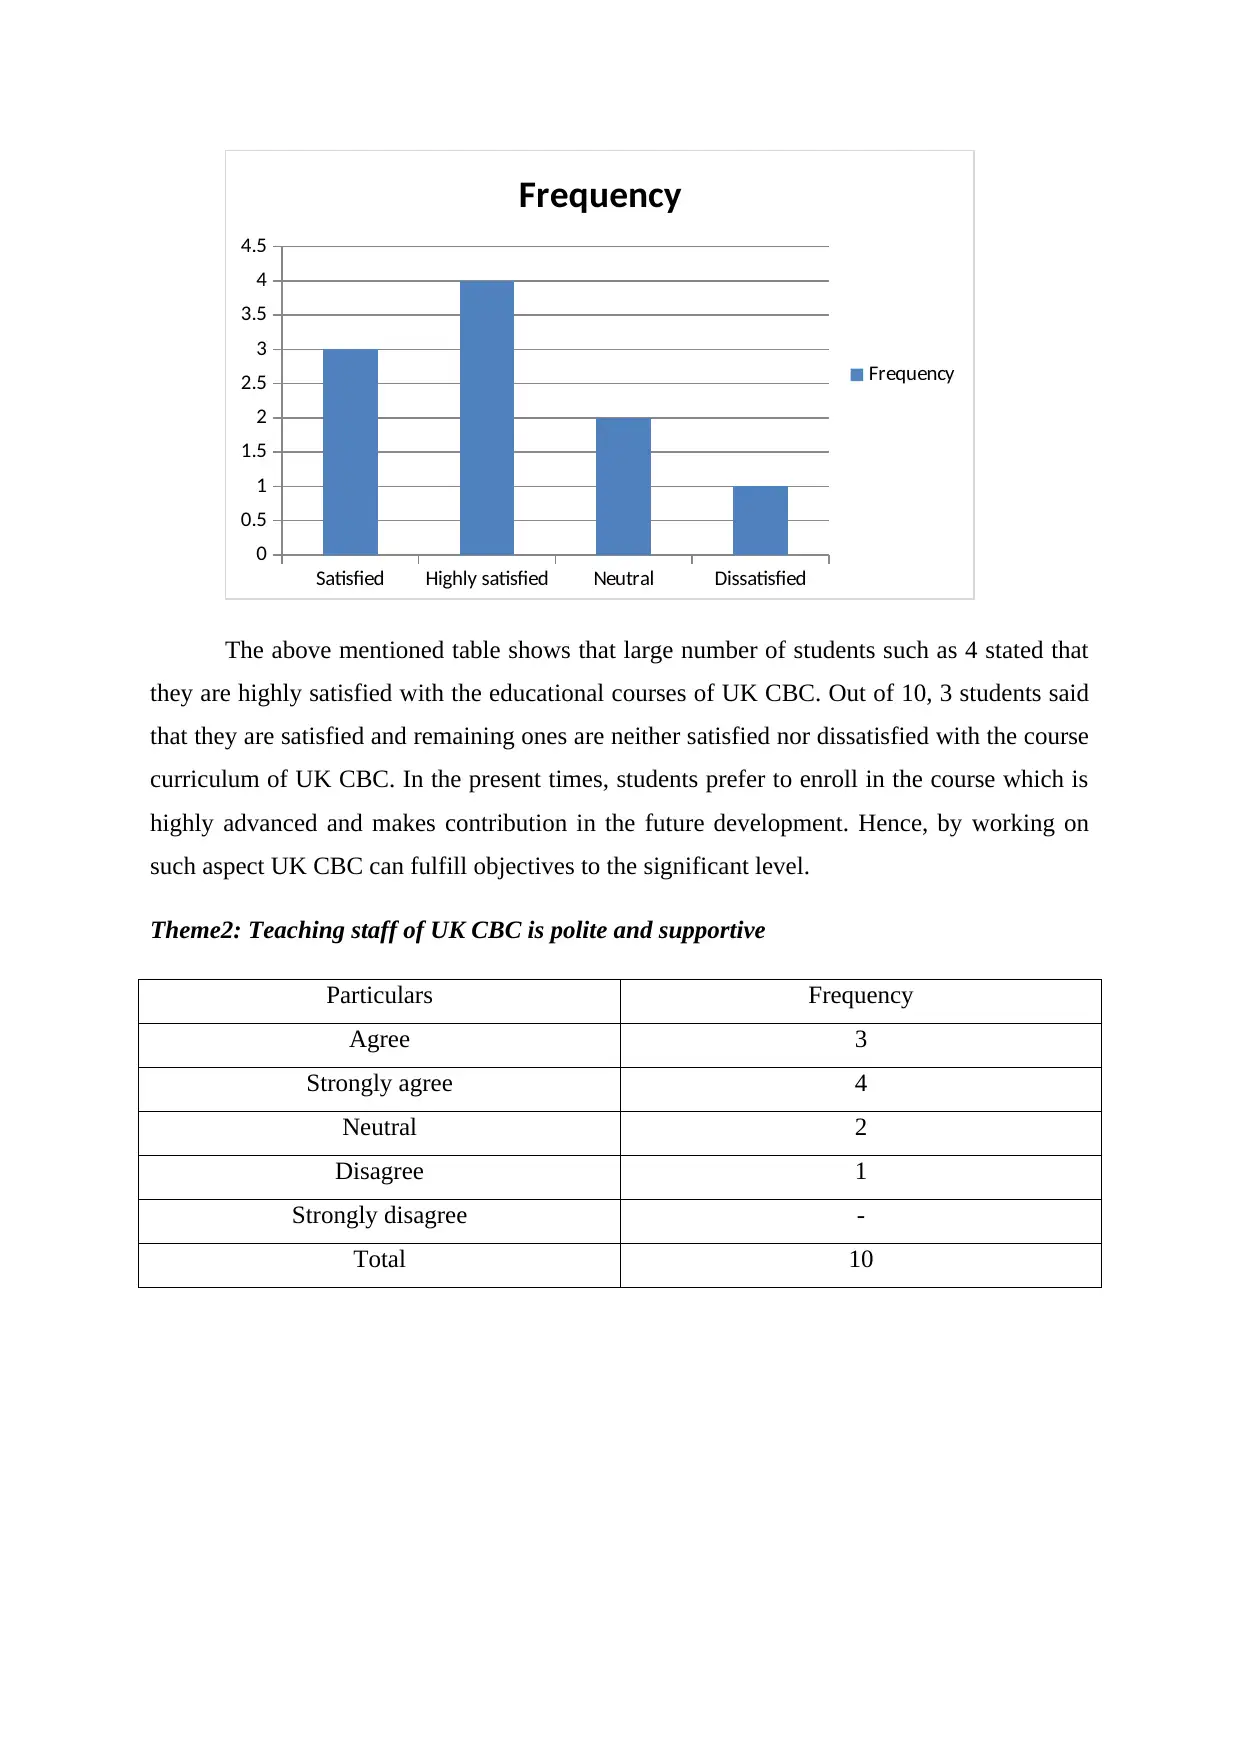
Theme1: Students are highly satisfied with the course curriculum set by UK CBC
Particulars Frequency
Satisfied 3
Highly satisfied 4
Neutral 2
Dissatisfied 1
Highly dissatisfied -
Total 10
15 1
42 1
47 1
By applying statistical tool it has been analyzed that average achievement grade is 34.
On the other side, 50% value of data set accounts for 36 respectively. It presents that mean
and median grades achieved by students are highly near. Further, there is no mode in the data
set because no single value is repeated. Hence, higher authority of UK CBC should
continuously takes feedback from students. By doing this, owner of college can make suitable
changes in the course framework and other activities.
b. Analyzing results to draw valid conclusion
Primary data analysis: Thematic perception test technique
Theme1: Students are highly satisfied with the course curriculum set by UK CBC
Particulars Frequency
Satisfied 3
Highly satisfied 4
Neutral 2
Dissatisfied 1
Highly dissatisfied -
Total 10
Paraphrase This Document
Need a fresh take? Get an instant paraphrase of this document with our AI Paraphraser
Satisfied Highly satisfied Neutral Dissatisfied
0
0.5
1
1.5
2
2.5
3
3.5
4
4.5
Frequency
Frequency
The above mentioned table shows that large number of students such as 4 stated that
they are highly satisfied with the educational courses of UK CBC. Out of 10, 3 students said
that they are satisfied and remaining ones are neither satisfied nor dissatisfied with the course
curriculum of UK CBC. In the present times, students prefer to enroll in the course which is
highly advanced and makes contribution in the future development. Hence, by working on
such aspect UK CBC can fulfill objectives to the significant level.
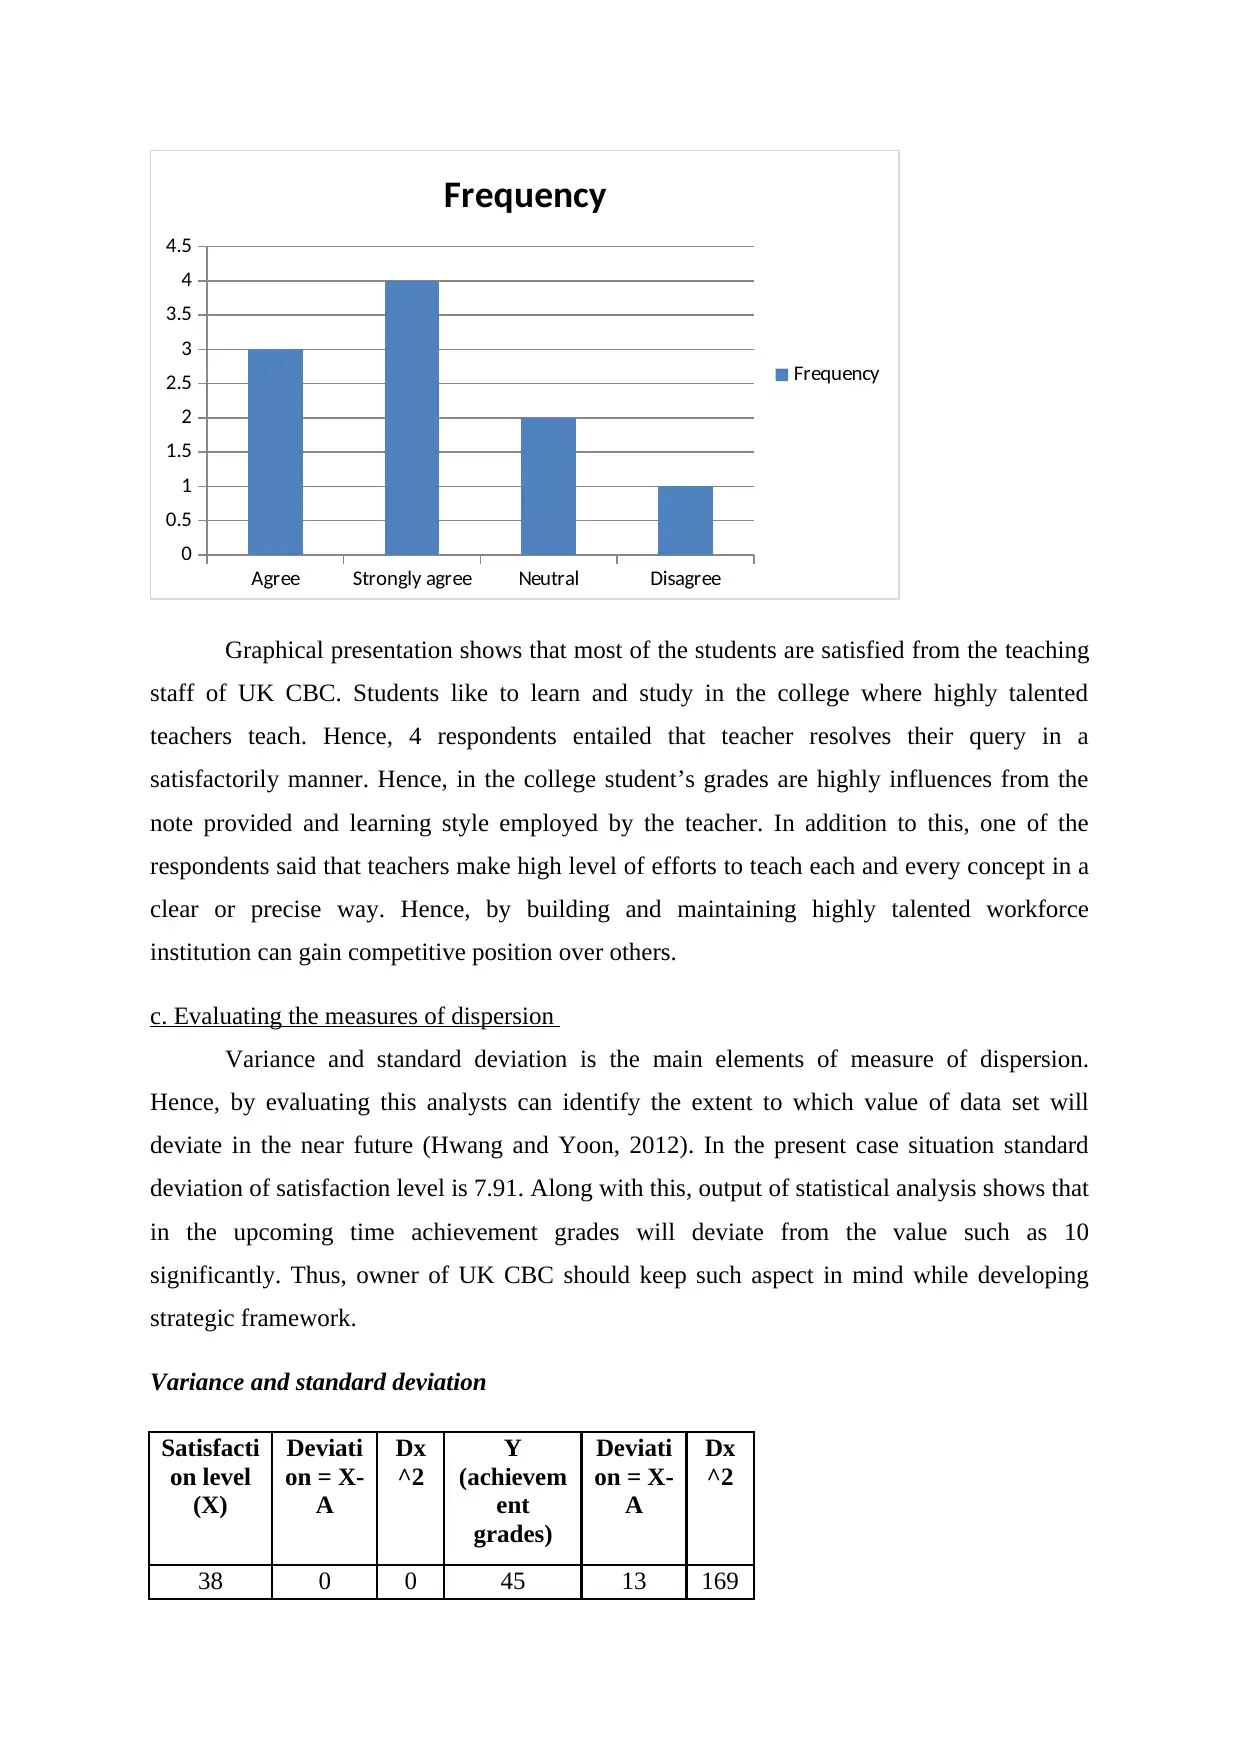
Theme2: Teaching staff of UK CBC is polite and supportive
Particulars Frequency
Agree 3
Strongly agree 4
Neutral 2
Disagree 1
Strongly disagree -
Total 10
0
0.5
1
1.5
2
2.5
3
3.5
4
4.5
Frequency
Frequency
The above mentioned table shows that large number of students such as 4 stated that
they are highly satisfied with the educational courses of UK CBC. Out of 10, 3 students said
that they are satisfied and remaining ones are neither satisfied nor dissatisfied with the course
curriculum of UK CBC. In the present times, students prefer to enroll in the course which is
highly advanced and makes contribution in the future development. Hence, by working on
such aspect UK CBC can fulfill objectives to the significant level.
Theme2: Teaching staff of UK CBC is polite and supportive
Particulars Frequency
Agree 3
Strongly agree 4
Neutral 2
Disagree 1
Strongly disagree -
Total 10
Agree Strongly agree Neutral Disagree
0
0.5
1
1.5
2
2.5
3
3.5
4
4.5
Frequency
Frequency
Graphical presentation shows that most of the students are satisfied from the teaching
staff of UK CBC. Students like to learn and study in the college where highly talented
teachers teach. Hence, 4 respondents entailed that teacher resolves their query in a
satisfactorily manner. Hence, in the college student’s grades are highly influences from the
note provided and learning style employed by the teacher. In addition to this, one of the
respondents said that teachers make high level of efforts to teach each and every concept in a
clear or precise way. Hence, by building and maintaining highly talented workforce
institution can gain competitive position over others.
c. Evaluating the measures of dispersion
Variance and standard deviation is the main elements of measure of dispersion.
Hence, by evaluating this analysts can identify the extent to which value of data set will
deviate in the near future (Hwang and Yoon, 2012). In the present case situation standard
deviation of satisfaction level is 7.91. Along with this, output of statistical analysis shows that
in the upcoming time achievement grades will deviate from the value such as 10
significantly. Thus, owner of UK CBC should keep such aspect in mind while developing
strategic framework.
Variance and standard deviation
Satisfacti
on level
(X)
Deviati
on = X-
A
Dx
^2
Y
(achievem
ent
grades)
Deviati
on = X-
A
Dx
^2
38 0 0 45 13 169
⊘ This is a preview!⊘
Do you want full access?
Subscribe today to unlock all pages.
Trusted by 1+ million students worldwide
1 out of 23
Related Documents


Your All-in-One AI-Powered Toolkit for Academic Success.
+13062052269
info@desklib.com
Available 24*7 on WhatsApp / Email
![[object Object]](/_next/static/media/star-bottom.7253800d.svg)
Unlock your academic potential
Copyright © 2020–2026 A2Z Services. All Rights Reserved. Developed and managed by ZUCOL.