Comprehensive Analysis: Business Decision Making at Ann's College
VerifiedAdded on 2020/01/07
|20
|4737
|53
Report
AI Summary
This report provides an in-depth analysis of business decision-making within Ann's College, focusing on challenges such as declining student numbers and revenue. It begins with an introduction to the importance of effective decision-making and outlines a research plan that incorporates both primary and secondary data collection methods, including surveys and analysis of financial records. The report details the use of quota sampling for primary research and presents calculations of mean, median, mode, and standard deviation from student mark data. Furthermore, it examines the correlation between training expenditures and student grades, using graphs and trend lines to illustrate the relationships. The report concludes with a discussion of information processing tools suitable for the college, such as transaction processing systems and management information systems, to improve decision-making processes.

An in-depth study into business decision
making in a selected organization.
making in a selected organization.
Paraphrase This Document
Need a fresh take? Get an instant paraphrase of this document with our AI Paraphraser
Table of Contents
INTRODUCTION...........................................................................................................................3
TASK 1............................................................................................................................................3
1.1................................................................................................................................................3
1.2................................................................................................................................................3
1.3................................................................................................................................................4
1.4................................................................................................................................................5
TASK 2............................................................................................................................................6
2.1................................................................................................................................................6
2.2................................................................................................................................................8
2.3................................................................................................................................................8
TASK 3............................................................................................................................................8
3.1................................................................................................................................................8
3.2..............................................................................................................................................10
TASK 4..........................................................................................................................................10
4.1..............................................................................................................................................10
4.2..............................................................................................................................................11
4.3..............................................................................................................................................11
4.4..............................................................................................................................................13
CONCLUSION..............................................................................................................................14
REFERENCES..............................................................................................................................16
INTRODUCTION
Decision making is an integral part of any business unit, it is the process to opt the
suitable option from the available resources so that effective decision can be made by the firm.
For impressive judgement it is necessary to forecast the outcome of each available option. BDM
assists in solving problems of workplace and support in improving quality of work of the
organizations (Resende and de Sousa, 2013). For the present report Ann's College is being taken
into account, currently college is facing the issue of poor student numbers and decrease in the
revenues. For resolving these problems, a research plan will be discussed which collect primary
and secondary data to identify the level of problems in the college. Study will illustrate the range
of techniques to analyses the data effectively. Project plan will be prepared to describe the
important activities with the use of software.
TASK 1
1.1
Problems are integral part of every organization. Some have sales issue or other have
poor management problems. Ann's college is being taken into account which is facing the issue
of poor performance presently (Wang and Zhang, 2013). Earlier college was known of its
progressive outlook. Lecturers are highly talented and having great knowledge. It is the
constituent educational institute of the university of Oxford in England. Business problems
which is attached with the college is that, it has lack of students. And due to this educational
institute is unable to give quality performance to its students. Its revenues are decreasing
continuously and currently it is unable to run business significantly. As people are not taking
interest now to take admission in such college because of poor performance. It is the major
problems and due to this it will have to close the college soon. To overcome from this situation is
very important for Ann's college.
1.2
Decisions of any business unit decides growth of the company (Kacprzyk and Fedrizzi,
2012). To make effective judgement it is necessary to collect several informations with the use of
several techniques. According to given scenario Ann's college is facing the problem of declining
performance due to poor students number, which decreases revenues of the college. Therefore, it
⊘ This is a preview!⊘
Do you want full access?
Subscribe today to unlock all pages.
Trusted by 1+ million students worldwide
is required to conduct proper research so that number of learners can get increased in the
educational institution. To collect vital informations two main sources can be used by researcher: Primary sources: It is the source of collecting information, researcher own self gather all
relevant data by using several techniques. By using this source scholar will be able to
collect specific information which can give benefit to the college (Croskerry, 2013).
Survey is the great method which can give authentic data to the researcher. For survey,
scholar will choose online mediums such as social sites, emails to communicate with
mass audience. In addition to this, Ann's college will opt the option of questionnaire, so
that students can fill these questions and management can identify the root of the
problem.
Secondary sources: It is the source which is already available and is scrutinized by the
researcher so that individual can take effective decision for the business. Scholar will
identify its financial statements, annual reports, students records of previous years so that
actual risk and potential opportunities can be identified by Ann's College. These data can
be gathered through journals, online articles, books, college website etc (Studer and et. al,
2015).
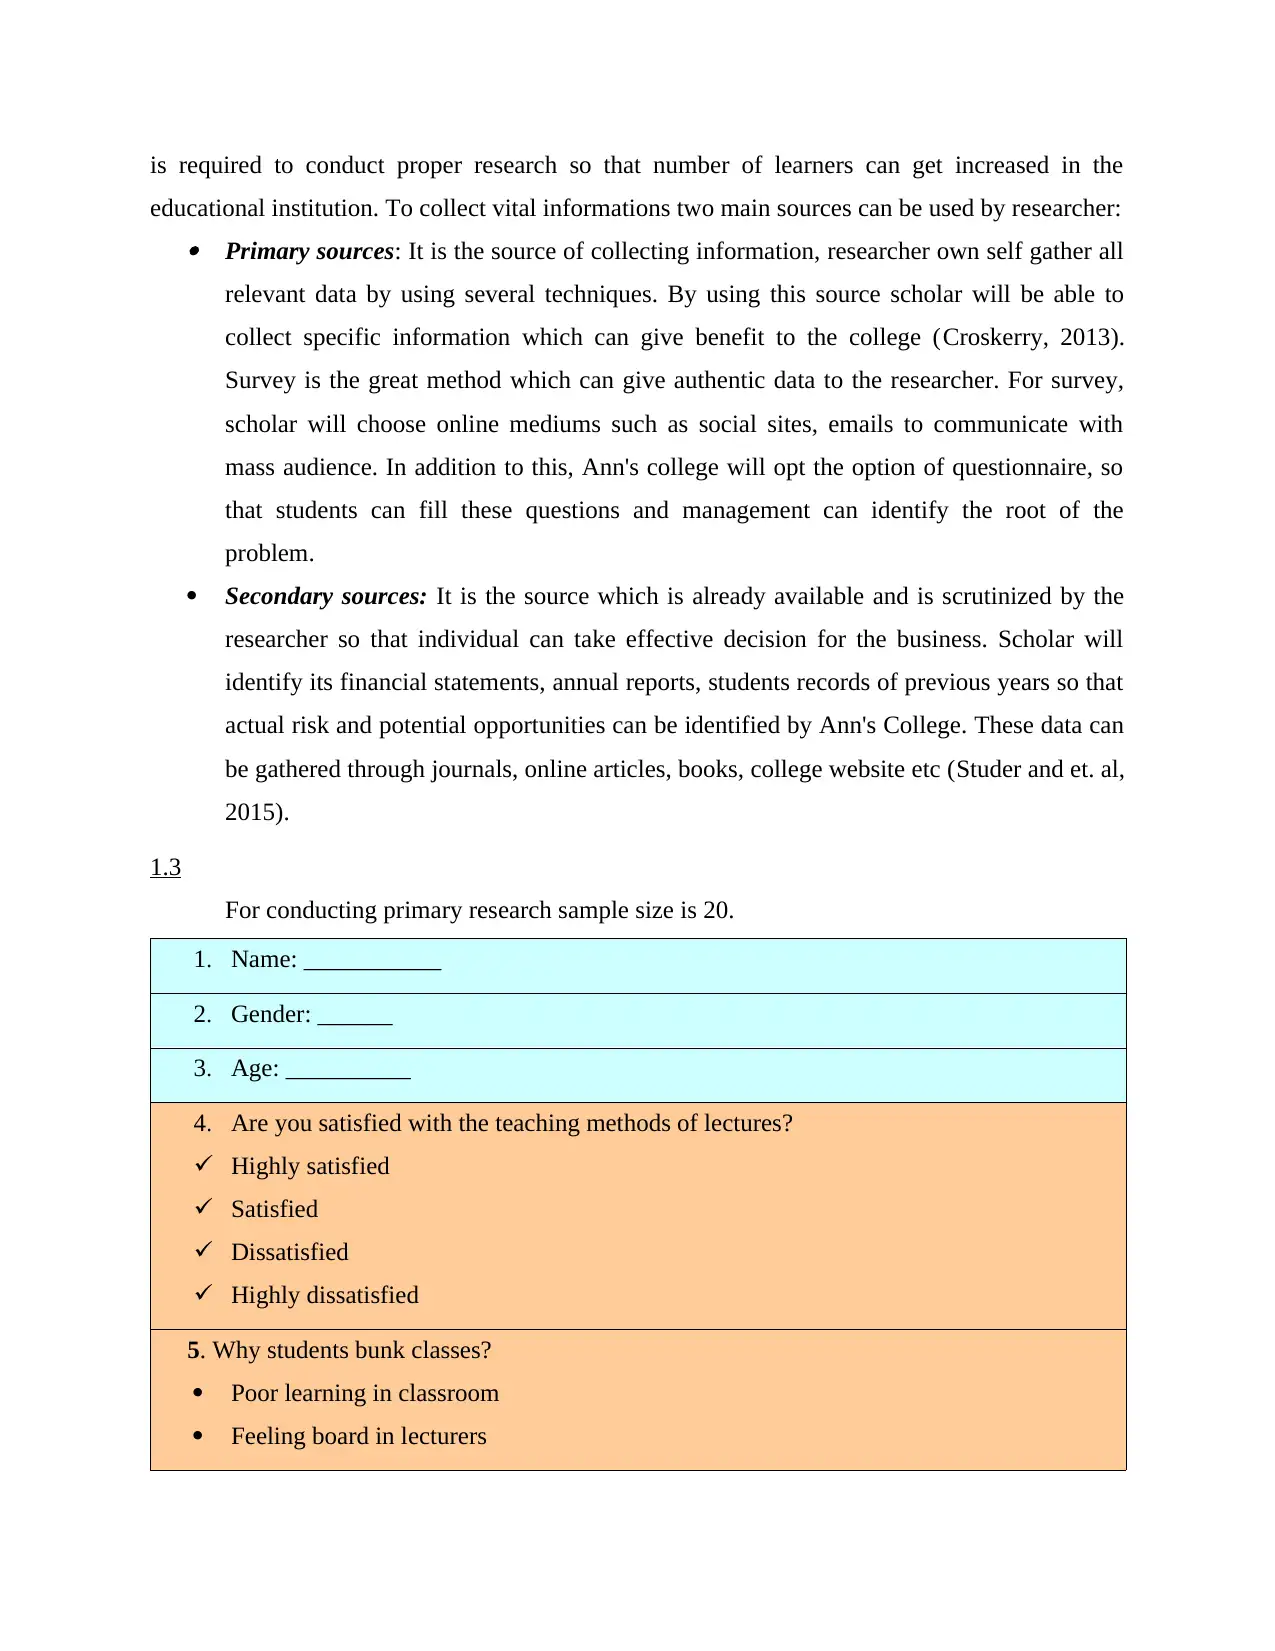
1.3
For conducting primary research sample size is 20.
1. Name: ___________
2. Gender: ______
3. Age: __________
4. Are you satisfied with the teaching methods of lectures?
Highly satisfied
Satisfied
Dissatisfied
Highly dissatisfied
5. Why students bunk classes?
Poor learning in classroom
Feeling board in lecturers
educational institution. To collect vital informations two main sources can be used by researcher: Primary sources: It is the source of collecting information, researcher own self gather all
relevant data by using several techniques. By using this source scholar will be able to
collect specific information which can give benefit to the college (Croskerry, 2013).
Survey is the great method which can give authentic data to the researcher. For survey,
scholar will choose online mediums such as social sites, emails to communicate with
mass audience. In addition to this, Ann's college will opt the option of questionnaire, so
that students can fill these questions and management can identify the root of the
problem.
Secondary sources: It is the source which is already available and is scrutinized by the
researcher so that individual can take effective decision for the business. Scholar will
identify its financial statements, annual reports, students records of previous years so that
actual risk and potential opportunities can be identified by Ann's College. These data can
be gathered through journals, online articles, books, college website etc (Studer and et. al,
2015).
1.3
For conducting primary research sample size is 20.
1. Name: ___________
2. Gender: ______
3. Age: __________
4. Are you satisfied with the teaching methods of lectures?
Highly satisfied
Satisfied
Dissatisfied
Highly dissatisfied
5. Why students bunk classes?
Poor learning in classroom
Feeling board in lecturers
Paraphrase This Document
Need a fresh take? Get an instant paraphrase of this document with our AI Paraphraser
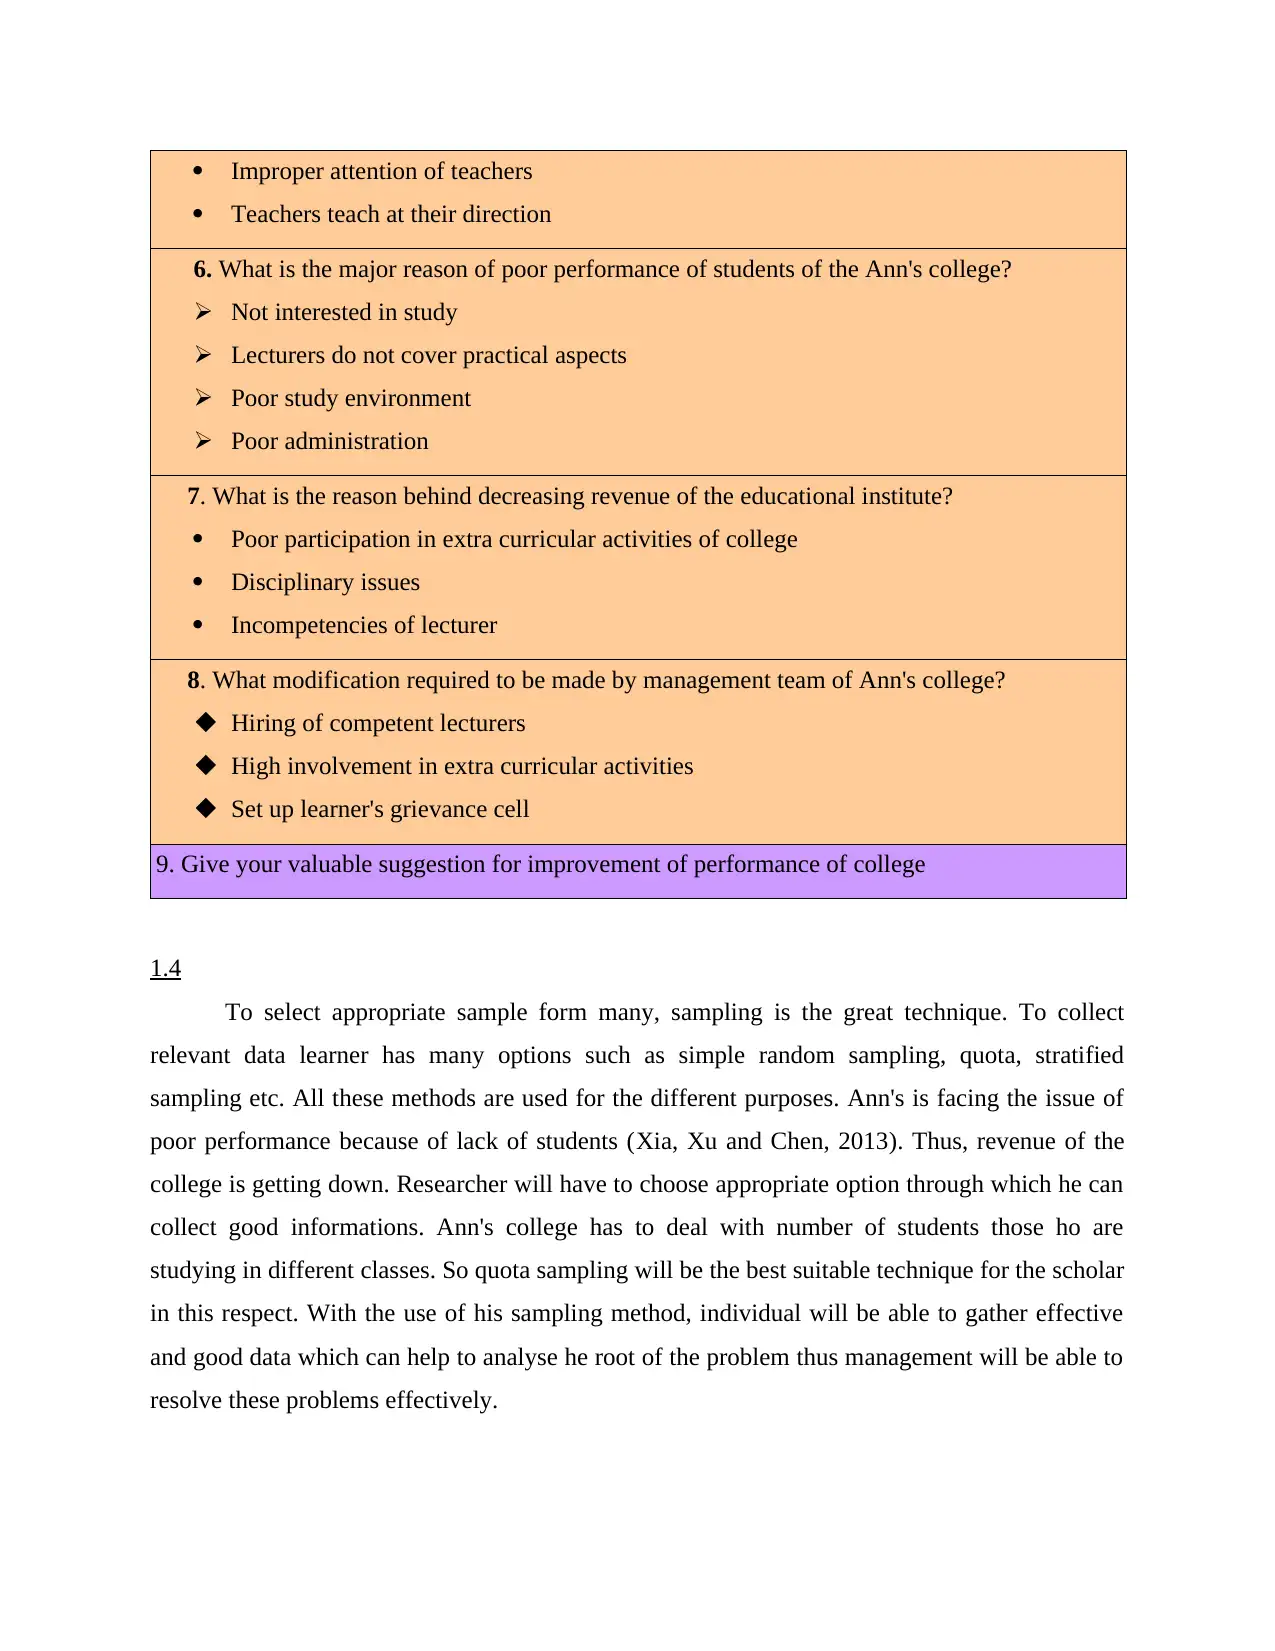
Improper attention of teachers
Teachers teach at their direction
6. What is the major reason of poor performance of students of the Ann's college?
Not interested in study
Lecturers do not cover practical aspects
Poor study environment
Poor administration
7. What is the reason behind decreasing revenue of the educational institute?
Poor participation in extra curricular activities of college
Disciplinary issues
Incompetencies of lecturer
8. What modification required to be made by management team of Ann's college?
Hiring of competent lecturers
High involvement in extra curricular activities
Set up learner's grievance cell
9. Give your valuable suggestion for improvement of performance of college
1.4
To select appropriate sample form many, sampling is the great technique. To collect
relevant data learner has many options such as simple random sampling, quota, stratified
sampling etc. All these methods are used for the different purposes. Ann's is facing the issue of
poor performance because of lack of students (Xia, Xu and Chen, 2013). Thus, revenue of the
college is getting down. Researcher will have to choose appropriate option through which he can
collect good informations. Ann's college has to deal with number of students those ho are
studying in different classes. So quota sampling will be the best suitable technique for the scholar
in this respect. With the use of his sampling method, individual will be able to gather effective
and good data which can help to analyse he root of the problem thus management will be able to
resolve these problems effectively.
TASK 2
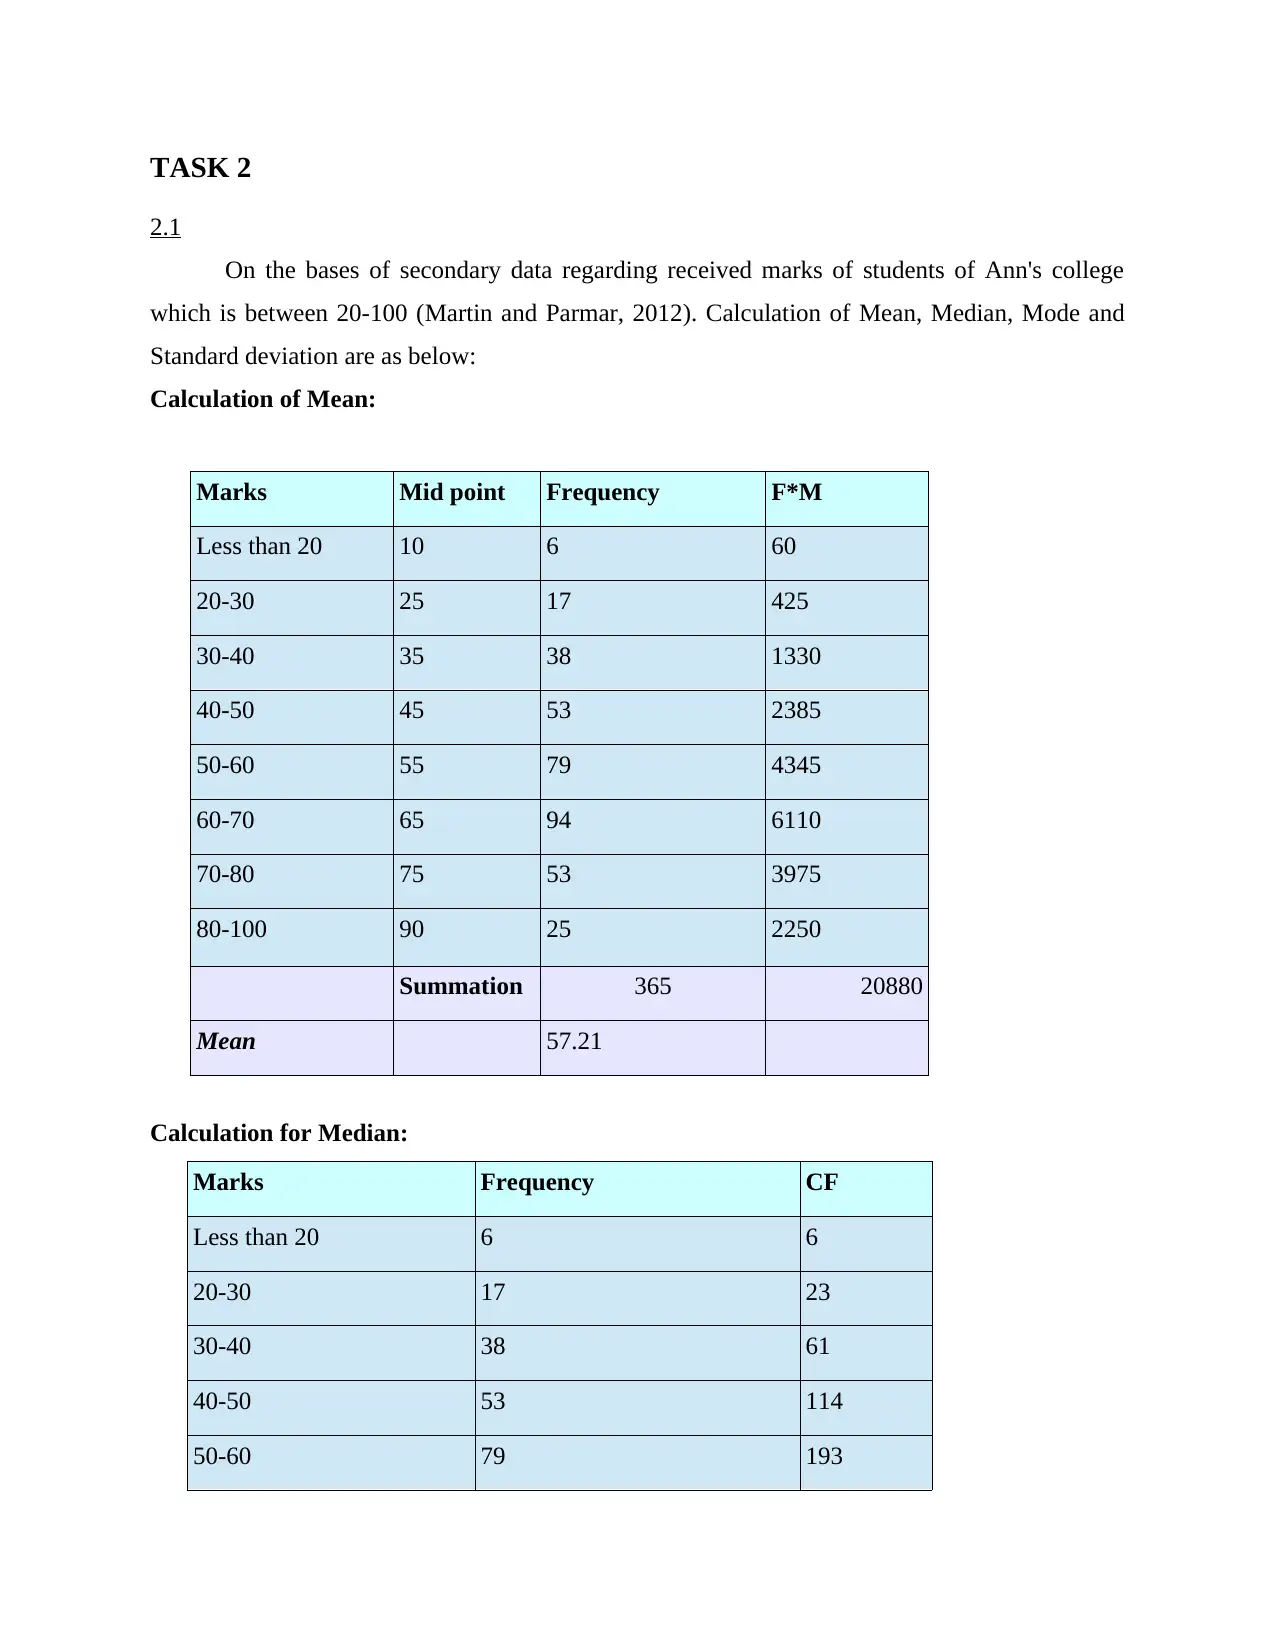
2.1
On the bases of secondary data regarding received marks of students of Ann's college
which is between 20-100 (Martin and Parmar, 2012). Calculation of Mean, Median, Mode and
Standard deviation are as below:
Calculation of Mean:
Marks Mid point Frequency F*M
Less than 20 10 6 60
20-30 25 17 425
30-40 35 38 1330
40-50 45 53 2385
50-60 55 79 4345
60-70 65 94 6110
70-80 75 53 3975
80-100 90 25 2250
Summation 365 20880
Mean 57.21
Calculation for Median:
Marks Frequency CF
Less than 20 6 6
20-30 17 23
30-40 38 61
40-50 53 114
50-60 79 193
⊘ This is a preview!⊘
Do you want full access?
Subscribe today to unlock all pages.
Trusted by 1+ million students worldwide
60-70 94 287
70-80 53 340
80-100 25 365
365
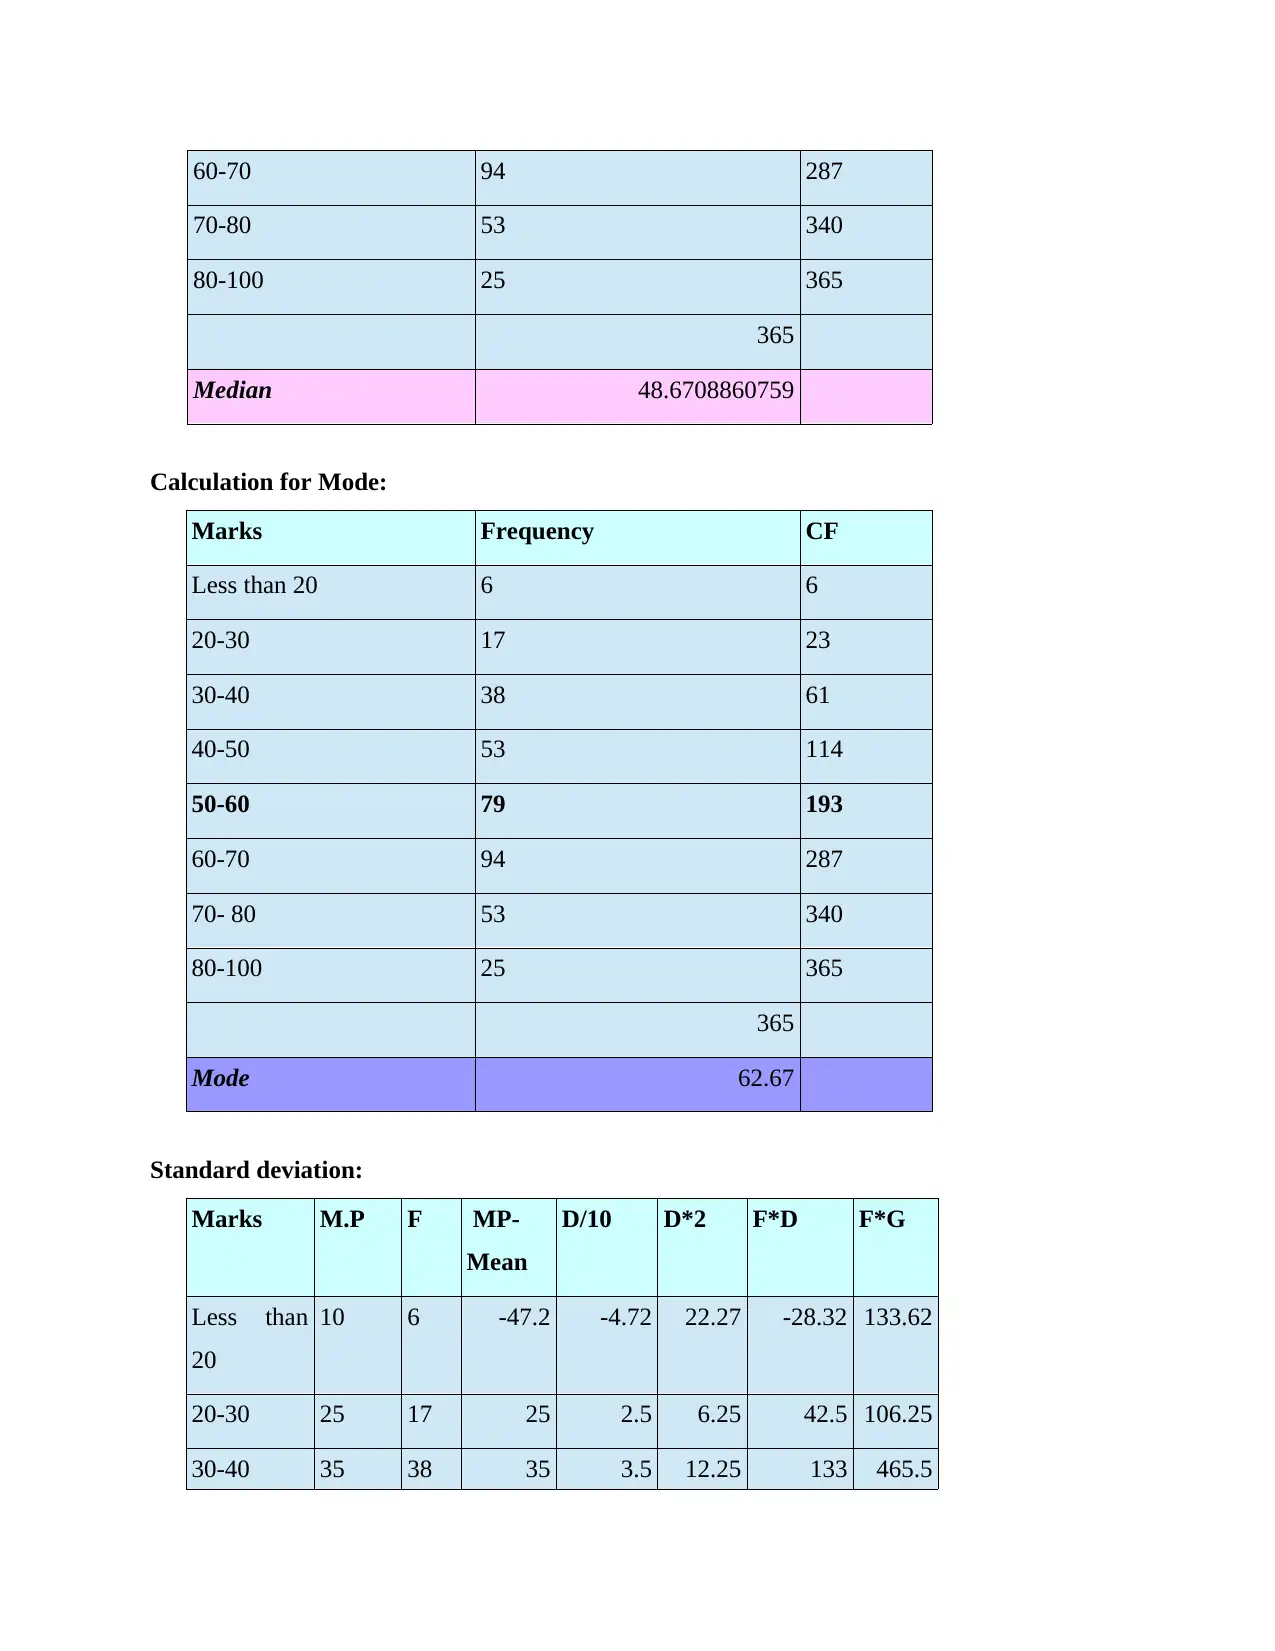
Median 48.6708860759
Calculation for Mode:
Marks Frequency CF
Less than 20 6 6
20-30 17 23
30-40 38 61
40-50 53 114
50-60 79 193
60-70 94 287
70- 80 53 340
80-100 25 365
365
Mode 62.67
Standard deviation:
Marks M.P F MP-
Mean
D/10 D*2 F*D F*G
Less than
20
10 6 -47.2 -4.72 22.27 -28.32 133.62
20-30 25 17 25 2.5 6.25 42.5 106.25
30-40 35 38 35 3.5 12.25 133 465.5
70-80 53 340
80-100 25 365
365
Median 48.6708860759
Calculation for Mode:
Marks Frequency CF
Less than 20 6 6
20-30 17 23
30-40 38 61
40-50 53 114
50-60 79 193
60-70 94 287
70- 80 53 340
80-100 25 365
365
Mode 62.67
Standard deviation:
Marks M.P F MP-
Mean
D/10 D*2 F*D F*G
Less than
20
10 6 -47.2 -4.72 22.27 -28.32 133.62
20-30 25 17 25 2.5 6.25 42.5 106.25
30-40 35 38 35 3.5 12.25 133 465.5
Paraphrase This Document
Need a fresh take? Get an instant paraphrase of this document with our AI Paraphraser
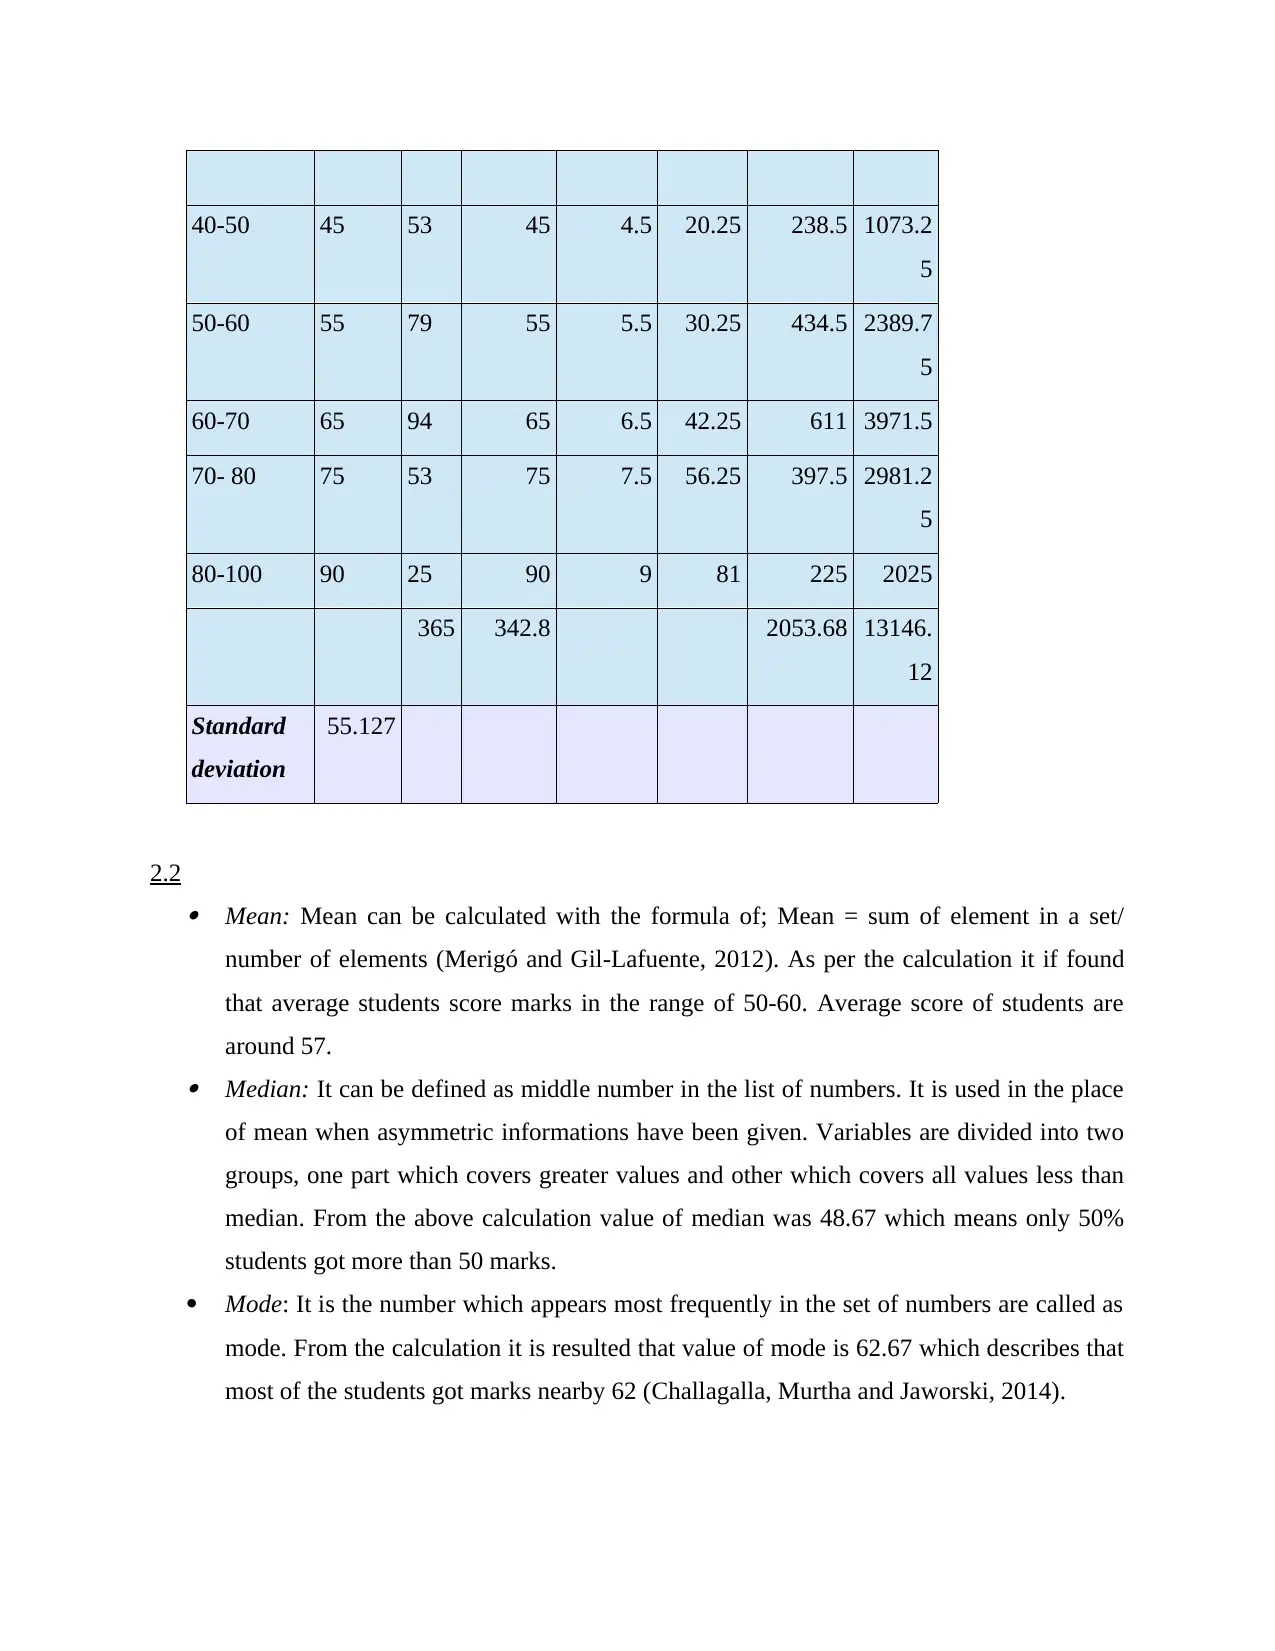
40-50 45 53 45 4.5 20.25 238.5 1073.2
5
50-60 55 79 55 5.5 30.25 434.5 2389.7
5
60-70 65 94 65 6.5 42.25 611 3971.5
70- 80 75 53 75 7.5 56.25 397.5 2981.2
5
80-100 90 25 90 9 81 225 2025
365 342.8 2053.68 13146.
12
Standard
deviation
55.127
2.2 Mean: Mean can be calculated with the formula of; Mean = sum of element in a set/
number of elements (Merigó and Gil-Lafuente, 2012). As per the calculation it if found
that average students score marks in the range of 50-60. Average score of students are
around 57. Median: It can be defined as middle number in the list of numbers. It is used in the place
of mean when asymmetric informations have been given. Variables are divided into two
groups, one part which covers greater values and other which covers all values less than
median. From the above calculation value of median was 48.67 which means only 50%
students got more than 50 marks.
Mode: It is the number which appears most frequently in the set of numbers are called as
mode. From the calculation it is resulted that value of mode is 62.67 which describes that
most of the students got marks nearby 62 (Challagalla, Murtha and Jaworski, 2014).
5
50-60 55 79 55 5.5 30.25 434.5 2389.7
5
60-70 65 94 65 6.5 42.25 611 3971.5
70- 80 75 53 75 7.5 56.25 397.5 2981.2
5
80-100 90 25 90 9 81 225 2025
365 342.8 2053.68 13146.
12
Standard
deviation
55.127
2.2 Mean: Mean can be calculated with the formula of; Mean = sum of element in a set/
number of elements (Merigó and Gil-Lafuente, 2012). As per the calculation it if found
that average students score marks in the range of 50-60. Average score of students are
around 57. Median: It can be defined as middle number in the list of numbers. It is used in the place
of mean when asymmetric informations have been given. Variables are divided into two
groups, one part which covers greater values and other which covers all values less than
median. From the above calculation value of median was 48.67 which means only 50%
students got more than 50 marks.
Mode: It is the number which appears most frequently in the set of numbers are called as
mode. From the calculation it is resulted that value of mode is 62.67 which describes that
most of the students got marks nearby 62 (Challagalla, Murtha and Jaworski, 2014).
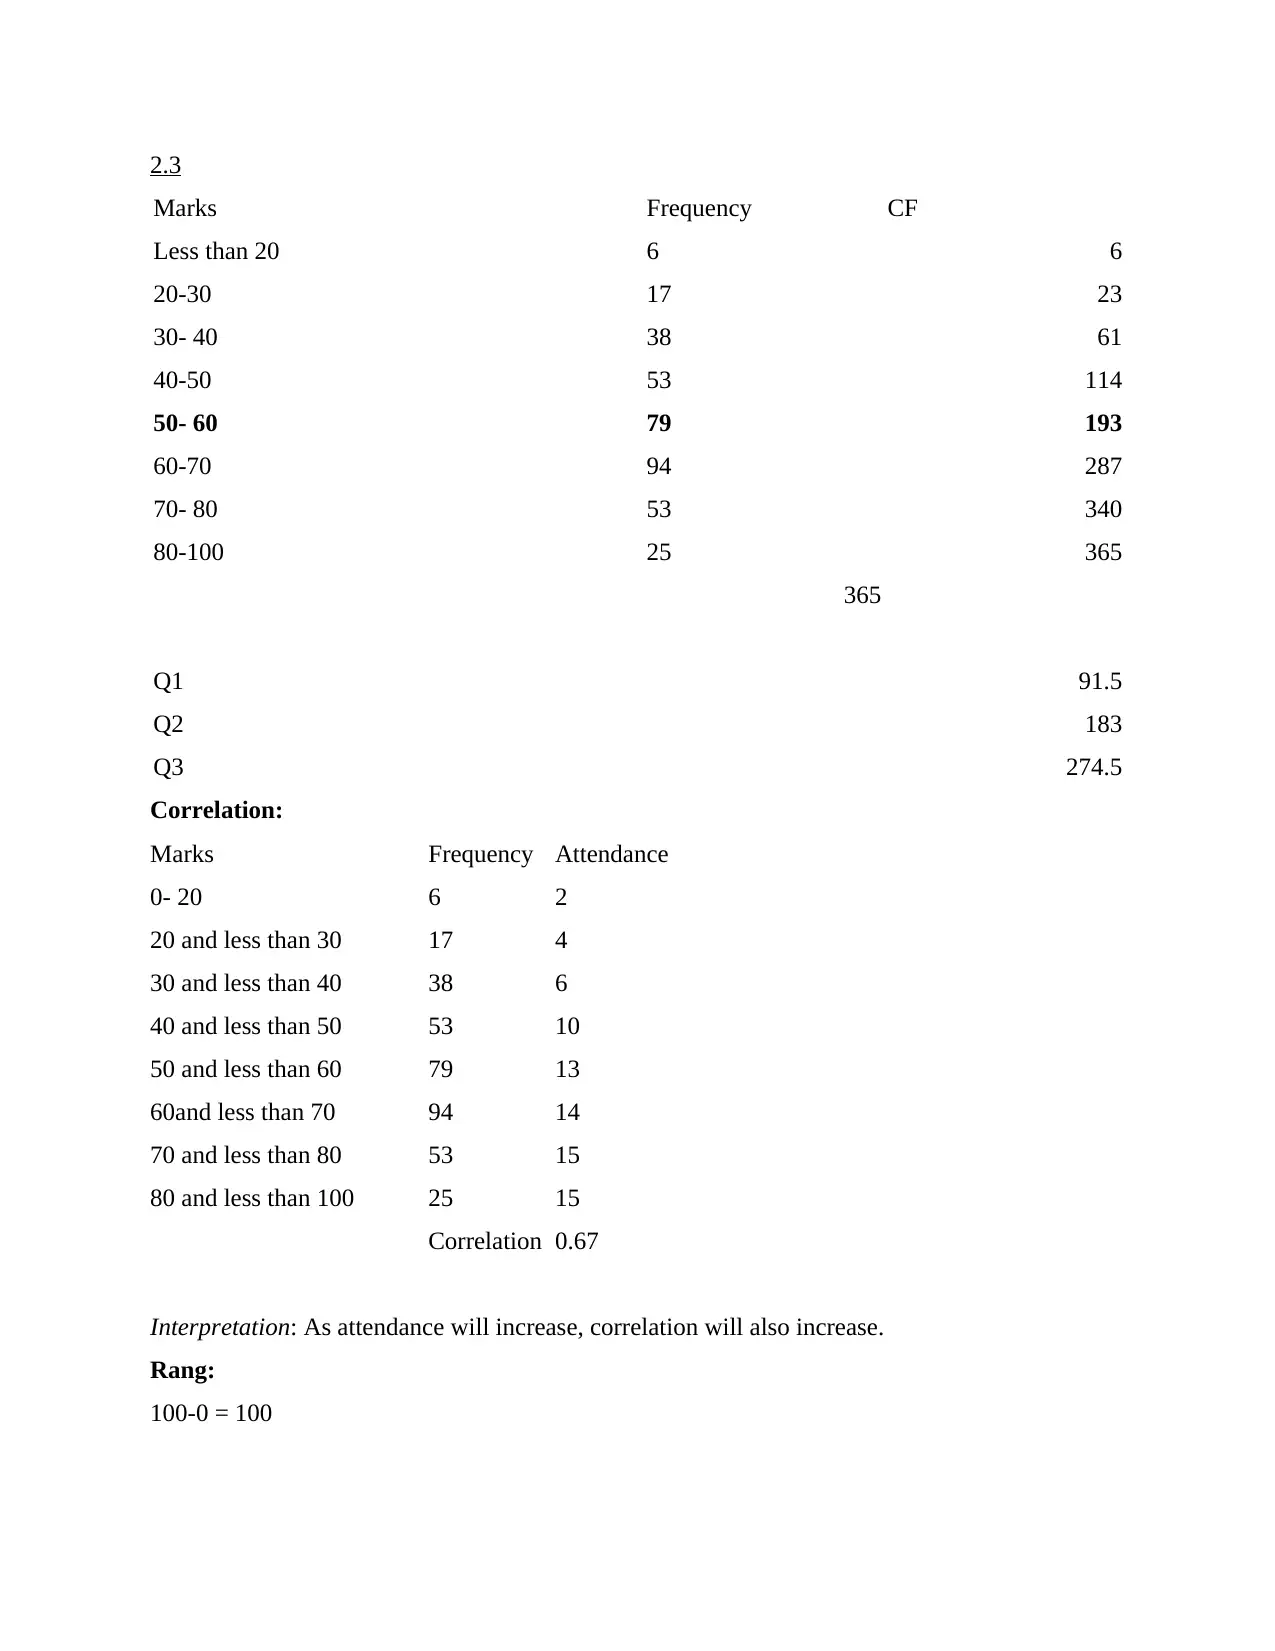
2.3
Marks Frequency CF
Less than 20 6 6
20-30 17 23
30- 40 38 61
40-50 53 114
50- 60 79 193
60-70 94 287
70- 80 53 340
80-100 25 365
365
Q1 91.5
Q2 183
Q3 274.5
Correlation:
Marks Frequency Attendance
0- 20 6 2
20 and less than 30 17 4
30 and less than 40 38 6
40 and less than 50 53 10
50 and less than 60 79 13
60and less than 70 94 14
70 and less than 80 53 15
80 and less than 100 25 15
Correlation 0.67
Interpretation: As attendance will increase, correlation will also increase.
Rang:
100-0 = 100
⊘ This is a preview!⊘
Do you want full access?
Subscribe today to unlock all pages.
Trusted by 1+ million students worldwide
TASK 3
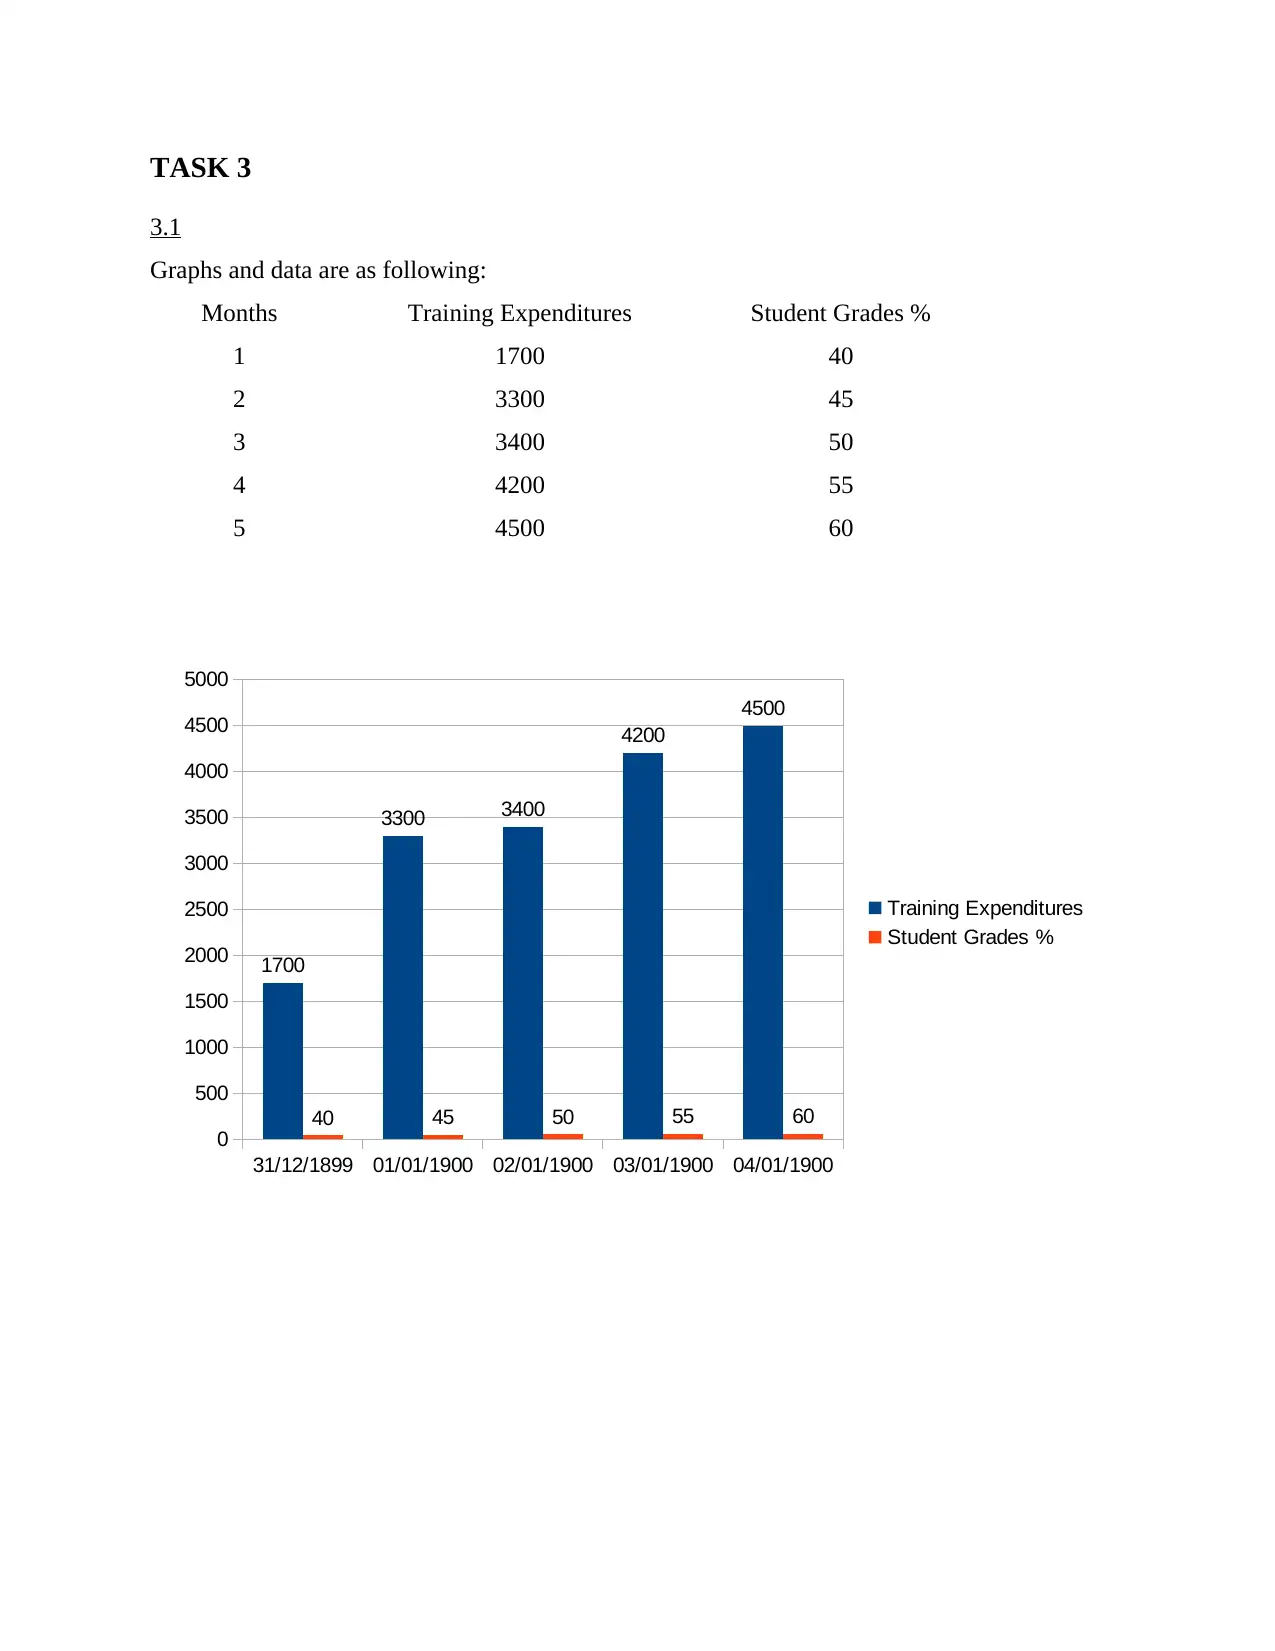
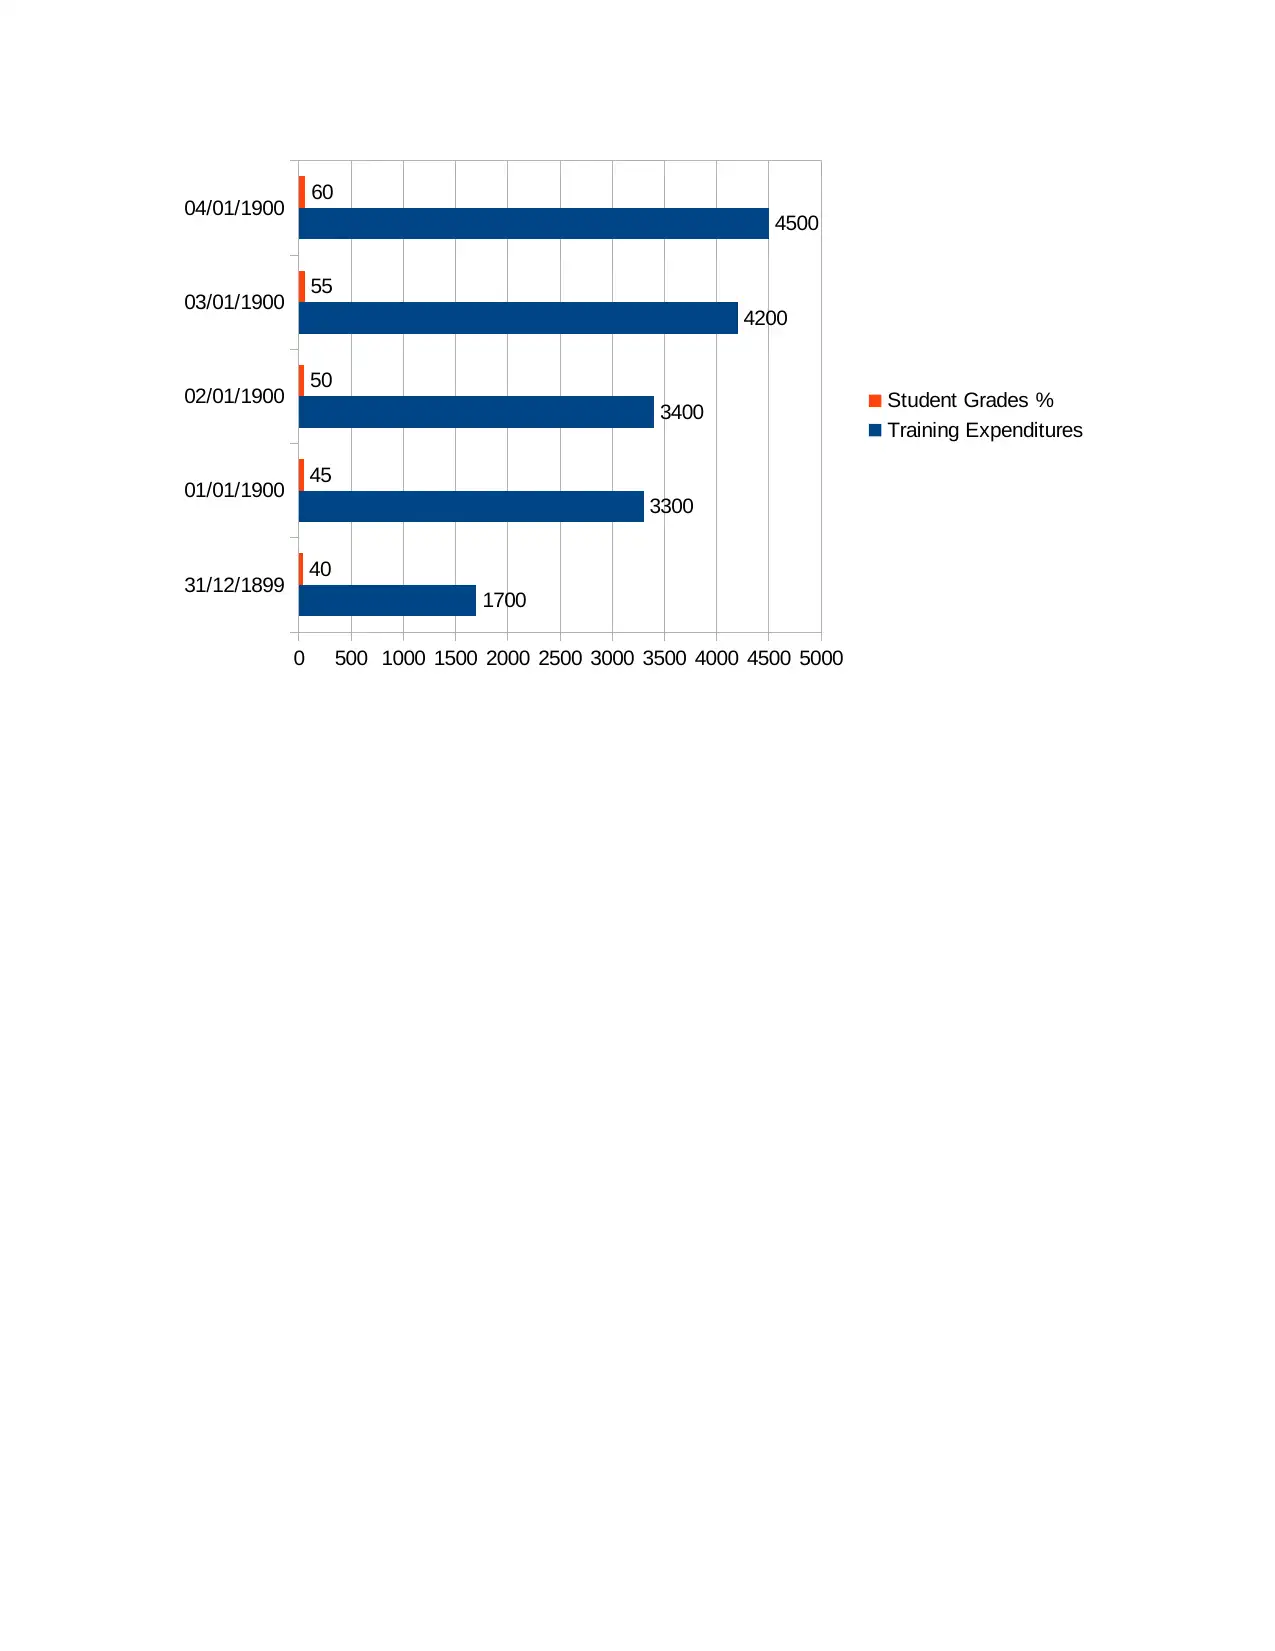
3.1
Graphs and data are as following:
Months Training Expenditures Student Grades %
1 1700 40
2 3300 45
3 3400 50
4 4200 55
5 4500 60
31/12/1899 01/01/1900 02/01/1900 03/01/1900 04/01/1900
0
500
1000
1500
2000
2500
3000
3500
4000
4500
5000
1700
3300 3400
4200
4500
40 45 50 55 60
Training Expenditures
Student Grades %
Paraphrase This Document
Need a fresh take? Get an instant paraphrase of this document with our AI Paraphraser
31/12/1899
01/01/1900
02/01/1900
03/01/1900
04/01/1900
0 500 1000 1500 2000 2500 3000 3500 4000 4500 5000
1700
3300
3400
4200
4500
40
45
50
55
60
Student Grades %
Training Expenditures
01/01/1900
02/01/1900
03/01/1900
04/01/1900
0 500 1000 1500 2000 2500 3000 3500 4000 4500 5000
1700
3300
3400
4200
4500
40
45
50
55
60
Student Grades %
Training Expenditures
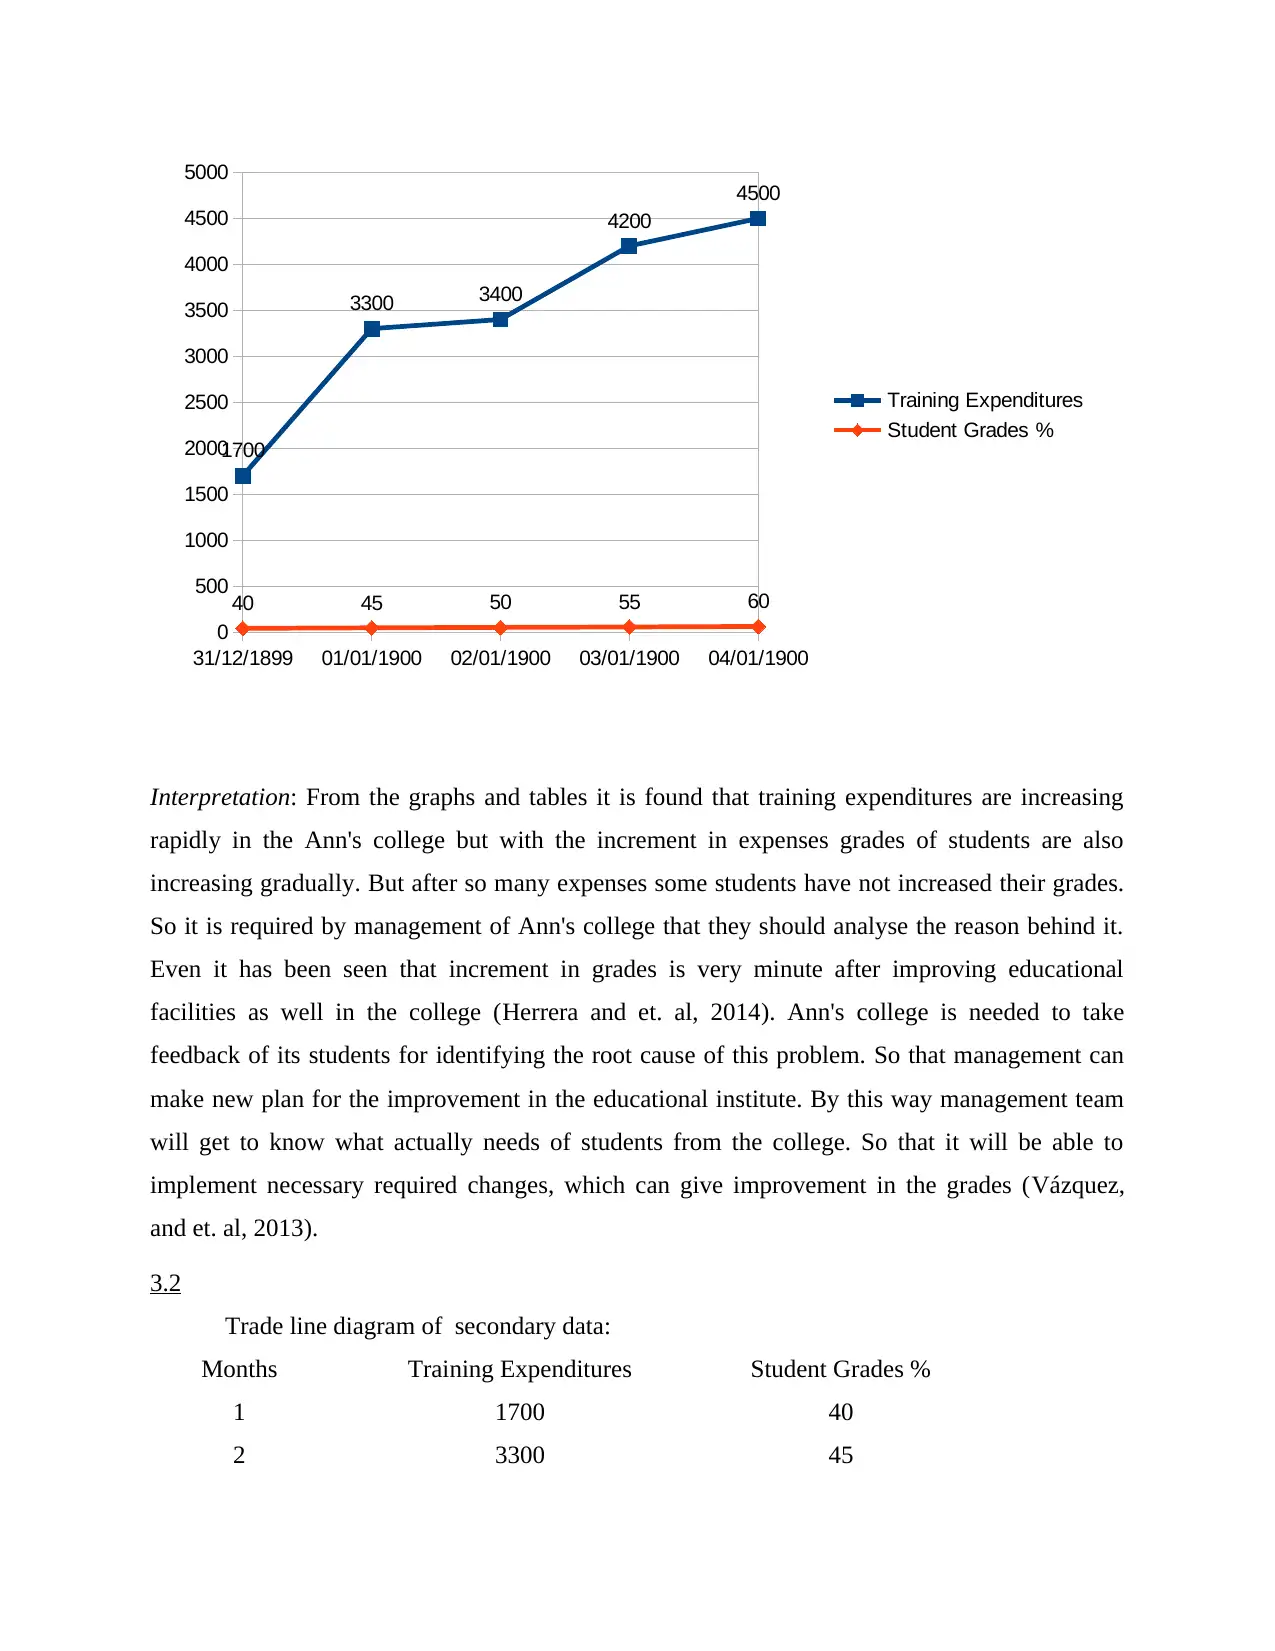
Interpretation: From the graphs and tables it is found that training expenditures are increasing
rapidly in the Ann's college but with the increment in expenses grades of students are also
increasing gradually. But after so many expenses some students have not increased their grades.
So it is required by management of Ann's college that they should analyse the reason behind it.
Even it has been seen that increment in grades is very minute after improving educational
facilities as well in the college (Herrera and et. al, 2014). Ann's college is needed to take
feedback of its students for identifying the root cause of this problem. So that management can
make new plan for the improvement in the educational institute. By this way management team
will get to know what actually needs of students from the college. So that it will be able to
implement necessary required changes, which can give improvement in the grades (Vázquez,
and et. al, 2013).
3.2
Trade line diagram of secondary data:
Months Training Expenditures Student Grades %
1 1700 40
2 3300 45
31/12/1899 01/01/1900 02/01/1900 03/01/1900 04/01/1900
0
500
1000
1500
2000
2500
3000
3500
4000
4500
5000
1700
3300 3400
4200
4500
40 45 50 55 60
Training Expenditures
Student Grades %
⊘ This is a preview!⊘
Do you want full access?
Subscribe today to unlock all pages.
Trusted by 1+ million students worldwide
1 out of 20
Related Documents


Your All-in-One AI-Powered Toolkit for Academic Success.
+13062052269
info@desklib.com
Available 24*7 on WhatsApp / Email
![[object Object]](/_next/static/media/star-bottom.7253800d.svg)
Unlock your academic potential
Copyright © 2020–2026 A2Z Services. All Rights Reserved. Developed and managed by ZUCOL.