Business Decision Making: Analyzing Financial Performance with Graphs

Verified

Added on  2023/04/23

|8
|652
|180
Report
AI Summary
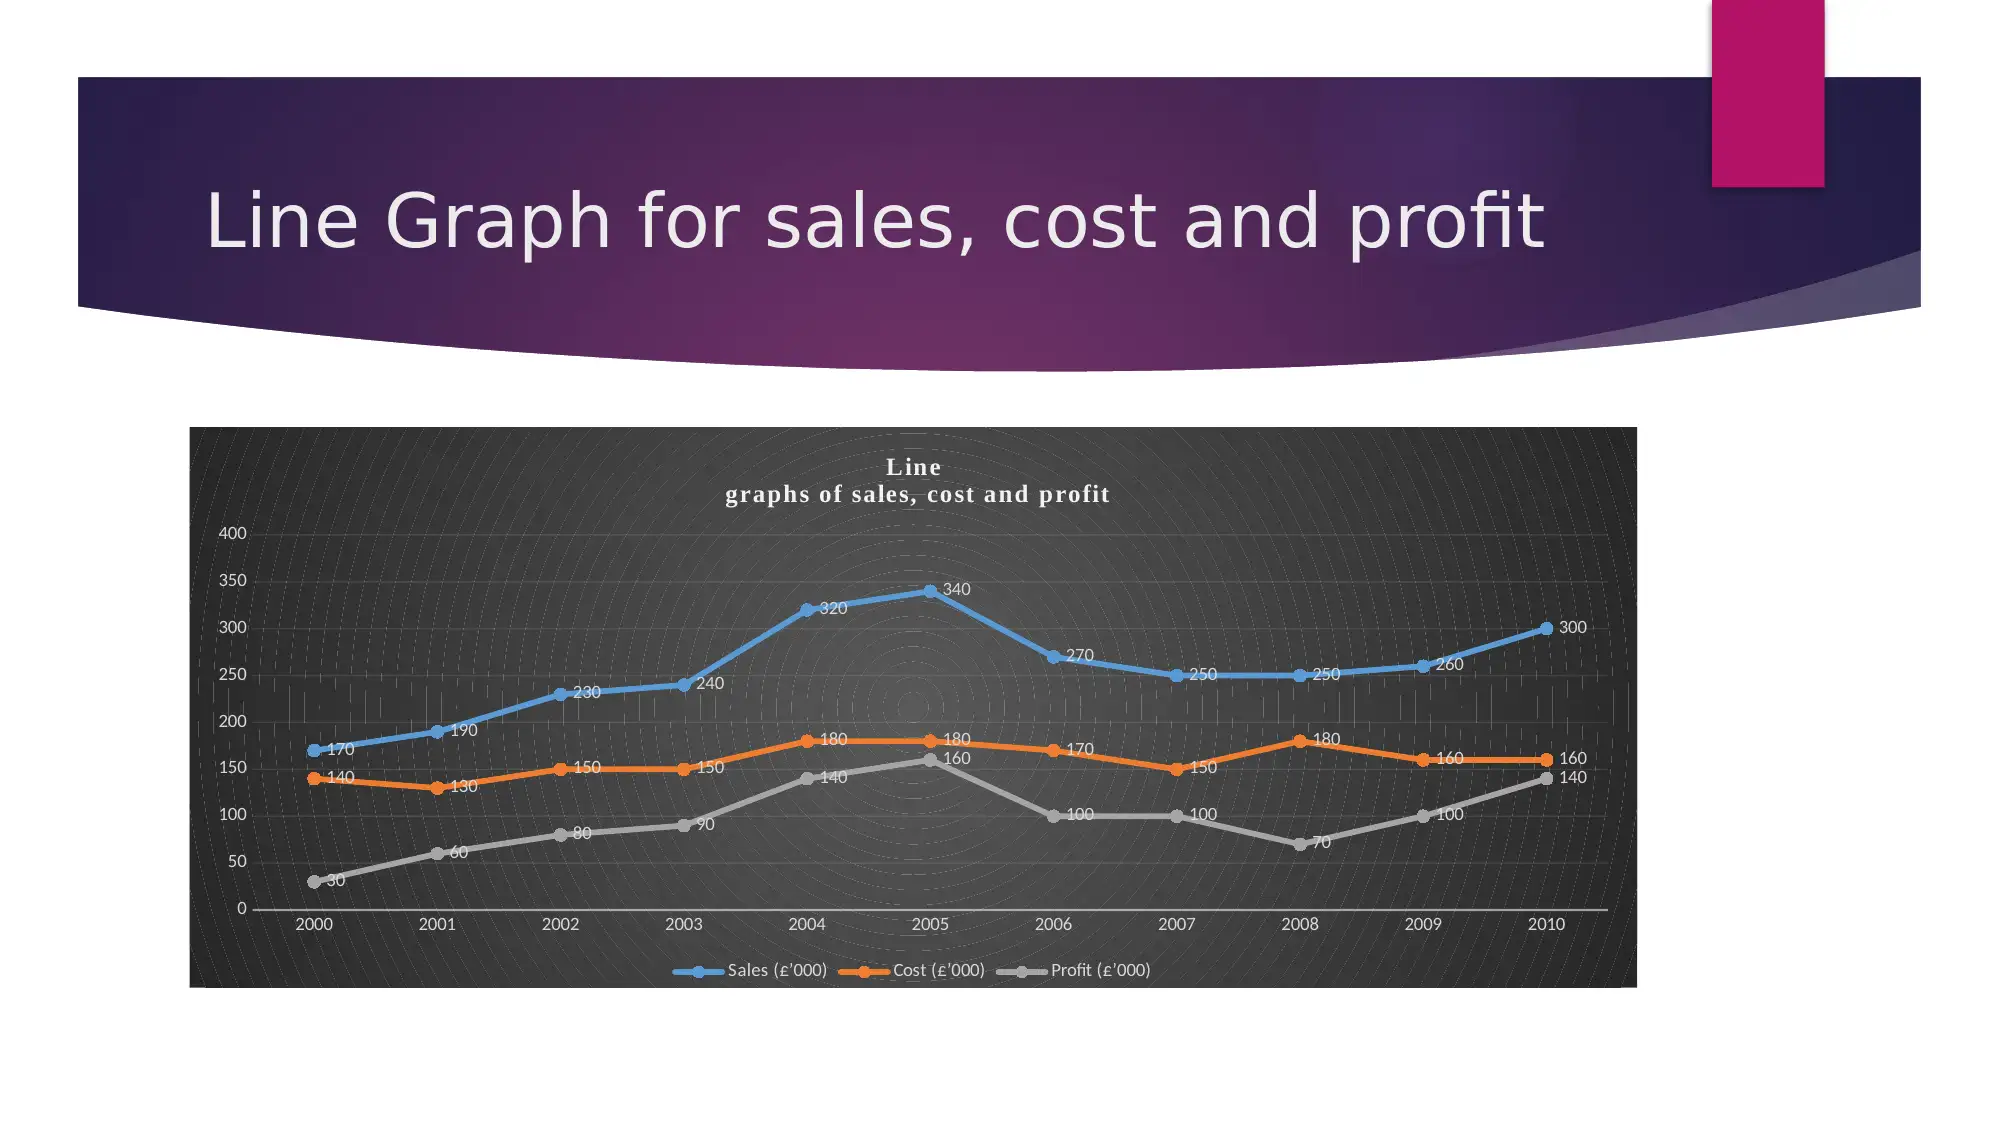
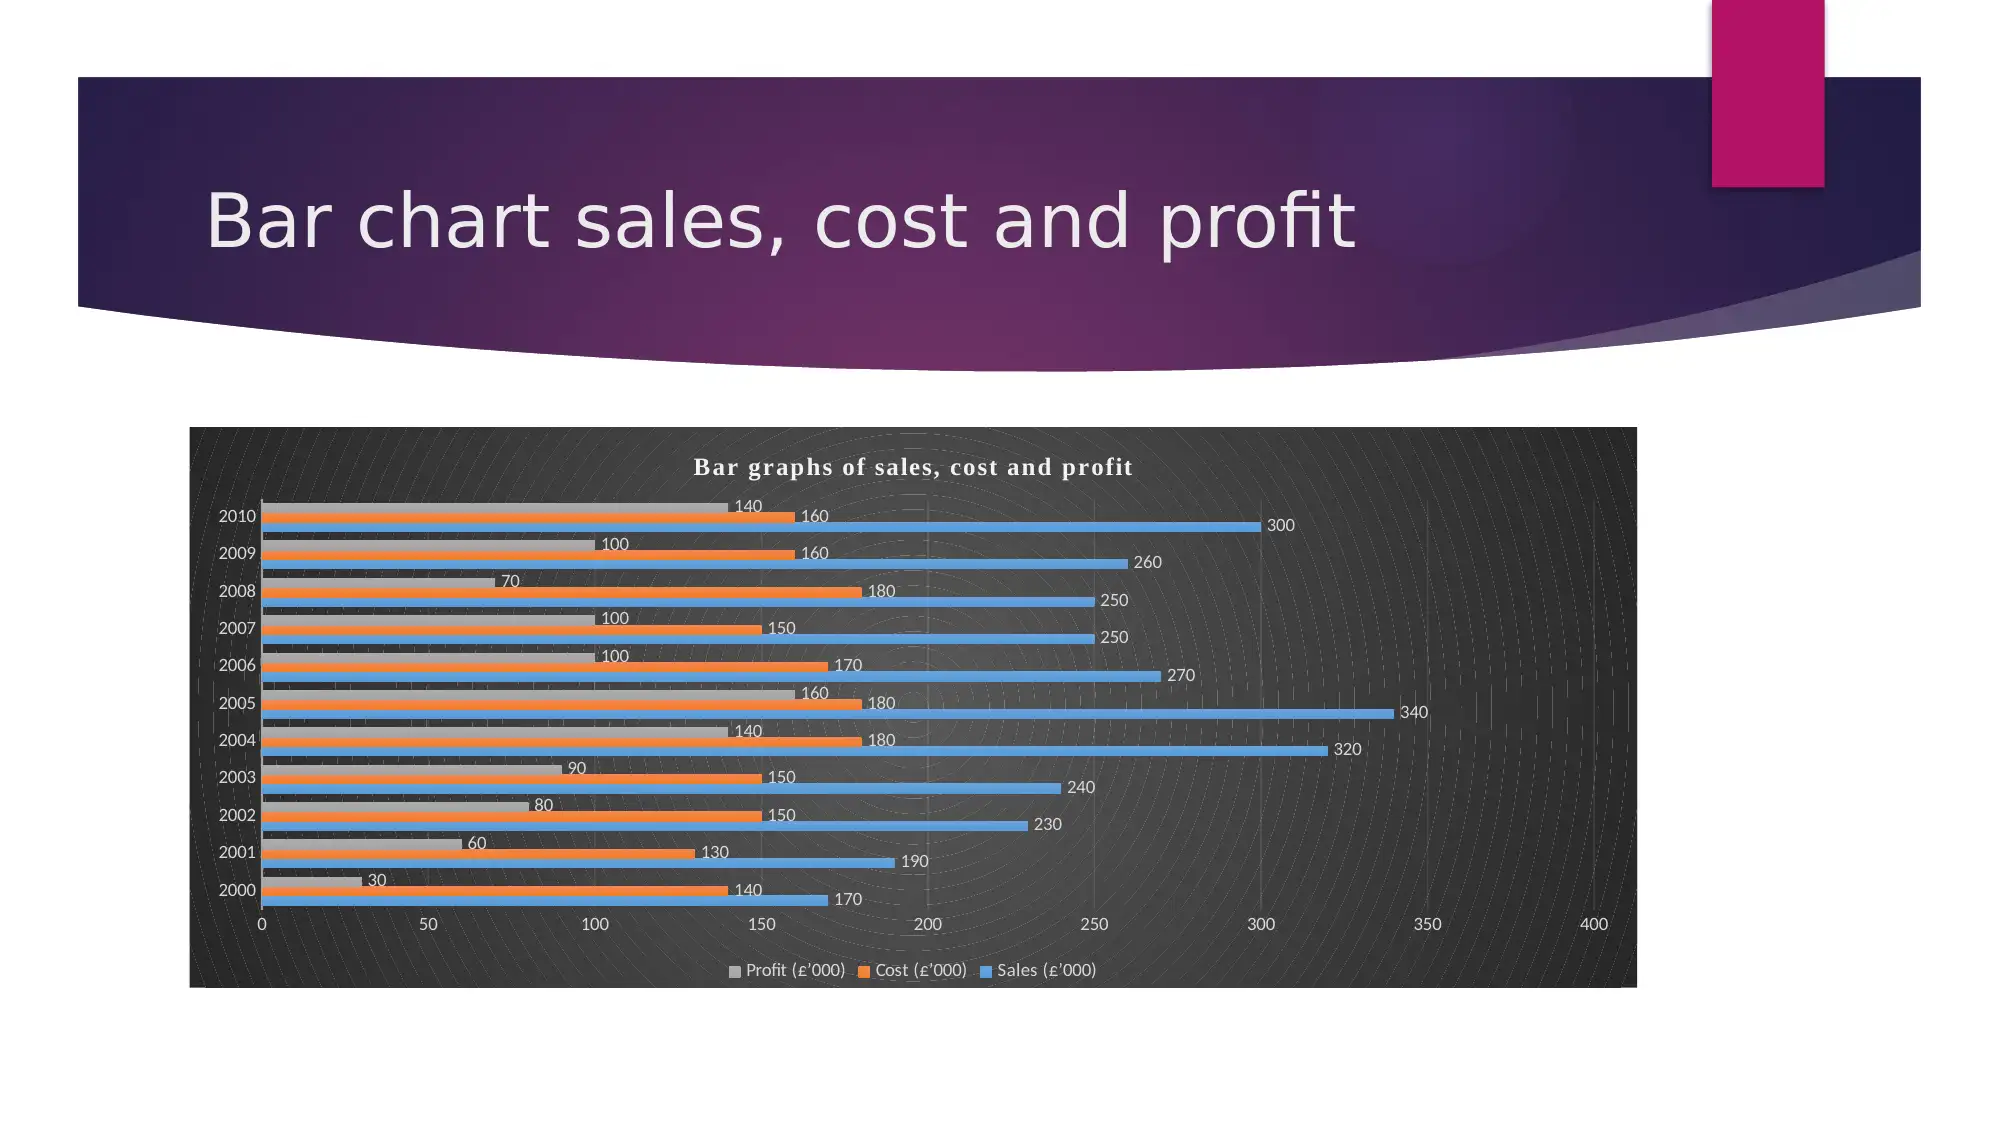
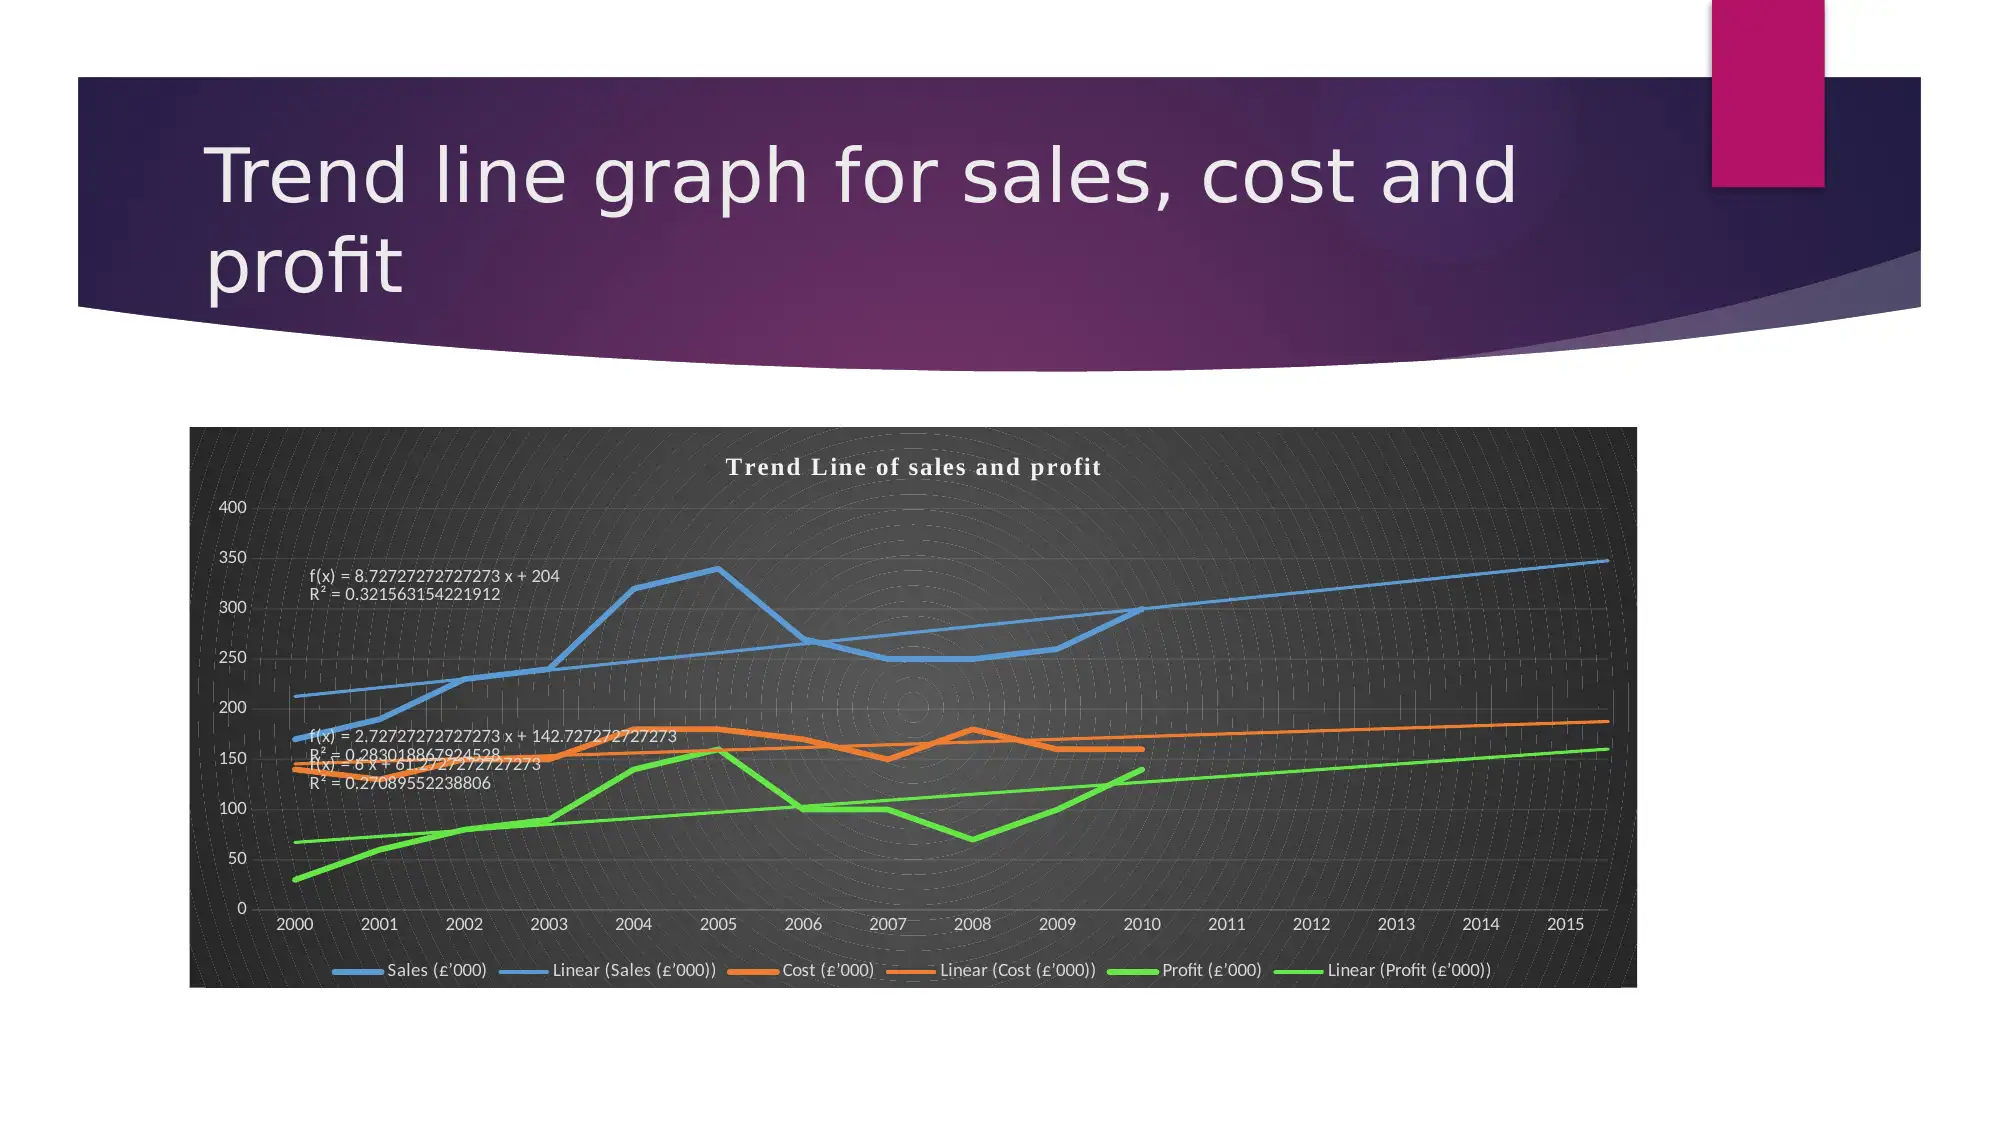
This report provides an analysis of business decision-making using graphical methods, focusing on the financial performance of Omega Consultants Limited. It applies line graphs, bar charts, and trend lines to analyze sales, costs, and profitability from 2000 to 2010. The study indicates that sales, costs, and profitability have generally increased over the years, suggesting strong future financial performance. However, the report emphasizes the importance of cost reduction activities to maintain or improve profitability. The analysis uses various references to support its findings and recommendations, highlighting the importance of data-driven decision-making in business.
tabler-icon-diamond-filled.svg

Contribute Materials

Your contribution can guide someone’s learning journey. Share your documents today.
Document Page
Business Decision
Making
tabler-icon-diamond-filled.svg

Secure Best Marks with AI Grader

Need help grading? Try our AI Grader for instant feedback on your assignments.
Document Page
introduction
Financial and operational decisions are considered
as major important decisions for companies.
Organization should apply appropriate techniques
at the time of decision making process .
Graphical presentation of sales, cost and
profitability helps in different types of business
decisions .
Document Page
Line Graph for sales, cost and profit
2000 2001 2002 2003 2004 2005 2006 2007 2008 2009 2010
0
50
100
150
200
250
300
350
400
170 190
230 240
320
340
270 250 250 260
300
140 130 150 150
180 180 170
150
180
160 160
30
60 80 90
140 160
100 100
70
100
140
Line
graphs of sales, cost and profit
Sales (£’000) Cost (£’000) Profit (£’000)
Document Page
Bar chart sales, cost and profit
2000
2001
2002
2003
2004
2005
2006
2007
2008
2009
2010
0 50 100 150 200 250 300 350 400
170
190
230
240
320
340
270
250
250
260
300
140
130
150
150
180
180
170
150
180
160
160
30
60
80
90
140
160
100
100
70
100
140
Bar graphs of sales, cost and profit
Profit (£’000) Cost (£’000) Sales (£’000)
tabler-icon-diamond-filled.svg

Secure Best Marks with AI Grader

Need help grading? Try our AI Grader for instant feedback on your assignments.
Document Page
Trend line graph for sales, cost and
profit
2000 2001 2002 2003 2004 2005 2006 2007 2008 2009 2010 2011 2012 2013 2014 2015
0
50
100
150
200
250
300
350
400
f(x) = 8.72727272727273 x + 204
R² = 0.321563154221912
f(x) = 2.72727272727273 x + 142.727272727273
R² = 0.283018867924528f(x) = 6 x + 61.2727272727273
R² = 0.27089552238806
Trend Line of sales and profit
Sales (£’000) Linear (Sales (£’000)) Cost (£’000) Linear (Cost (£’000)) Profit (£’000) Linear (Profit (£’000))
Document Page
Conclusion
Omega consultants limited wants to analyze the past financial
performance of the organization.
Study has applied graphical analysis methods for analyzing
financial performance of the company.
Sales, cost and profitability of the company is increasing year
by year.
Its future financial performance is also very strong.
But, it needs to focus on cost reduction activities otherwise
profitability of the organization may decline.
Document Page
reference
Little, B., 2011. The principles of successful project management: It takes careful planning, skilful
leadership … and a little bit of luck. Human Resource Management International Digest. 19(7).
pp.36 – 39.
Newbold, P. and et. al. 2009. Statistics for Business and Economics. Pearson Education
Prieto, M. A. and Revilla, E., 2006. Learning capability and business performance: a non-financial
and financial assessment. Learning Organization. 13(2). pp.166 – 185.
Smith, C. D., Bruyns, and Evans, S. M., 2011. A project manager's optimism and stress
management and IT project success. International Journal of Managing Projects in Business. 4(1).
pp.10 – 27.
Sucky, E., Aksoy, A., and Ozturk, N. 2012. A decision support system for demand forecasting in
the clothing industry. International Journal of Clothing Science and Technology. 24(4). pp.221 –
236.
Wallnöfer, M., and Hacklin, F. 2012. The business model in the practice of strategic decision
making: insights from a case study. Management Decision. 50(2). pp.166 – 188.
tabler-icon-diamond-filled.svg

Paraphrase This Document

Need a fresh take? Get an instant paraphrase of this document with our AI Paraphraser
Document Page
Thank
you
chevron_up_icon
1 out of 8
circle_padding
hide_on_mobile
zoom_out_icon
logo.png

Your All-in-One AI-Powered Toolkit for Academic Success.

Available 24*7 on WhatsApp / Email

[object Object]