Business Decision Making: Data Analysis, Findings and Suggestions

Verified

Added on  2023/03/24

|15
|472
|69
Report
AI Summary
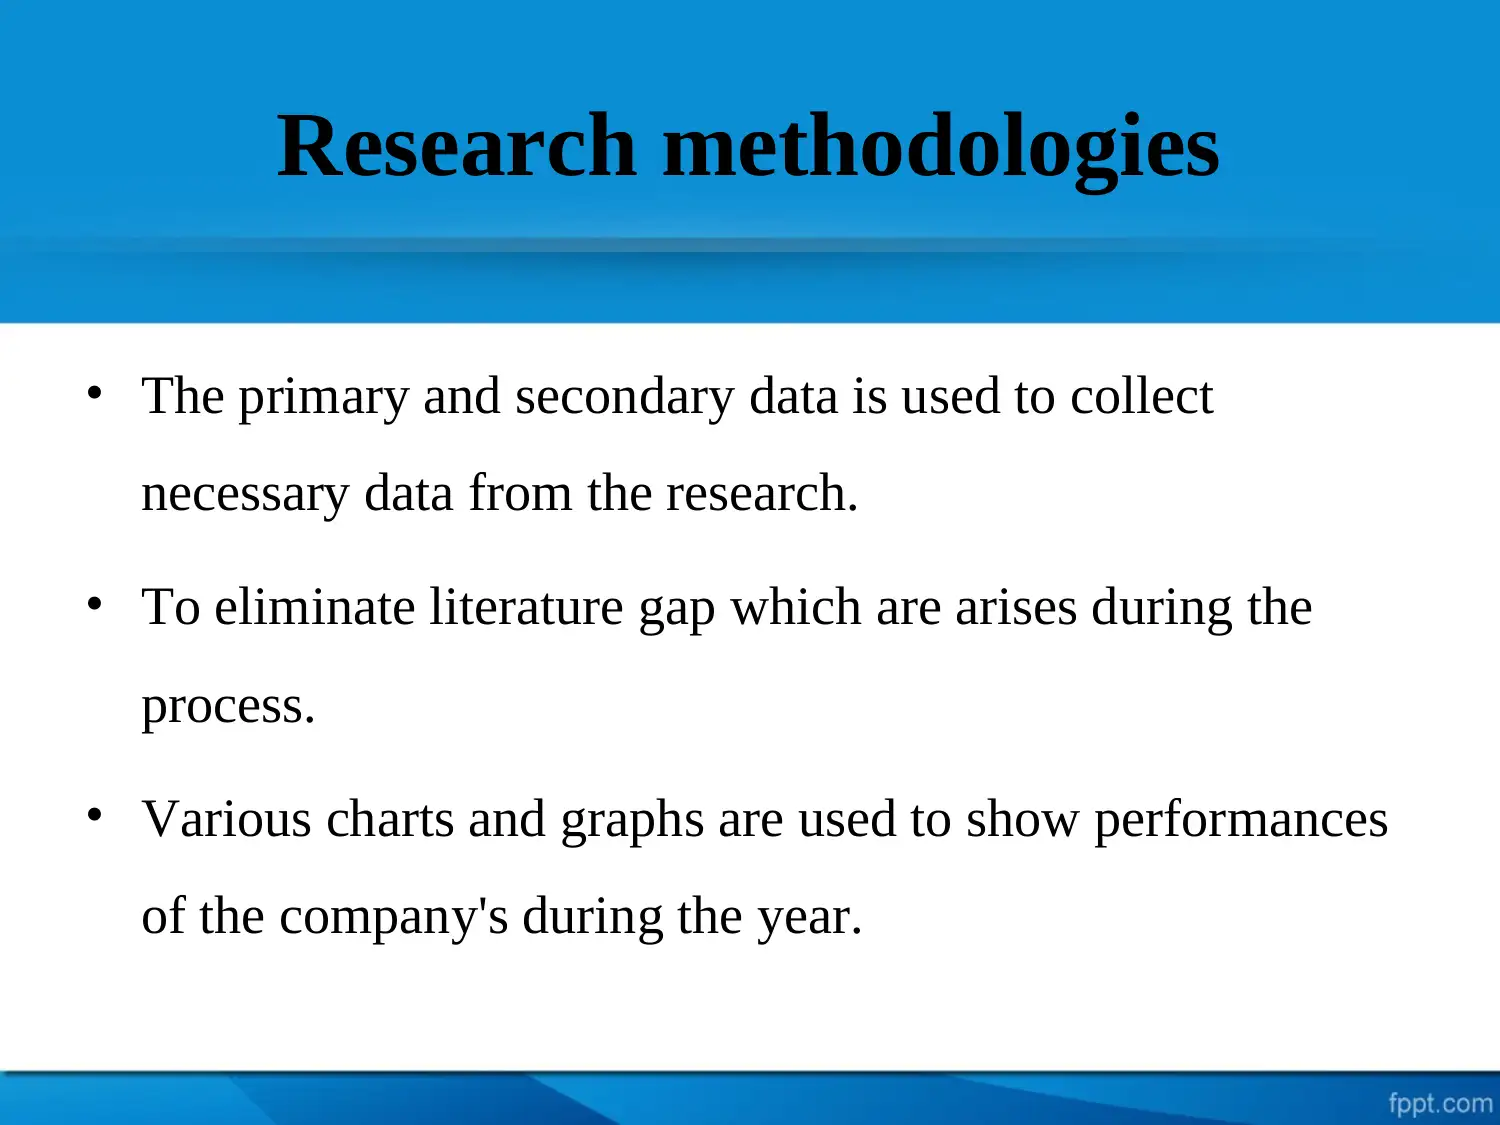
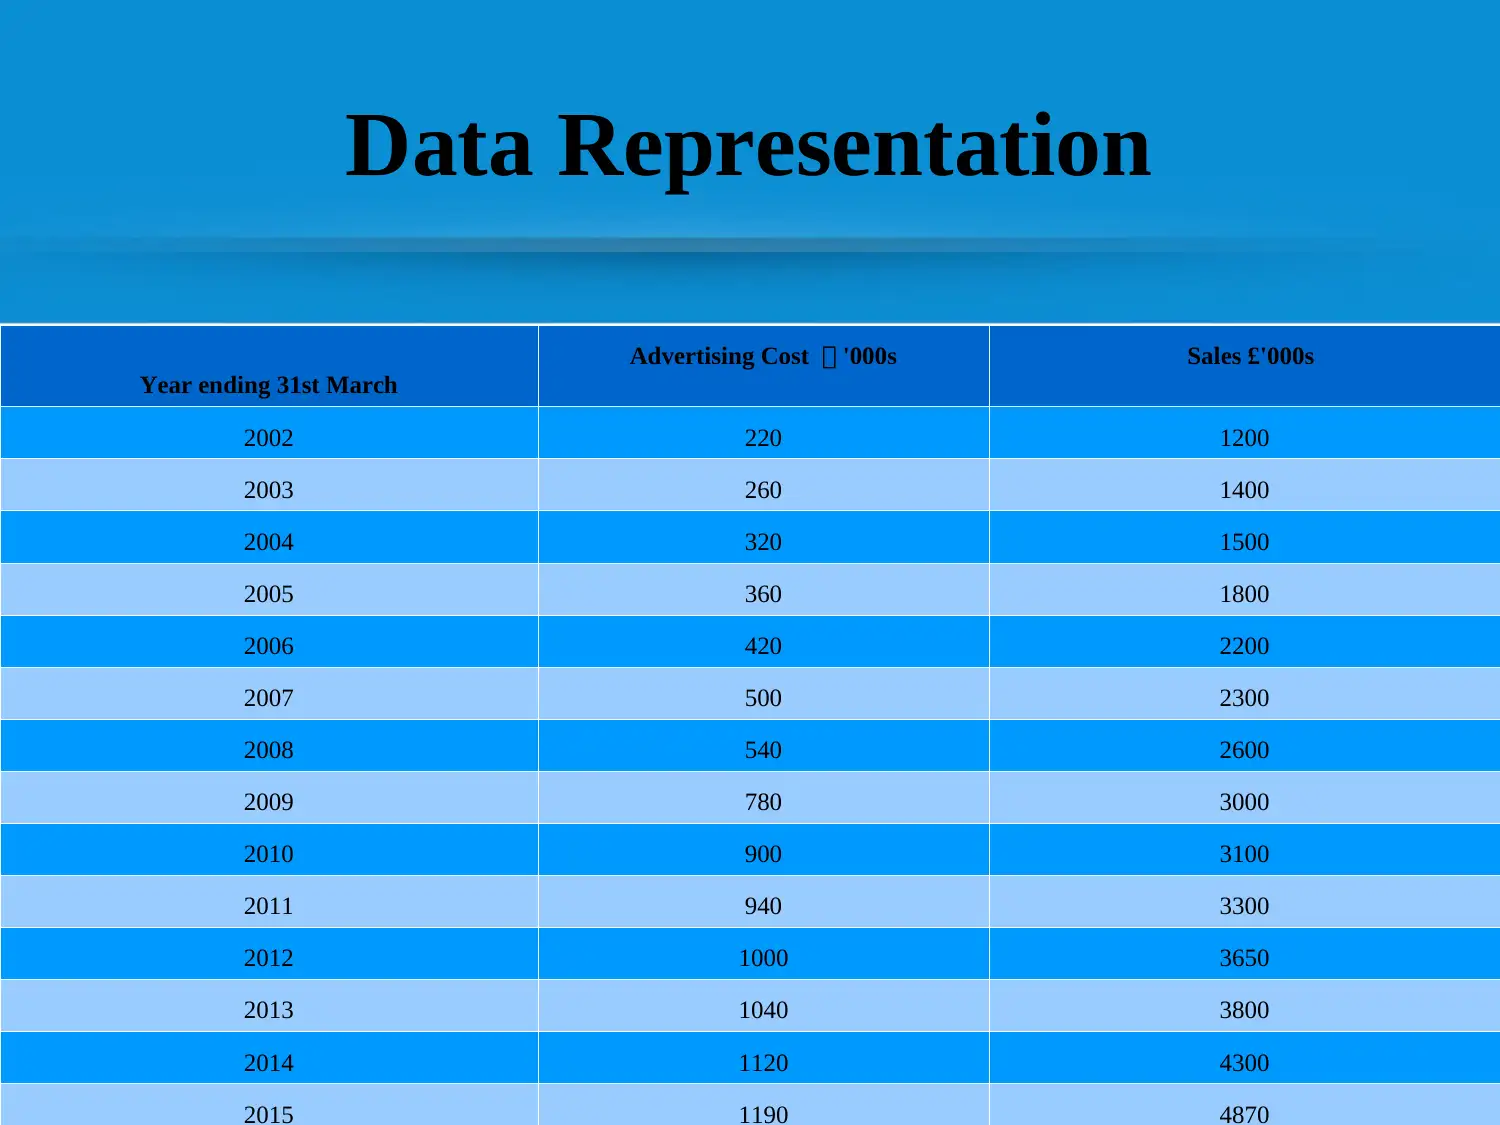
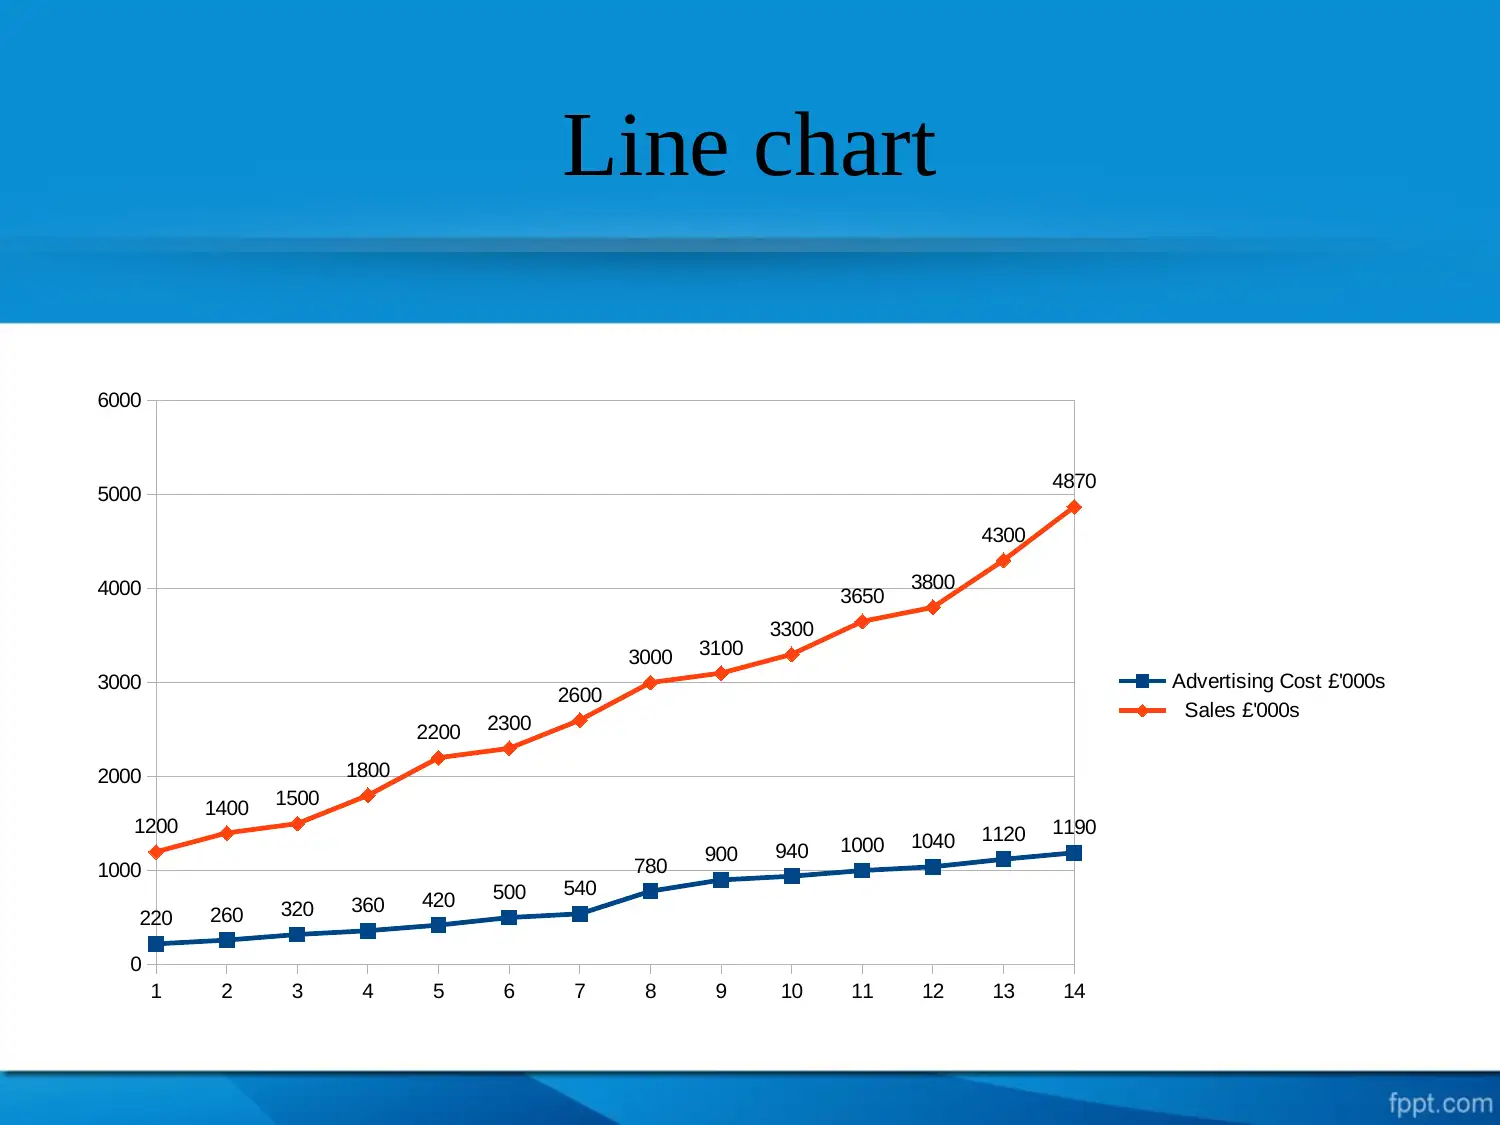
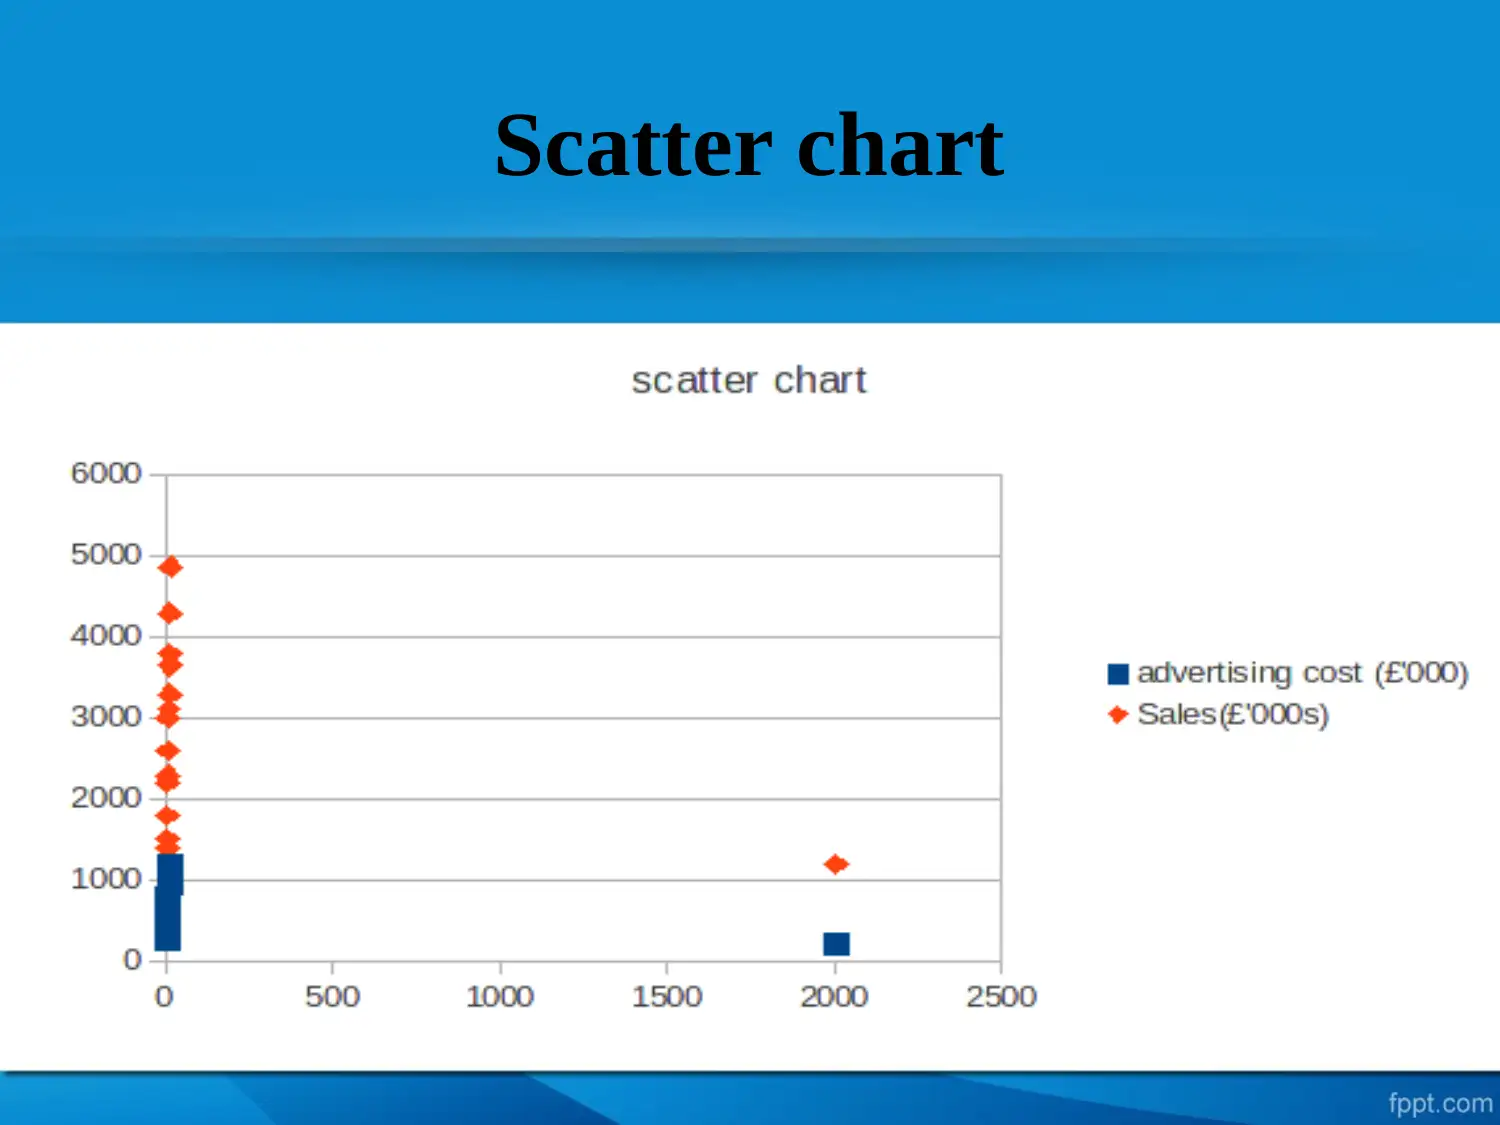
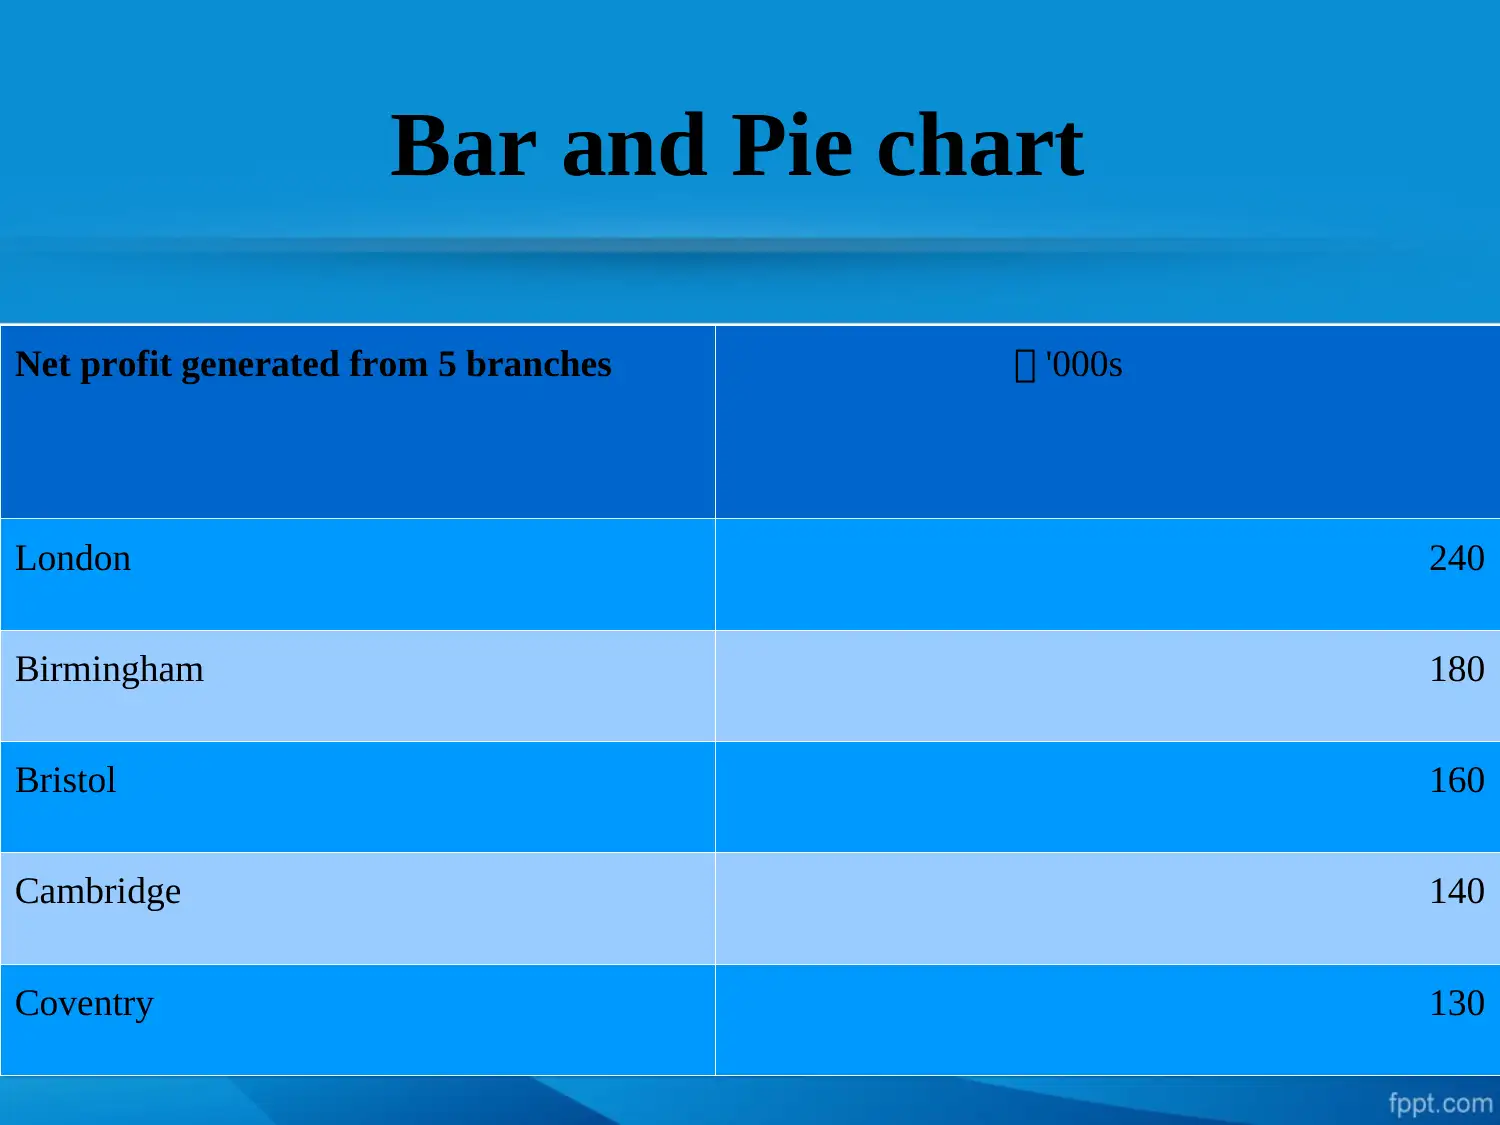
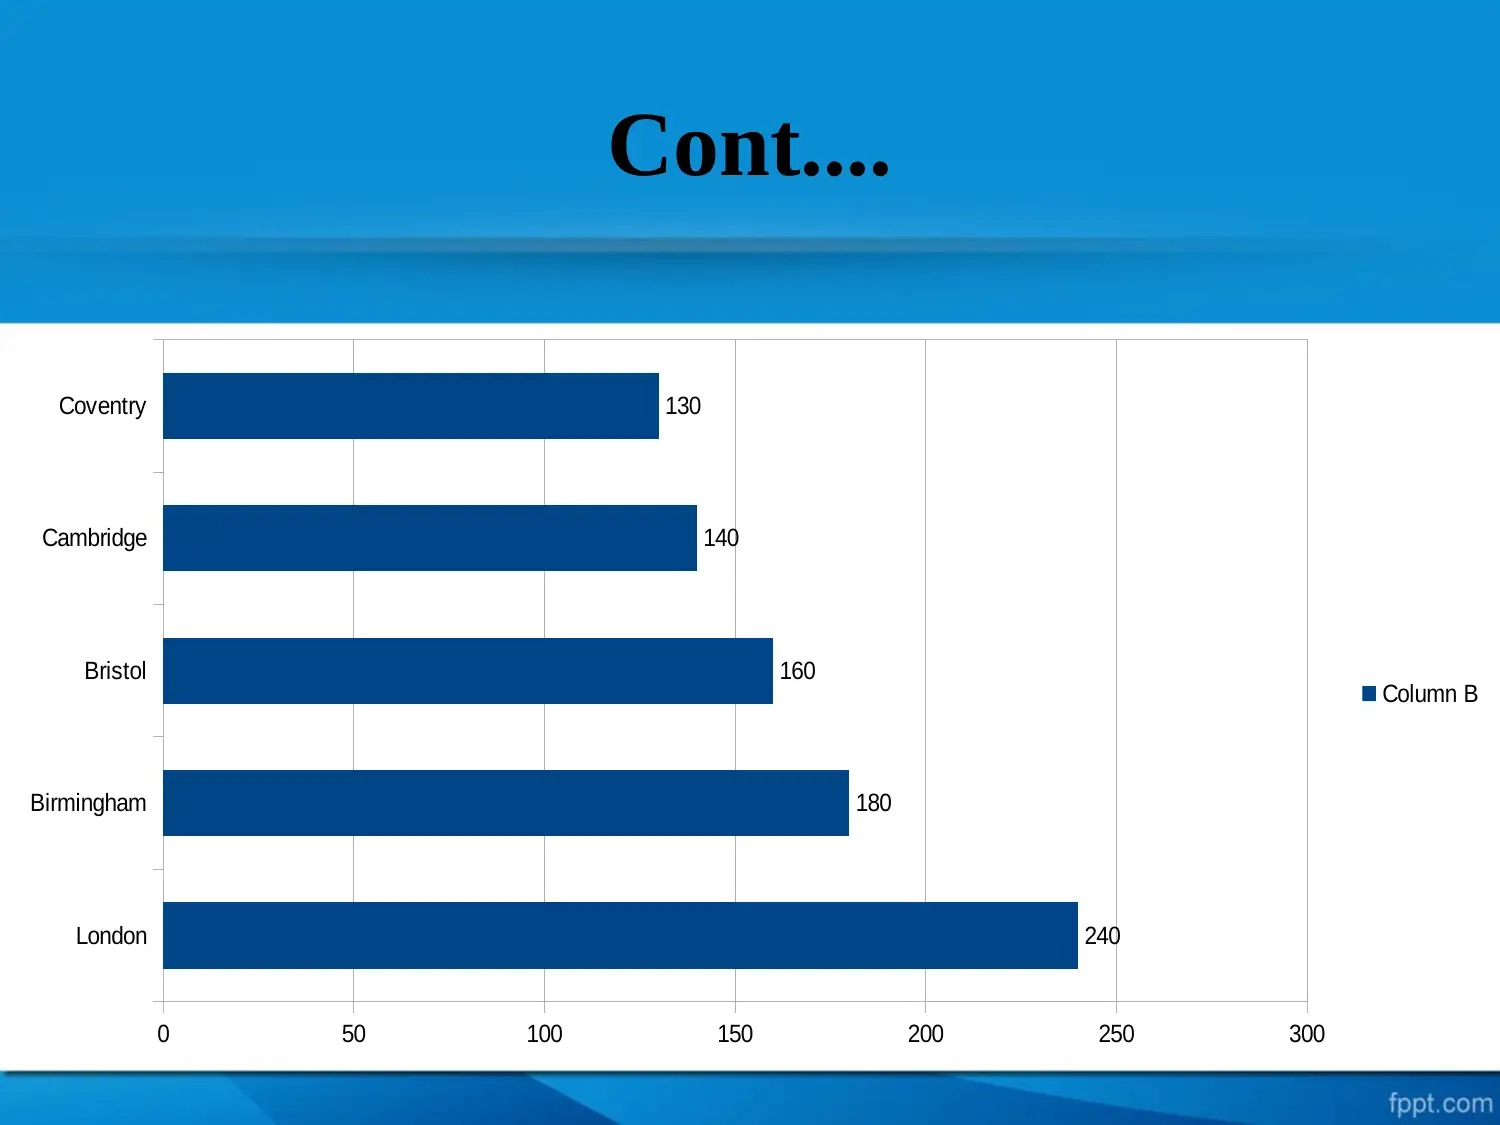
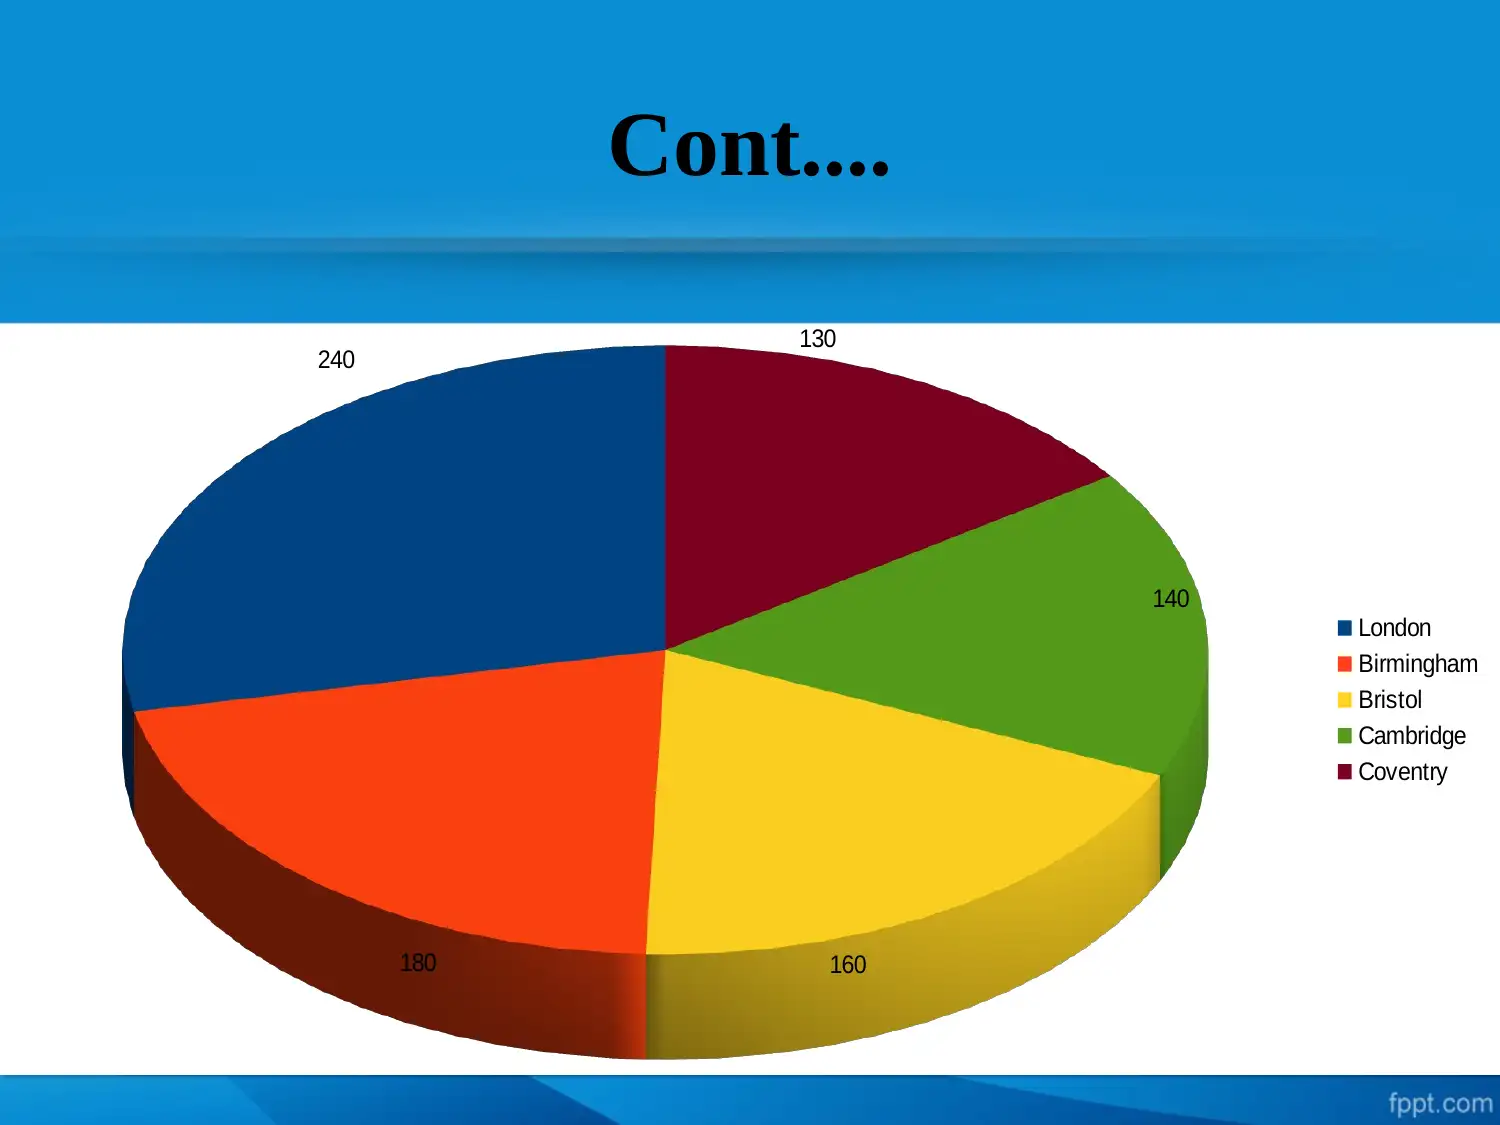
This report examines business decision-making through data analysis, focusing on research methodologies, data representation, findings, and suggestions. It uses primary and secondary data to analyze advertising costs, sales, and profitability across different branches. The analysis includes line charts, scatter charts, bar charts, and pie charts to represent data. Key findings highlight the profitability of the London branch and consistent sales increases. The report suggests providing more support to underperforming branches and increasing advertising expenditure. It also recommends using investment proposal analysis techniques like IRR and NPV for decision-making. This document is available on Desklib, a platform offering a range of study tools and resources for students.
Document Page
Business Decision
Making
Task 3.3
tabler-icon-diamond-filled.svg

Paraphrase This Document

Need a fresh take? Get an instant paraphrase of this document with our AI Paraphraser
Document Page
Covered content
Introduction
Objectives
Research methodologies
Data representation
Line Chart
Findings
Suggestion
References
Document Page
Introduction
Business decision making is an important aspects of any
organisation in order to carry out its daily operations. As, it is
necessary in the research process to take decision to reach out
at effective conclusion.
Document Page
Objective
Under this project report, the main objectives of conducting
research is to know about different review and changes.
tabler-icon-diamond-filled.svg

Paraphrase This Document

Need a fresh take? Get an instant paraphrase of this document with our AI Paraphraser
Document Page
Research methodologies
The primary and secondary data is used to collect
necessary data from the research.
To eliminate literature gap which are arises during the
process.
Various charts and graphs are used to show performances
of the company's during the year.
Document Page
Data Representation
Year ending 31st March
Advertising Cost '000s Sales £'000s
2002 220 1200
2003 260 1400
2004 320 1500
2005 360 1800
2006 420 2200
2007 500 2300
2008 540 2600
2009 780 3000
2010 900 3100
2011 940 3300
2012 1000 3650
2013 1040 3800
2014 1120 4300
2015 1190 4870
Document Page
Line chart
1 2 3 4 5 6 7 8 9 10 11 12 13 14
0
1000
2000
3000
4000
5000
6000
220 260 320 360 420 500 540
780 900 940 1000 1040 1120 11901200 1400 1500
1800
2200 2300
2600
3000 3100 3300
3650 3800
4300
4870
Advertising Cost £'000s
Sales £'000s
tabler-icon-diamond-filled.svg

Paraphrase This Document

Need a fresh take? Get an instant paraphrase of this document with our AI Paraphraser
Document Page
Scatter chart
Document Page
Bar and Pie chart
Net profit generated from 5 branches '000s
London 240
Birmingham 180
Bristol 160
Cambridge 140
Coventry 130
Document Page
Cont....
London
Birmingham
Bristol
Cambridge
Coventry
0 50 100 150 200 250 300
240
180
160
140
130
Column B
tabler-icon-diamond-filled.svg

Paraphrase This Document

Need a fresh take? Get an instant paraphrase of this document with our AI Paraphraser
Document Page
Cont....
240
180 160
140
130
London
Birmingham
Bristol
Cambridge
Coventry
Document Page
Findings
The research has many positive outcomes related with
profitability and its future existence.
The largest area is covered by London branch as they
are providing maximum profit.
The sales of company is increasing constantly.
chevron_up_icon
1 out of 15
circle_padding
hide_on_mobile
zoom_out_icon
[object Object]