Analysis of Jewellery Sector Trends: Data Driven Decisions
VerifiedAdded on 2023/06/07
|15
|3385
|296
Report
AI Summary
This report provides an analysis of data-driven decision-making within the jewellery sector, focusing on trends across the UK, USA, and Japan, using sales data from Bangles International Jewellery (BIJ). It identifies data quality issues and proposes remedies, analyzes sales performance, and interprets data to highlight market fluctuations and revenue generation. The report also assesses the impact of customer behavior, social media, and competitor strategies on BIJ's sales. Recommendations are made to improve data collection processes, address challenges like duplicate data, and enhance overall sales performance through strategies such as sales growth, customer retention, and profit margin optimization. The analysis concludes that BIJ can achieve sustainable growth by addressing identified issues and adapting to market requirements.
BPP Business School
Coursework Cover Sheet
Please use this document as the cover sheet of for the 1st page of your assessment.
Please complete the below table – the grey columns
Module Name
Student Reference Number
(SRN)
Assessment Title
Please complete the yellow sections in the below declaration :
Declaration of Original Work:
I hereby declare that I have read and understood BPP’s regulations on plagiarism and that this is my
original work, researched, undertaken, completed and submitted in accordance with the requirements
of BPP School of Business and Technology.
The word count, excluding contents table, bibliography and appendices, is ______ words.
Student Reference Number: __________ Date: ______
By submitting this coursework you agree to all rules and regulations of BPP regarding assessments and
awards for programmes.
Please note that by submitting this assessment you are declaring that you are fit to sit this assessment.
BPP University reserves the right to use all submitted work for educational purposes and may request
that work be published for a wider audience.
Paraphrase This Document
Need a fresh take? Get an instant paraphrase of this document with our AI Paraphraser
Data Driven Decisions
for Business
for Business
Table of Contents
TASK...............................................................................................................................................3
Introduction and Project plan......................................................................................................3
Data qualities issues and their remedies......................................................................................4
Data analysis and commentary....................................................................................................6
Data chart and give the comments on the basis of the results...................................................12
Conclusion and Recommendations...........................................................................................13
REFERENCES..............................................................................................................................14
⊘ This is a preview!⊘
Do you want full access?
Subscribe today to unlock all pages.
Trusted by 1+ million students worldwide
TASK
Introduction and Project plan
Data driven decision making can be described as taking guidance of facts, metrics and
data throughout the process of strategic business decision in order to attaining goals. Every
business requires to take data driven decision which encourages the curiosity or critical thinking
among workforce. Employees at every level of management should develop skills of handling
data with application. Numerous models are available that can assist business in making their
strategies more successful (Badakhshan and Ball, 2021). The following report has the purpose of
highlighting various new trends of jewellery sector and analysis of these trends across UK, USA
and Japan. Moreover, it also reflects analysis and interpretation of data in terms of flourishing in
the whole industry. Further, report also discuss few recommendations about the ways through
which businesses can make greater achievements in short as well as long run. For showing
analysis of data, sales figures of Bangles International Jewellery (BIJ) is used.
The analysis and evaluation of data would boost sales level of BIJ in the global market.
This data analytics breakdown is presented below:
Observation of the behaviour of customers and their responses in context of companies
sales.
Essential role played by social media in performance of organisation.
Tracking the components regularly that can enhance the overall sales.
Observing the strategies or tactics uses by competitors that can support in determining
their strength or weaknesses.
Identifying strong as well as weak points of company.
Rearrange the whole price structure according to the current market requirements.
In order to achieve the predetermined sales target it is essential for the business BIJ to
replicate towards the challenges explained above (Brunoe, Andersen and Nielsen, 2023).
Identifying best suitable solution for these problems would help in accomplishing the objective
of BIJ.
The tools that can help in enhancing the performance of Bangles International Jewellery
are profit growth, sales received by the company per consumer base, margin of profit, rate of
customer retention and satisfaction level of customer. These all are described below:
Paraphrase This Document
Need a fresh take? Get an instant paraphrase of this document with our AI Paraphraser
Sales growth: There are various kinds of material categories available that are used in
making of the final product such as glass, plastic and metal. The foremost vital decision
is the choice of raw material that the company would use in making the bracelet
(Burnetas, 2022). Management also requires to plan on the basis of different seasons,
festivals and trends.
Revenue earned per customer: Each market segment has different age groups as it
become important for a business to determine their targeted market according to the
different age group for that the commodities is manufactured. It is essential to analyse the
customer base that contributes in enhancing or boosting the sales of Bangles International
Jewellery.
Profit margin: There might be a chance in the jewellery industry that profit margins of
each business varies. The labour cost and prices in the market for different variety of
bangles has a direct effect on the rate at which final product reach the consumer.
Rate of customer retention: Customers are the foremost essential factor for each
company. Their retention can be elevated through enhancing the quality of finished
product and framing that whole structure of prices that comes under the purchasing
power of customer.
Bangles International Jewellery can increase their profit margin, share in the market and
sustainable growth through taking the above issue in concern and move towards improving them.
Data qualities issues and their remedies
Below are the description of challenges occur while data analytics:
The whole degree of data that is collected: In today's era of increasing in complexity
about data there are various associated with storage of this type of data also arises and
operating managers of business should need to be aware with the risks to which their
company may be exposed at any given time. The management needs to concern about
various risks of some data loss (Gussen, Kiesel and Schmitt, 2021). This can also happen
in the BIJ scenario.
Collecting the current information: There is so much unnecessary data is available,
finding and accessing the vision the company need most could be challenging. By
manually examining the data, management may be able to understand the current
situation in the market.
Virtual presentation of information: In order to understand the whole data wisely for
the individuals who uses this information for the benefit BIJ then it requires to be
represented in phenomenal ways.
Collecting information from various sources: The biggest challenge that business face
is related with analysis and organisation of data sets at single place that is gathered or
arranged from various sources for BIJ. Many a times, workforce of the company is not
able to understand the current requirement due to complexity that leads to wrong analysis
and results would not be appropriate (Hipps, 2019).
Duplicate data: Duplicate data is a problem that all companies have to deal with. This is
often the result of slide processes and multiple systems recording the same information.
When these sources are aggregated for processing, having multiple copies of the same
data set can significantly skew the results or introduce unnecessary overhead. This can
lead to customers receiving multiple, identical marketing materials, annoying users and
wasting time and money. If a customer calls and has multiple entries in the system with
different details, it can be difficult to support them.
Data collection process: Improving the data collection process may include actions such
as: For example, redesigning data entry windows and associated logic, training data entry
staff, and setting feedback to data entry staff on quality issues. Having lots of small items
like this greatly improves the accuracy of your data. Another extreme example is business
process changes that involve collecting and updating data. Changing who enters data and
when makes the process more efficient and increases the likelihood that data is accurate.
Bringing data entry closer to real events, reducing the number of people involved in the
process, and educating entry personnel about the intent of the application all contribute to
better data. You can modify your business process to add data validation through
additional means as needed (Kohlegger and Ploder, 2018). Business processes can be
changed to remove incentives to provide inaccurate data. The input process can be further
automated if desired. Use of barcodes, retrieval of previously entered information, audio
capture of verbal information exchanges between data authors and data enterers for later
playback, and verification are more accurate through automation example.
The above issues can be resolved by management of BIJ through the support of
appropriate approach that are described below:
⊘ This is a preview!⊘
Do you want full access?
Subscribe today to unlock all pages.
Trusted by 1+ million students worldwide
Implement the data through appropriate source system: Sometimes quality problems
arises in the data that needs to be addressed through improving the sources through which
data is collected on the basis of each intervals.
Advancements in the data source system for solving the data issues: This method is
seems to be similar with the above method but this is totally varies from that one. It
unfold that the system source which is accountable for the collection of data needs to be
set up at automatic mode so that it can cleanse the whole data structure before
implementation of that specific data sets (Long, 2018).
Application of precision identity: The most critical tool for improving the data quality
and solving the problem but cumulatively the most appropriate and accurate techniques is
that.
Data analysis and commentary
Paraphrase This Document
Need a fresh take? Get an instant paraphrase of this document with our AI Paraphraser
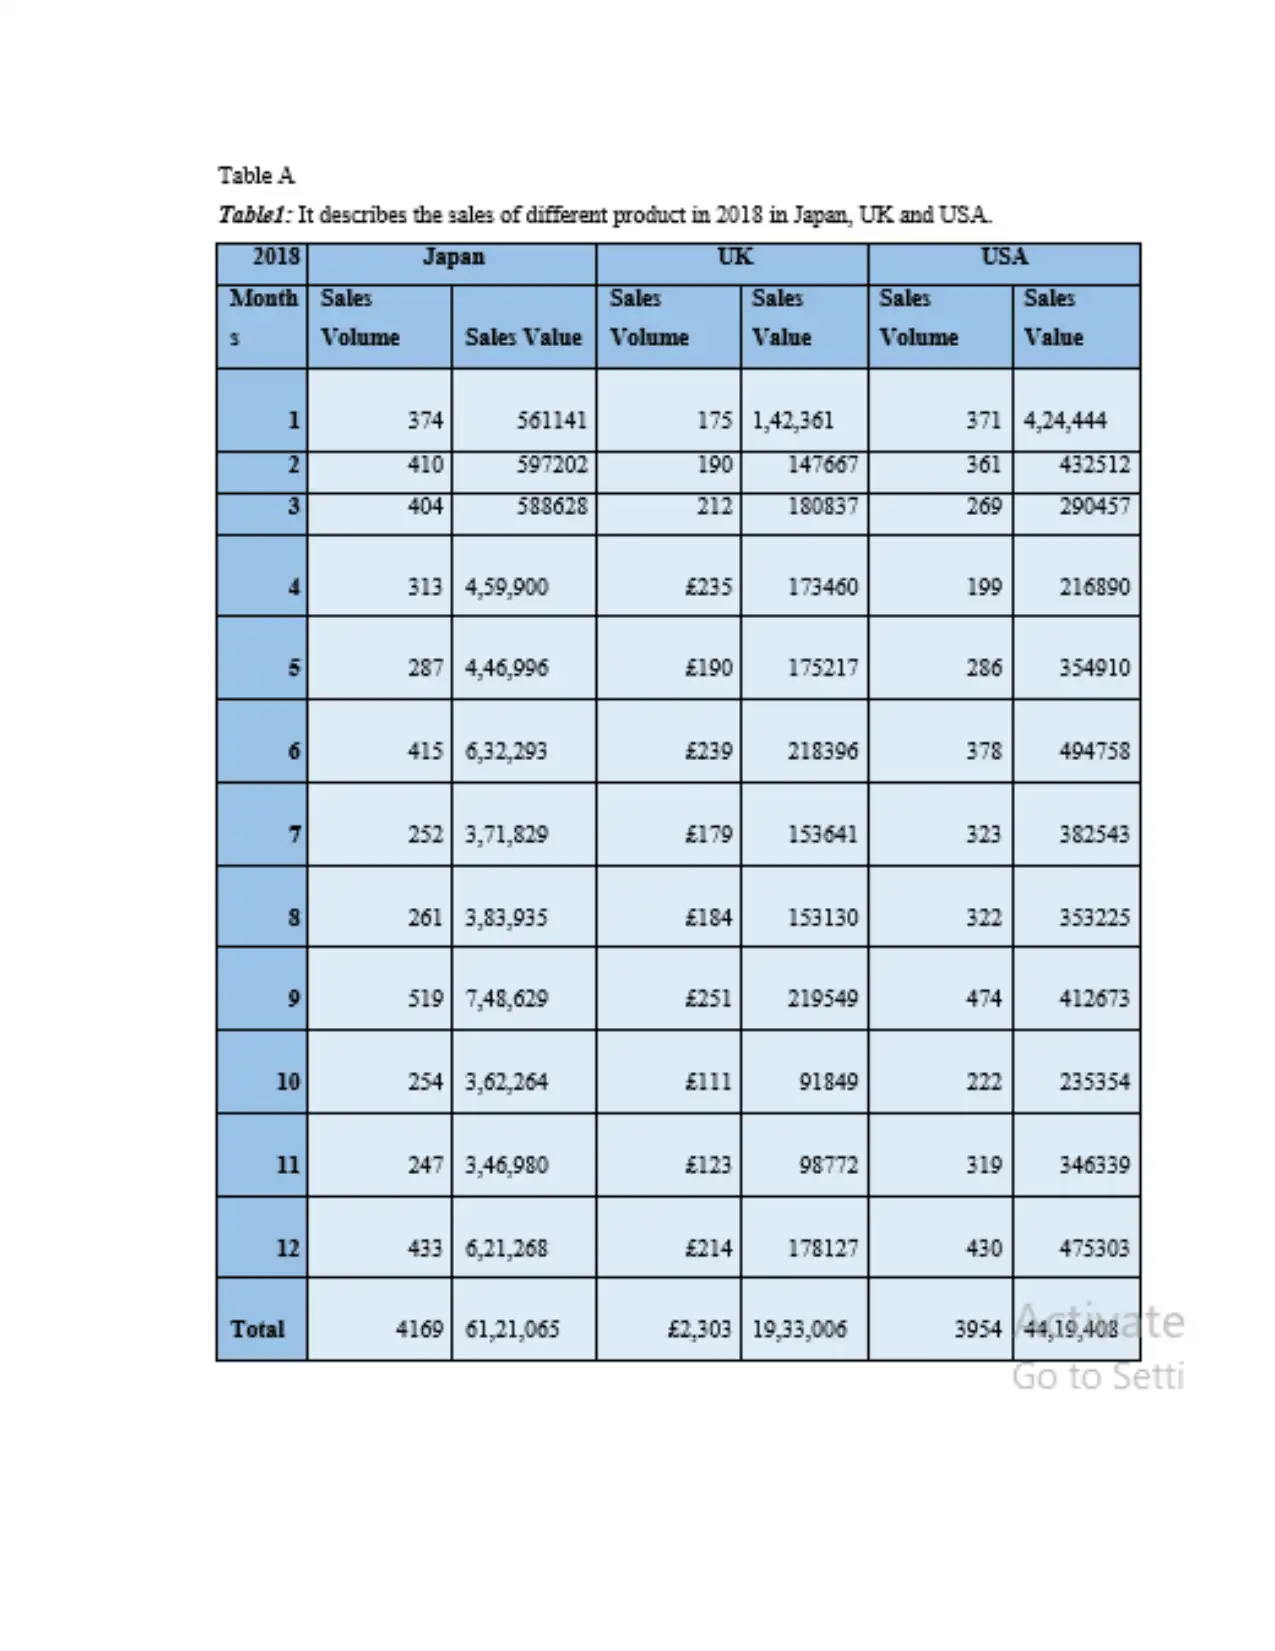
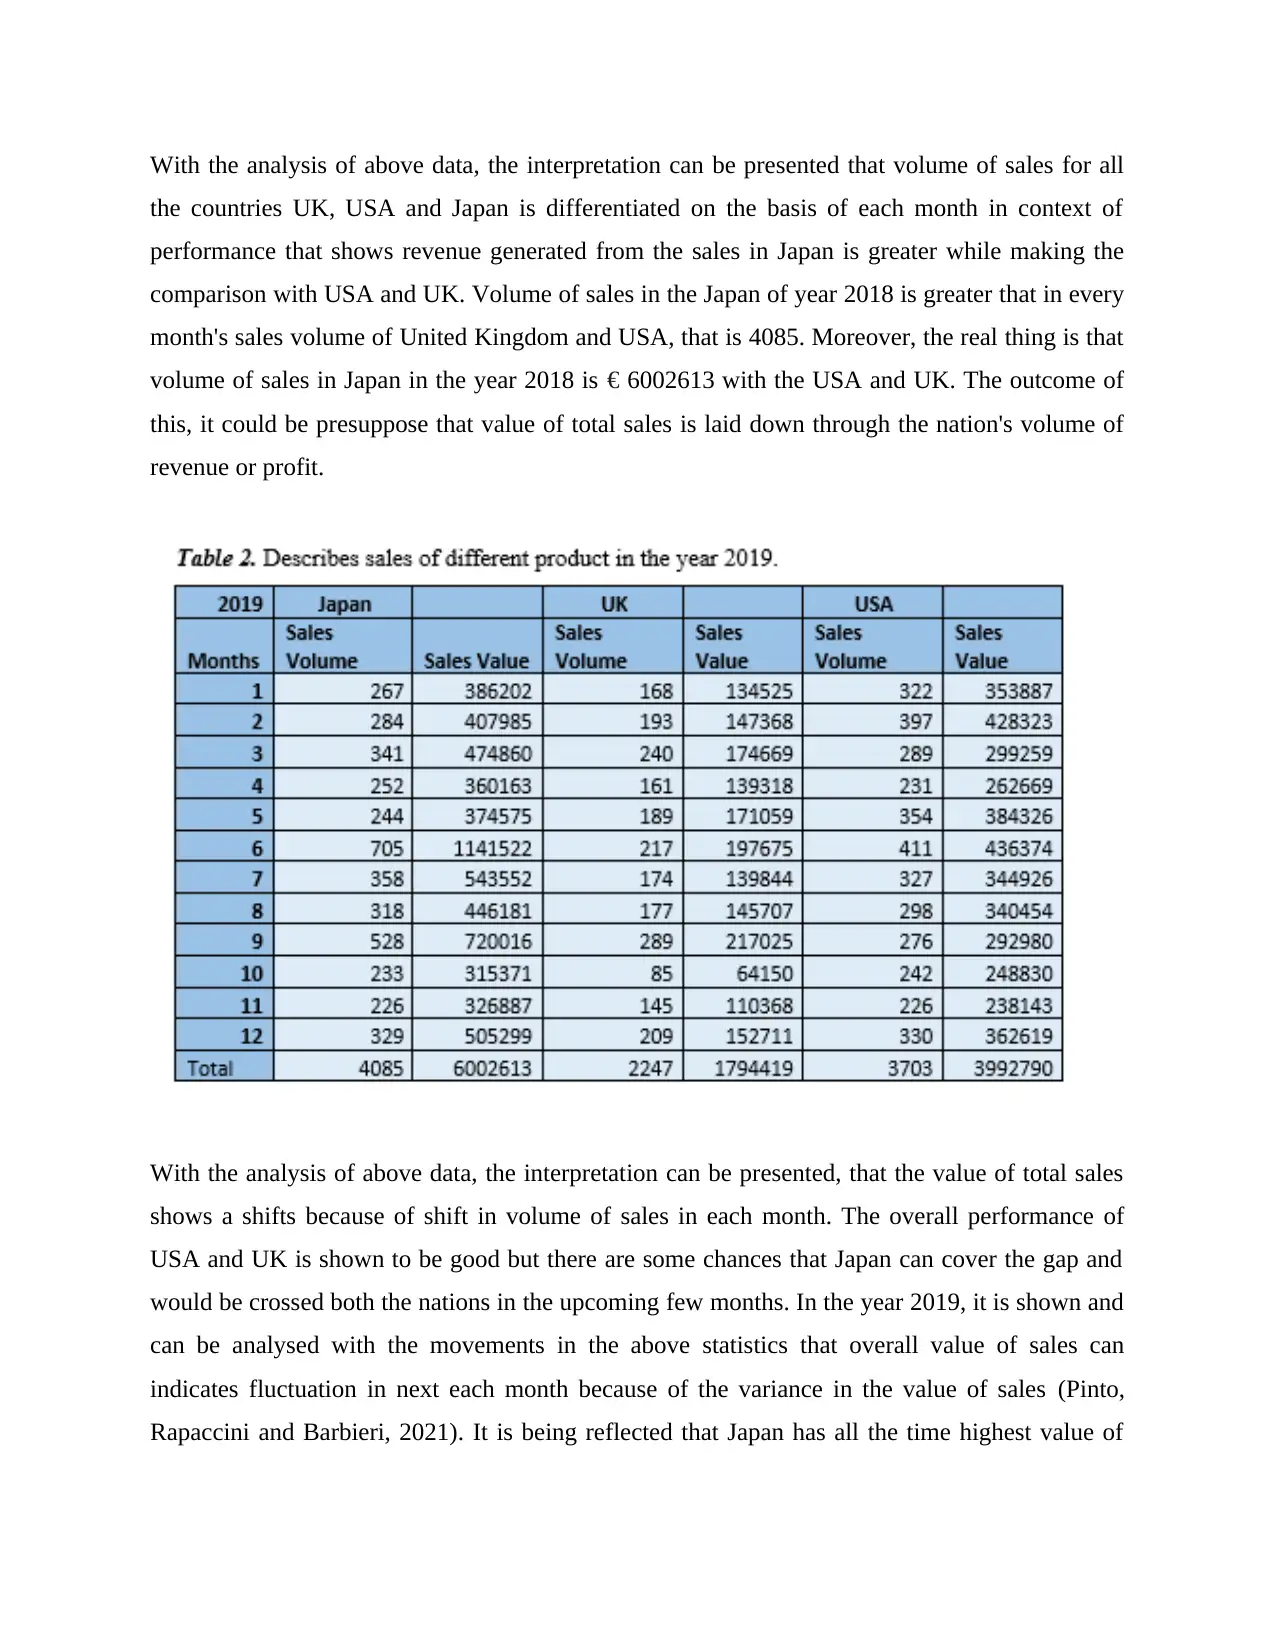
With the analysis of above data, the interpretation can be presented that volume of sales for all
the countries UK, USA and Japan is differentiated on the basis of each month in context of
performance that shows revenue generated from the sales in Japan is greater while making the
comparison with USA and UK. Volume of sales in the Japan of year 2018 is greater that in every
month's sales volume of United Kingdom and USA, that is 4085. Moreover, the real thing is that
volume of sales in Japan in the year 2018 is € 6002613 with the USA and UK. The outcome of
this, it could be presuppose that value of total sales is laid down through the nation's volume of
revenue or profit.
With the analysis of above data, the interpretation can be presented, that the value of total sales
shows a shifts because of shift in volume of sales in each month. The overall performance of
USA and UK is shown to be good but there are some chances that Japan can cover the gap and
would be crossed both the nations in the upcoming few months. In the year 2019, it is shown and
can be analysed with the movements in the above statistics that overall value of sales can
indicates fluctuation in next each month because of the variance in the value of sales (Pinto,
Rapaccini and Barbieri, 2021). It is being reflected that Japan has all the time highest value of
⊘ This is a preview!⊘
Do you want full access?
Subscribe today to unlock all pages.
Trusted by 1+ million students worldwide
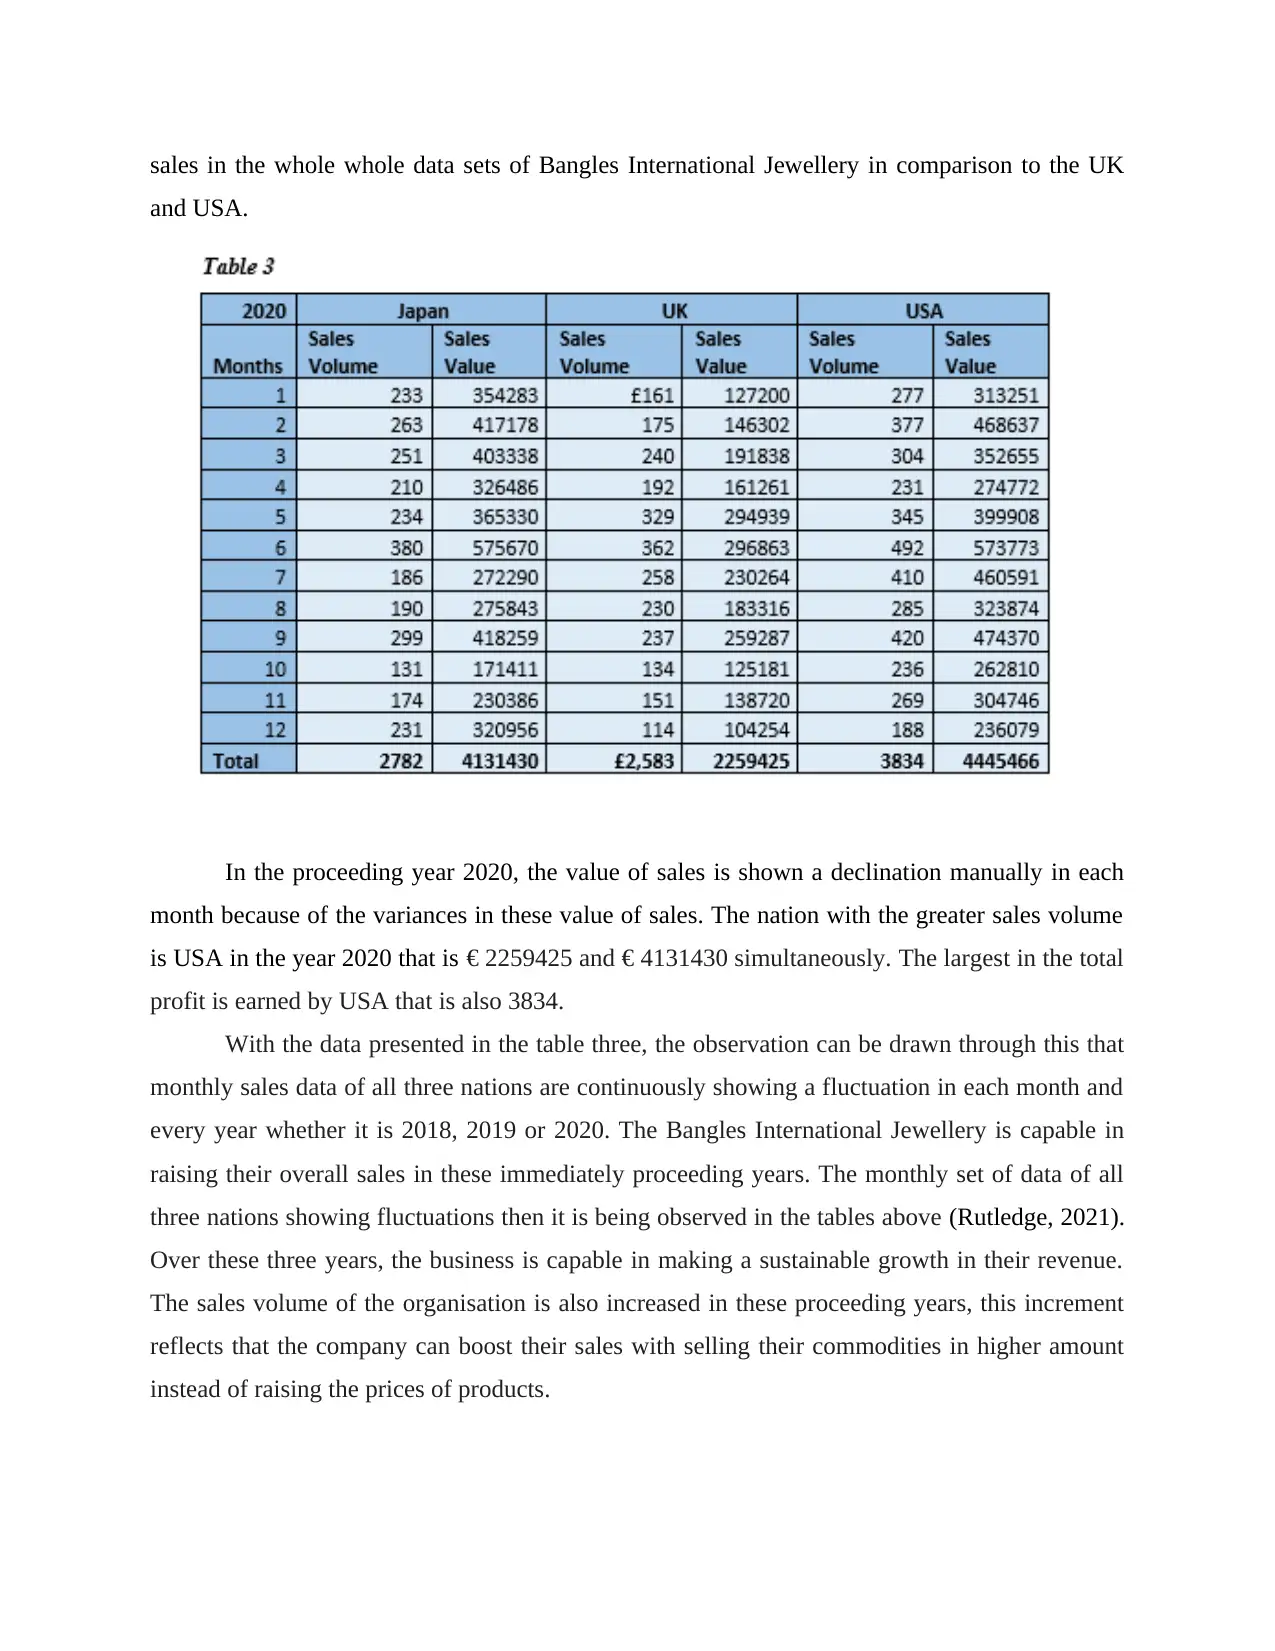
sales in the whole whole data sets of Bangles International Jewellery in comparison to the UK
and USA.
In the proceeding year 2020, the value of sales is shown a declination manually in each
month because of the variances in these value of sales. The nation with the greater sales volume
is USA in the year 2020 that is € 2259425 and € 4131430 simultaneously. The largest in the total
profit is earned by USA that is also 3834.
With the data presented in the table three, the observation can be drawn through this that
monthly sales data of all three nations are continuously showing a fluctuation in each month and
every year whether it is 2018, 2019 or 2020. The Bangles International Jewellery is capable in
raising their overall sales in these immediately proceeding years. The monthly set of data of all
three nations showing fluctuations then it is being observed in the tables above (Rutledge, 2021).
Over these three years, the business is capable in making a sustainable growth in their revenue.
The sales volume of the organisation is also increased in these proceeding years, this increment
reflects that the company can boost their sales with selling their commodities in higher amount
instead of raising the prices of products.
Paraphrase This Document
Need a fresh take? Get an instant paraphrase of this document with our AI Paraphraser
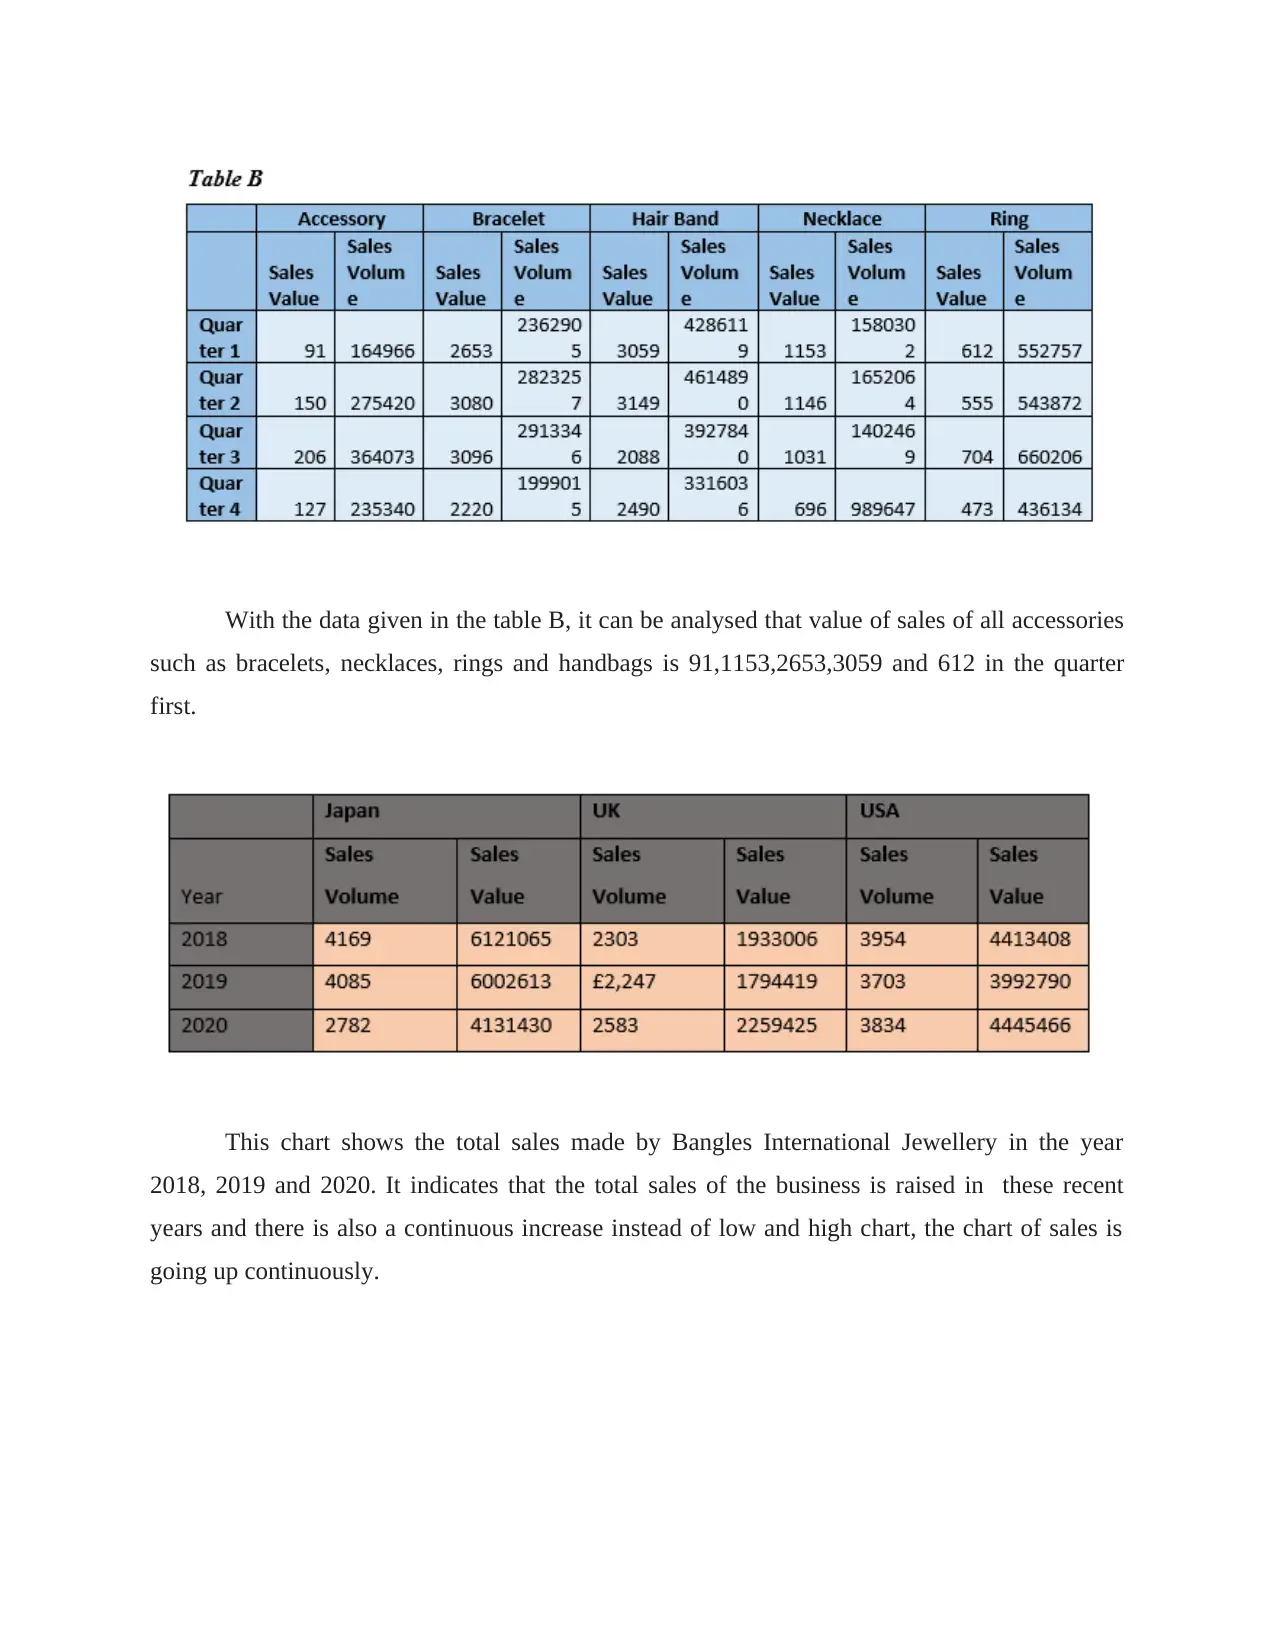
With the data given in the table B, it can be analysed that value of sales of all accessories
such as bracelets, necklaces, rings and handbags is 91,1153,2653,3059 and 612 in the quarter
first.
This chart shows the total sales made by Bangles International Jewellery in the year
2018, 2019 and 2020. It indicates that the total sales of the business is raised in these recent
years and there is also a continuous increase instead of low and high chart, the chart of sales is
going up continuously.
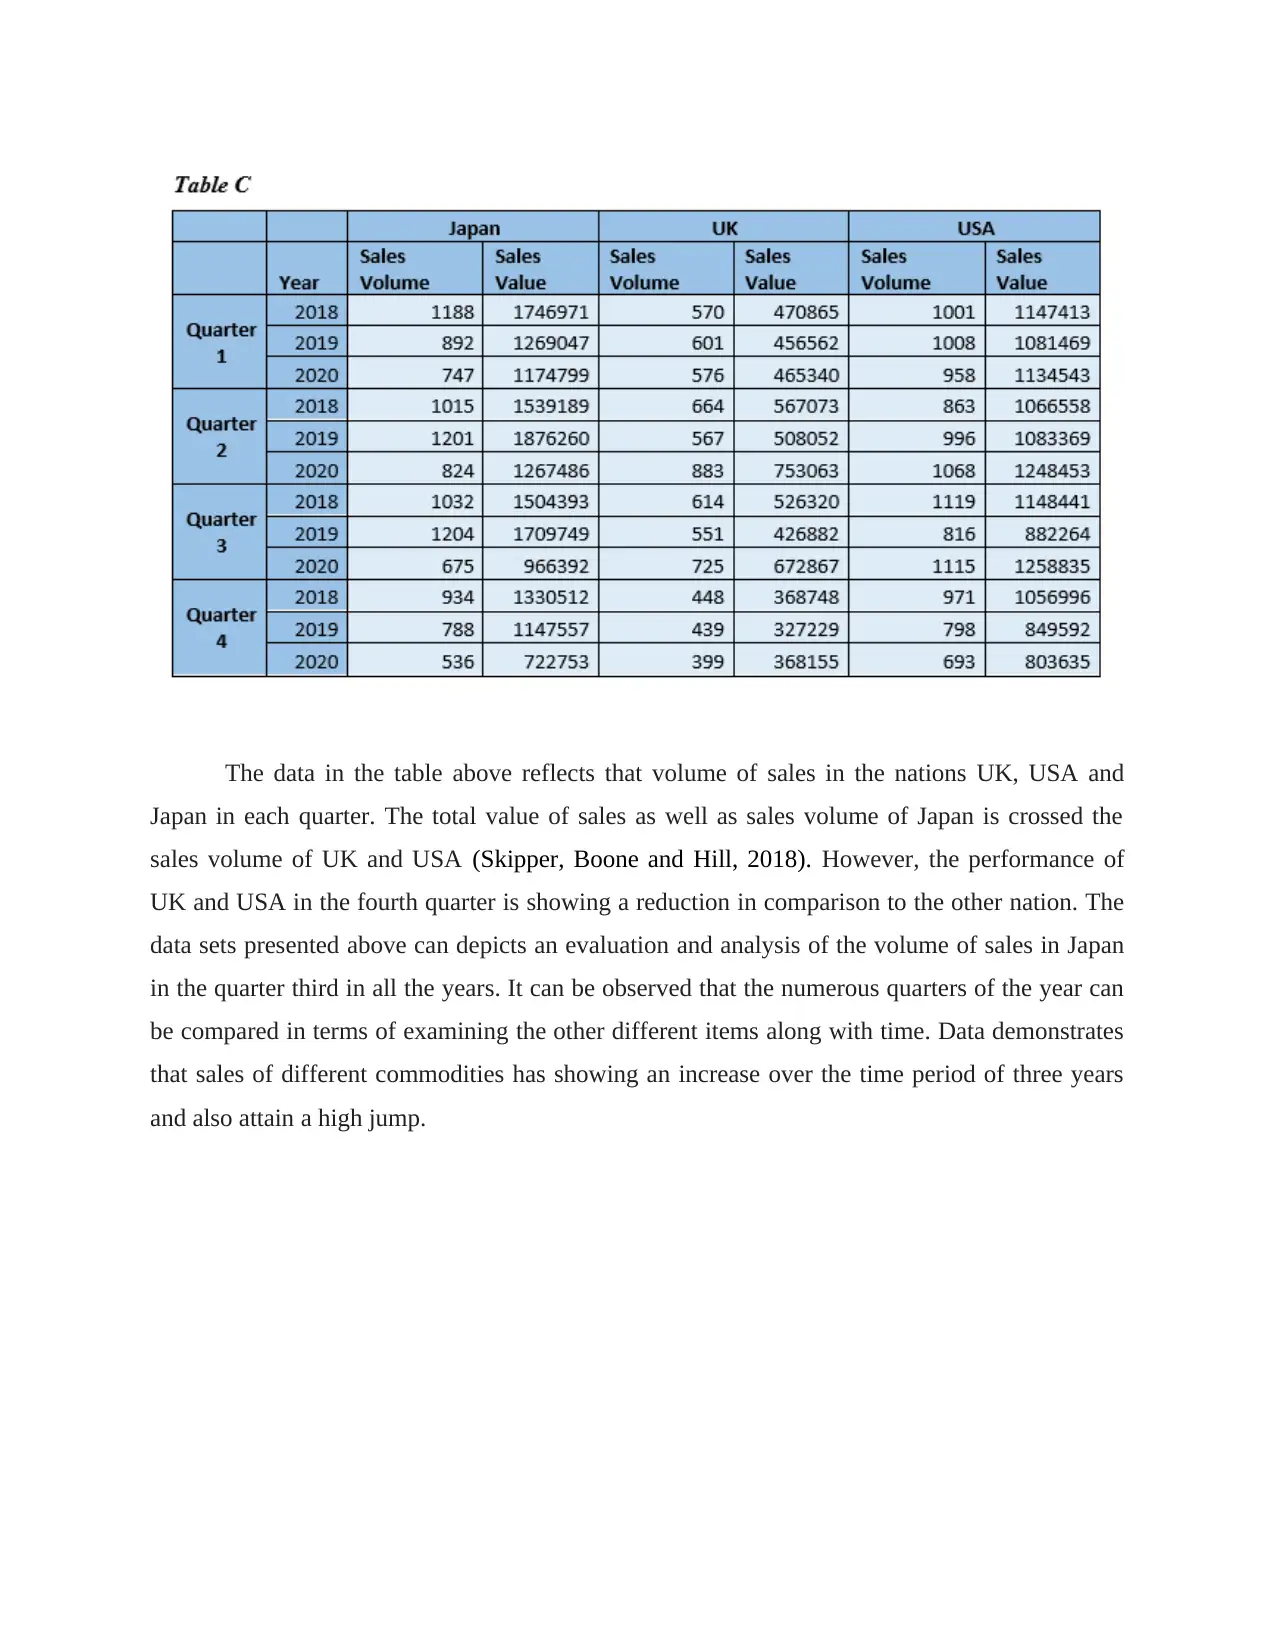
The data in the table above reflects that volume of sales in the nations UK, USA and
Japan in each quarter. The total value of sales as well as sales volume of Japan is crossed the
sales volume of UK and USA (Skipper, Boone and Hill, 2018). However, the performance of
UK and USA in the fourth quarter is showing a reduction in comparison to the other nation. The
data sets presented above can depicts an evaluation and analysis of the volume of sales in Japan
in the quarter third in all the years. It can be observed that the numerous quarters of the year can
be compared in terms of examining the other different items along with time. Data demonstrates
that sales of different commodities has showing an increase over the time period of three years
and also attain a high jump.
⊘ This is a preview!⊘
Do you want full access?
Subscribe today to unlock all pages.
Trusted by 1+ million students worldwide
1 out of 15
Related Documents


Your All-in-One AI-Powered Toolkit for Academic Success.
+13062052269
info@desklib.com
Available 24*7 on WhatsApp / Email
![[object Object]](/_next/static/media/star-bottom.7253800d.svg)
Unlock your academic potential
Copyright © 2020–2026 A2Z Services. All Rights Reserved. Developed and managed by ZUCOL.