Marketing Research and Business Decision-Making Report for Supreme
VerifiedAdded on 2023/04/22
|21
|4451
|481
Report
AI Summary
This report provides a comprehensive analysis of business decision-making within the context of a marketing research project for Marketing Supreme Plc. It details the data collection process, including primary and secondary methods, survey methodology, and questionnaire design. The report employs statistical techniques such as cumulative frequency graphs, quartile analysis, and correlation coefficients to analyze collected data, calculate range and standard deviation and derive meaningful conclusions. Furthermore, it includes graphical representations of data trends, business presentations, and formal business reports. The report also covers project planning using information processing tools to assess critical paths and financial tools like NPV, IRR, and payback analysis to support decision-making, specifically in choosing between two investment options. The analysis focuses on assisting World Wide Tobacco (WWT) in making informed decisions about E-Cigarette products, with a competitive landscape assessment including key players like Imperial Tobacco Group plc. Desklib provides access to this report and many other solved assignments for students.

BUSINESS
DECISION-MAKING
DECISION-MAKING
Paraphrase This Document
Need a fresh take? Get an instant paraphrase of this document with our AI Paraphraser
TABLE OF CONTENTS
INTRODUCTION...........................................................................................................................5
TASK 1............................................................................................................................................5
1.1 Creating a plan for collecting the data..............................................................................5
1.2 Survey methodology and sampling frame........................................................................6
1.3 Questionnaire for the study..............................................................................................6
TASK 2............................................................................................................................................8
2.1 Drawing the cumulative frequency graph........................................................................8
2.1 and 2.3 Determining lower quartile, upper quartile, mean, median and mode................8
2.3 Assessing the value of semi inter quartile range............................................................10
2.4 and 2.2 Drawing conclusion from the quartile, percentile and correlation coefficient value
..............................................................................................................................................10
2.3 Calculating range and standard deviation.......................................................................11
TASK 3..........................................................................................................................................12
3.1 Producing graph..............................................................................................................12
3.2 Creating a trend line.......................................................................................................14
3.3 Business presentation.....................................................................................................16
3.4 Formal business report...................................................................................................16
TASK 4..........................................................................................................................................16
4.1 Information processing tool............................................................................................16
4.2 Preparing the project plan with an aim to assess the critical path..................................17
TASK 5..........................................................................................................................................19
4.3 Making the decision with the help of financial tools.....................................................19
CONCLUSION..............................................................................................................................20
REFERENCES..............................................................................................................................21
INDEX OF TABLES
Table 1: Cumulative frequency graph..............................................................................................8
Table 2: Cumulative frequency graph with total mean....................................................................9
Table 3: Estimated sales and profits figure....................................................................................12
Table 4: NPV, IRR and Payback for Fitz......................................................................................19
Table 5: NPV, IRR and Payback for Naushaba.............................................................................19
1
⊘ This is a preview!⊘
Do you want full access?
Subscribe today to unlock all pages.
Trusted by 1+ million students worldwide
ILLUSTRATION INDEX
Illustration 1: Histogram for Imperial tobacco plc........................................................................12
Illustration 2: Scatter graph for Imperial tobacco plc....................................................................13
Illustration 3: Bar chart for the Imperial tobacco plc.....................................................................13
Illustration 4: Trend line for Imperial tobacco plc.........................................................................14
Illustration 5: Trend line for Imperial tobacco plc sales................................................................14
Illustration 6: Trend line for Imperial tobacco plc for profit.........................................................15
Illustration 7: Gantt chart...............................................................................................................17
Illustration 8: Network diagram.....................................................................................................18
2
Paraphrase This Document
Need a fresh take? Get an instant paraphrase of this document with our AI Paraphraser
INTRODUCTION
Decision making is an important function for the success of any business as it helps or
directs firm towards the specific path (Zsambok and Klein, 2014). In addition to this, manager of
an enterprise has to take number of decisions which will assist with regard to attain the goals and
objectives of corporation in an effectual way. The given report is based upon the case scenario in
which marketing research report is prepared for the Marketing Supreme Plc.
In this report, cited firm will collect data about E-Cigarette for its client which is named
as World Wide Tobacco (WWT). Here, the study will give detailed explanation regarding the
number of sources which are being used by the cited firm manager in order to gather information
about the market. Furthermore, the report will also showcase different types of techniques which
cited firm will use in order to analyse its collected data effectively.
TASK 1
1.1 Creating a plan for collecting the data
Data collection consists of number of techniques which manager of firm uses in order to
conduct its study upon the selected topic appropriately. Here, the effectiveness of the collected
data will occur when it helps in fulfilling the aims and objectives of the study. However, wrong
technique of data collection will lead to hamper the result of the study. Due to this, it became
difficult for the scholar with regard to meet the aims and objectives of the study in an effectual
manner. With an aim to collect data for WWT, assistance has been taken by the marketing
Supreme Plc manager from number of primary and secondary techniques. Detailed explanation
about the same is depicted below: Primary method: It is the technique in which investigator makes efforts with regard to
collect completely new data for the study and does not take assistance from previous data
or study (Primary method, 2016). Here, questionnaire has been prepared for the
customers in order to gather their views and opinions regarding the product such as E-
cigarette. Furthermore, with the help of given tool, information about the consumption
pattern of customers has also being assessed. This data obtained through analysis would
help firm in preparing an effective production strategy for the given tobacco product.
Secondary method: It is the technique, which is used by researcher with an aim to create
the base of its study. Thus, in the given method, scholar will analyse data, which is being
conducted by other researcher in the same topic or problem. With respect to the given
3
scenario, secondary data has been gathered through the help of methods such as online
sources, journals and books (Winston and Goldberg, 2004). Deriving through the given
means, information about the respective competitors of WWT has been assembled. Thus,
here on the basis of assessed competitor’s tactic, an effective decision can be taken by the
manager of cited firm with regard to the product such as E-Cigarette. Concerning from
the varied secondary sources, it is assessed that Imperial Tobacco Group plc, Cloupor and
AW are the main competitors of cited firm. These competitors have major share in
market (Bryman and Bell, 2015).
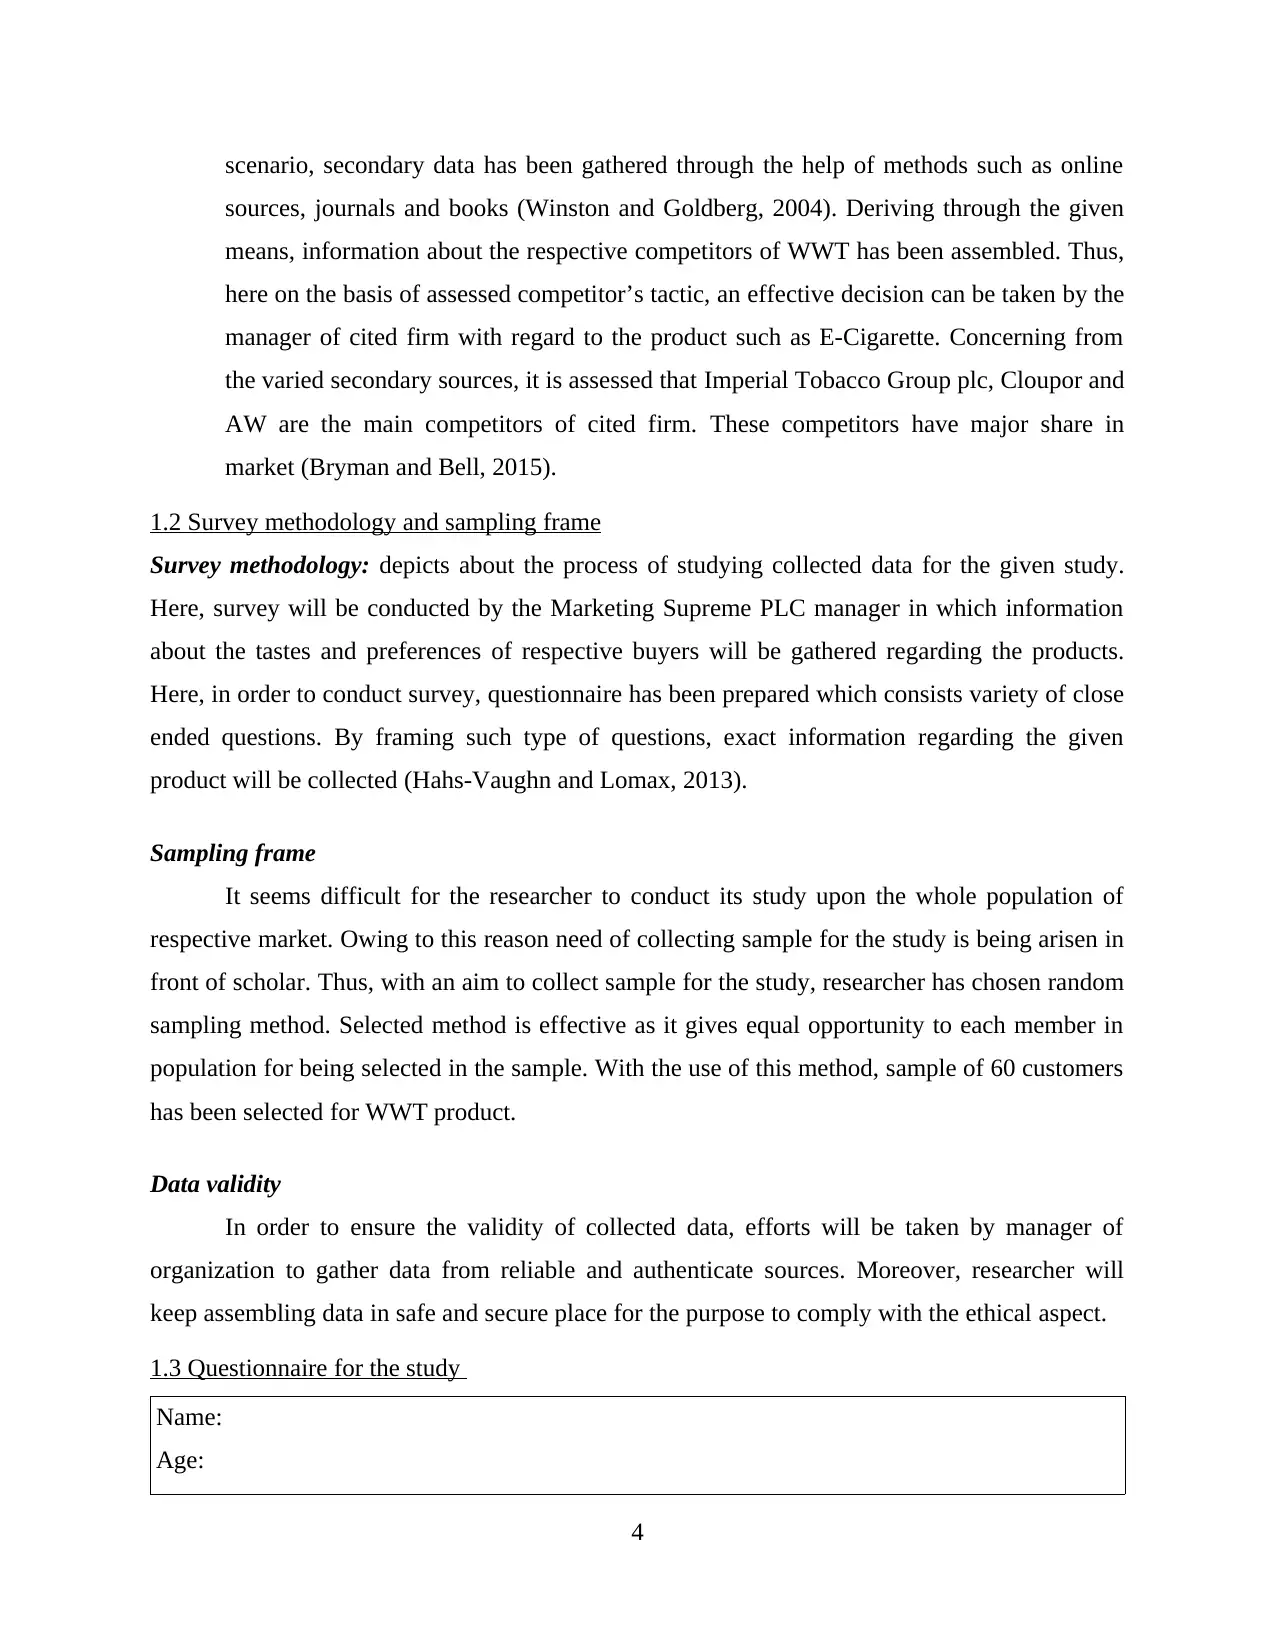
1.2 Survey methodology and sampling frame
Survey methodology: depicts about the process of studying collected data for the given study.
Here, survey will be conducted by the Marketing Supreme PLC manager in which information
about the tastes and preferences of respective buyers will be gathered regarding the products.
Here, in order to conduct survey, questionnaire has been prepared which consists variety of close
ended questions. By framing such type of questions, exact information regarding the given
product will be collected (Hahs-Vaughn and Lomax, 2013).
Sampling frame
It seems difficult for the researcher to conduct its study upon the whole population of
respective market. Owing to this reason need of collecting sample for the study is being arisen in
front of scholar. Thus, with an aim to collect sample for the study, researcher has chosen random
sampling method. Selected method is effective as it gives equal opportunity to each member in
population for being selected in the sample. With the use of this method, sample of 60 customers
has been selected for WWT product.
Data validity
In order to ensure the validity of collected data, efforts will be taken by manager of
organization to gather data from reliable and authenticate sources. Moreover, researcher will
keep assembling data in safe and secure place for the purpose to comply with the ethical aspect.
1.3 Questionnaire for the study
Name:
Age:
4
sources, journals and books (Winston and Goldberg, 2004). Deriving through the given
means, information about the respective competitors of WWT has been assembled. Thus,
here on the basis of assessed competitor’s tactic, an effective decision can be taken by the
manager of cited firm with regard to the product such as E-Cigarette. Concerning from
the varied secondary sources, it is assessed that Imperial Tobacco Group plc, Cloupor and
AW are the main competitors of cited firm. These competitors have major share in
market (Bryman and Bell, 2015).
1.2 Survey methodology and sampling frame
Survey methodology: depicts about the process of studying collected data for the given study.
Here, survey will be conducted by the Marketing Supreme PLC manager in which information
about the tastes and preferences of respective buyers will be gathered regarding the products.
Here, in order to conduct survey, questionnaire has been prepared which consists variety of close
ended questions. By framing such type of questions, exact information regarding the given
product will be collected (Hahs-Vaughn and Lomax, 2013).
Sampling frame
It seems difficult for the researcher to conduct its study upon the whole population of
respective market. Owing to this reason need of collecting sample for the study is being arisen in
front of scholar. Thus, with an aim to collect sample for the study, researcher has chosen random
sampling method. Selected method is effective as it gives equal opportunity to each member in
population for being selected in the sample. With the use of this method, sample of 60 customers
has been selected for WWT product.
Data validity
In order to ensure the validity of collected data, efforts will be taken by manager of
organization to gather data from reliable and authenticate sources. Moreover, researcher will
keep assembling data in safe and secure place for the purpose to comply with the ethical aspect.
1.3 Questionnaire for the study
Name:
Age:
4
⊘ This is a preview!⊘
Do you want full access?
Subscribe today to unlock all pages.
Trusted by 1+ million students worldwide
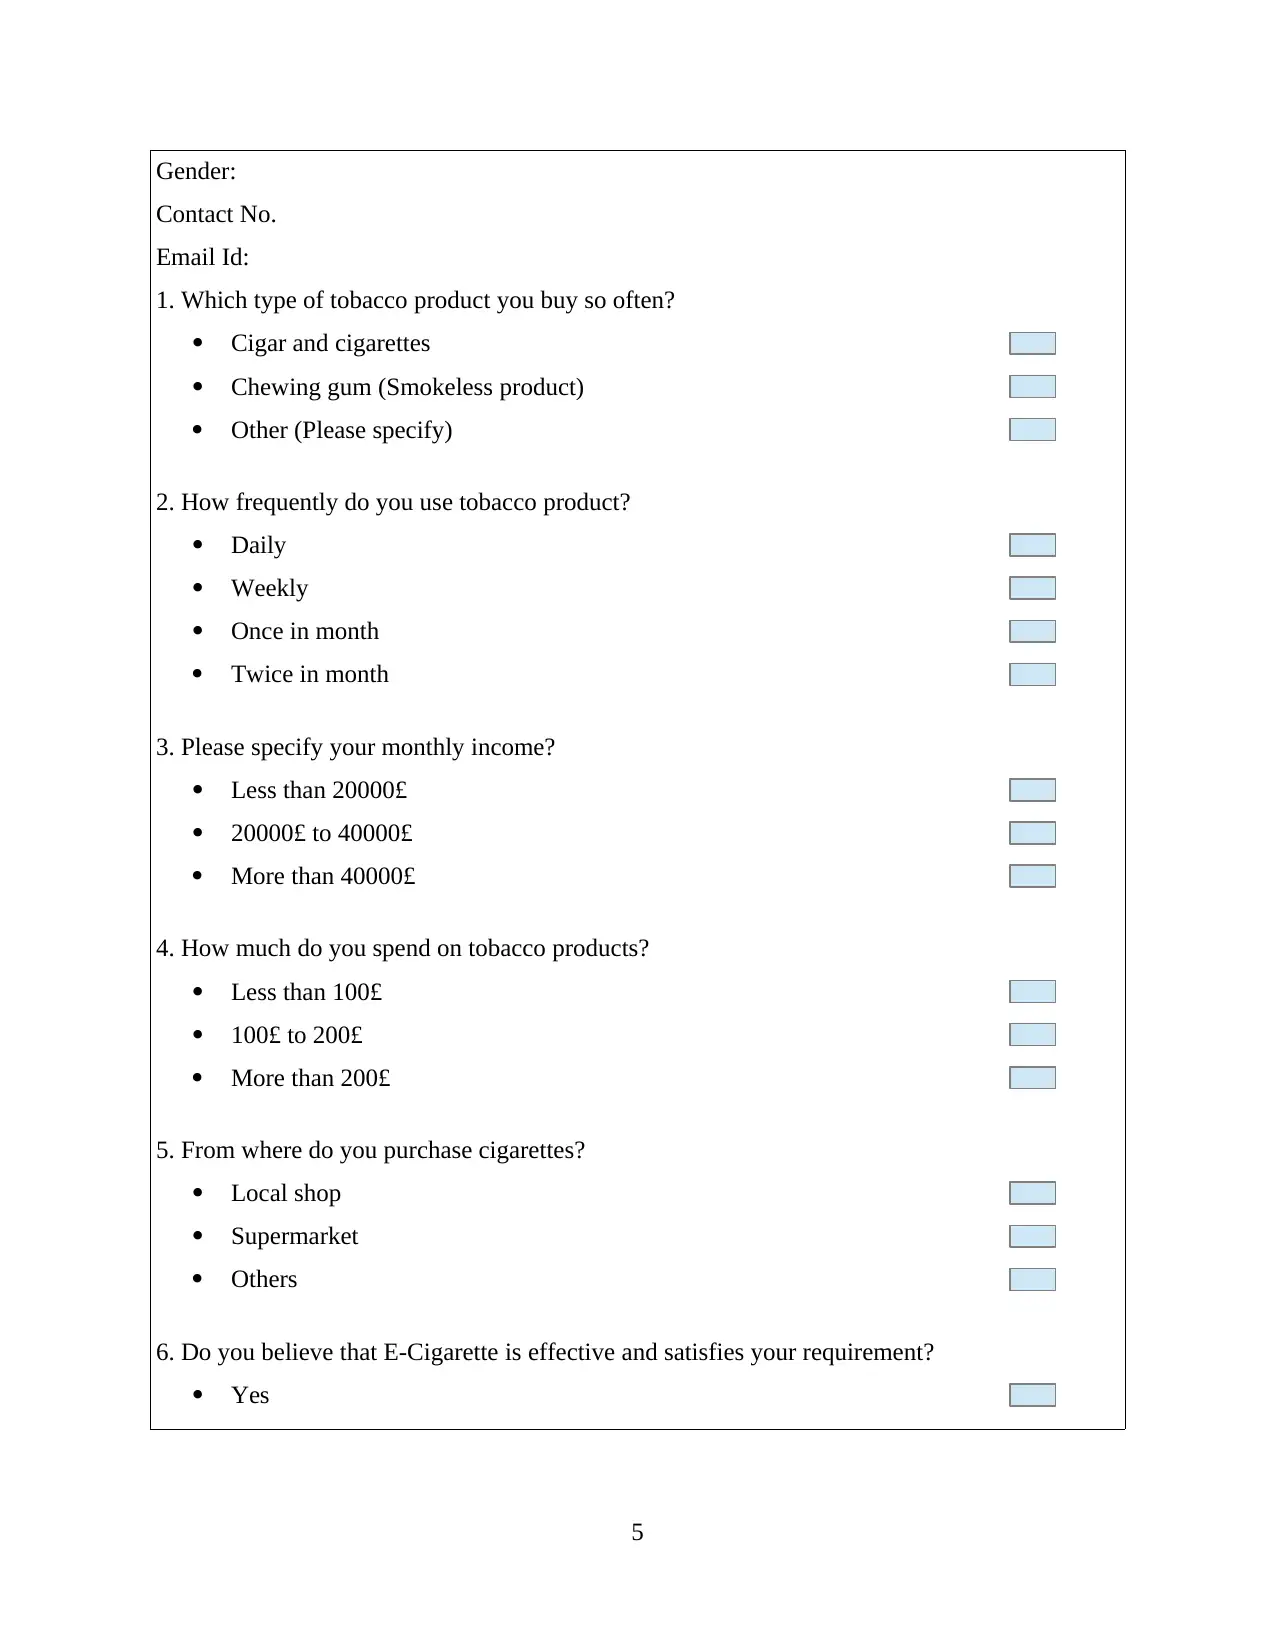
Gender:
Contact No.
Email Id:
1. Which type of tobacco product you buy so often?
Cigar and cigarettes
Chewing gum (Smokeless product)
Other (Please specify)
2. How frequently do you use tobacco product?
Daily
Weekly
Once in month
Twice in month
3. Please specify your monthly income?
Less than 20000£
20000£ to 40000£
More than 40000£
4. How much do you spend on tobacco products?
Less than 100£
100£ to 200£
More than 200£
5. From where do you purchase cigarettes?
Local shop
Supermarket
Others
6. Do you believe that E-Cigarette is effective and satisfies your requirement?
Yes
5
Paraphrase This Document
Need a fresh take? Get an instant paraphrase of this document with our AI Paraphraser
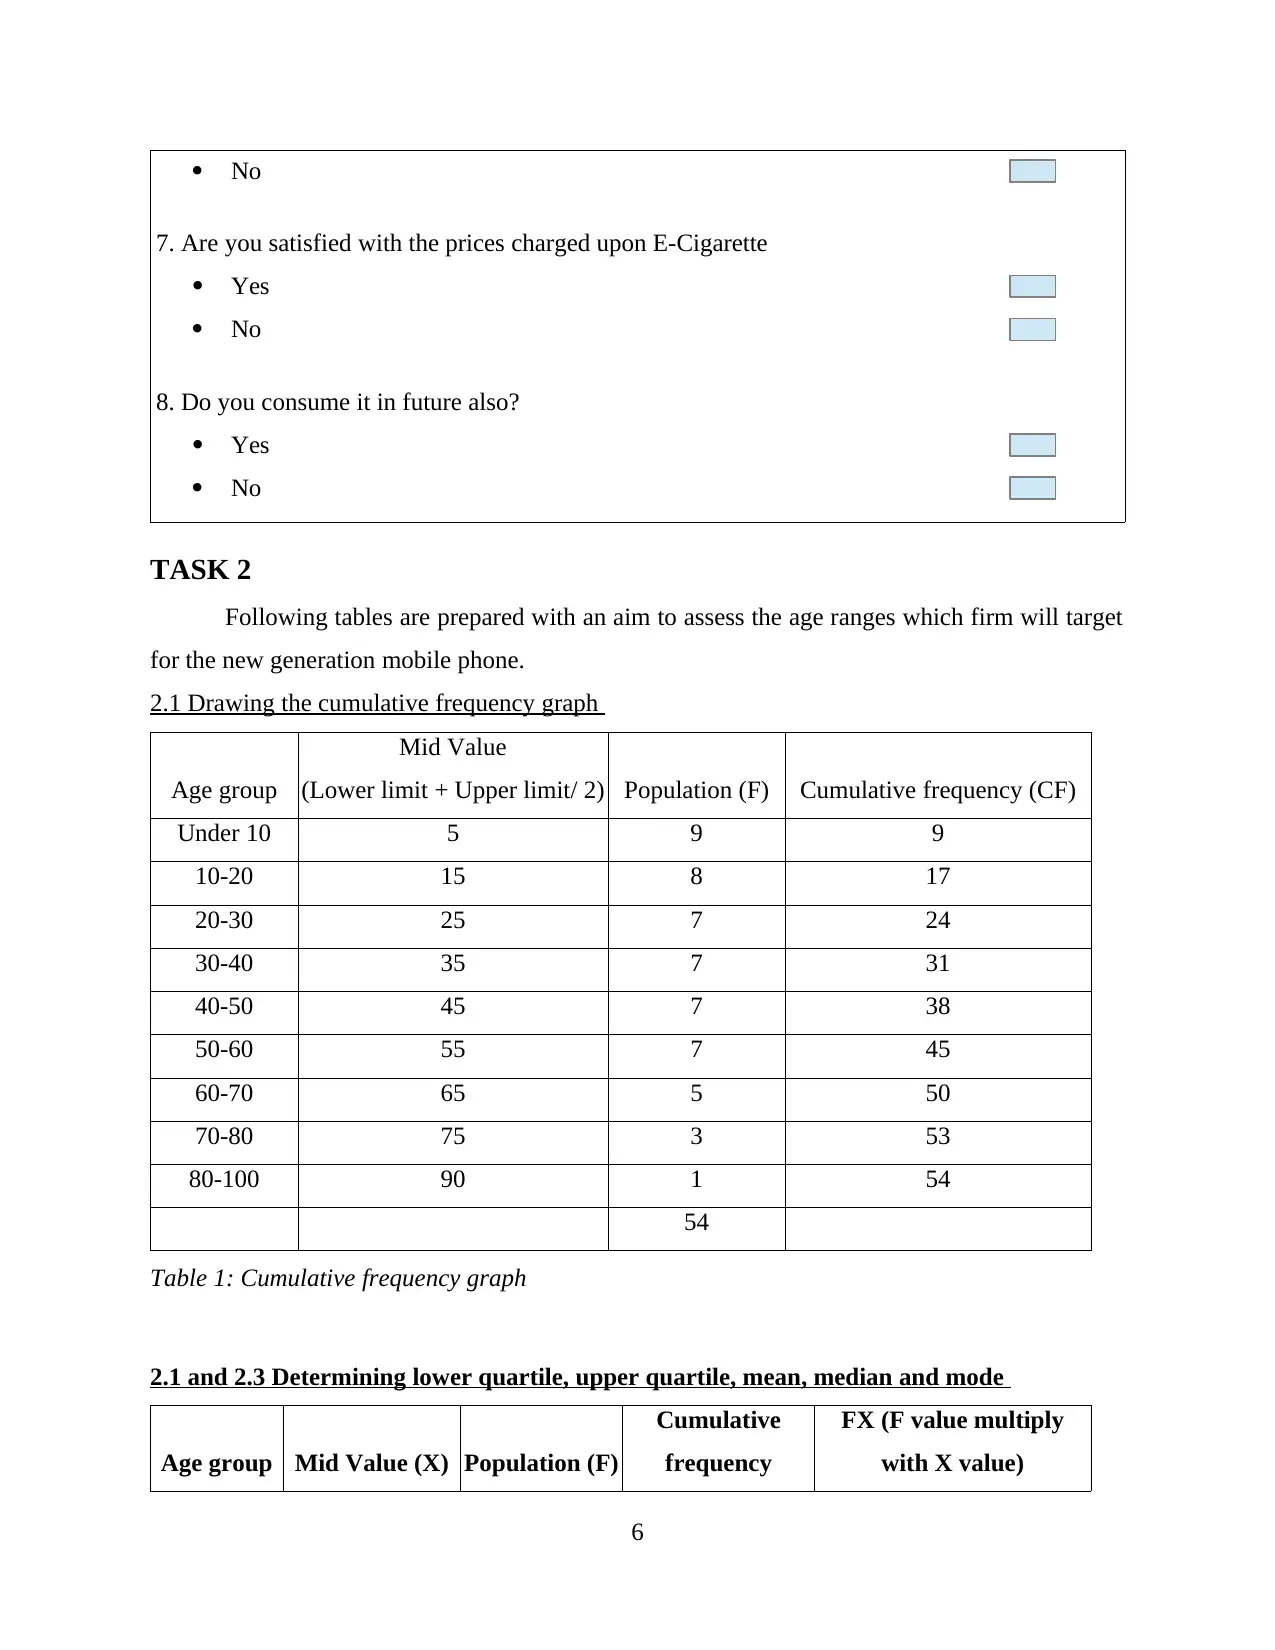
No
7. Are you satisfied with the prices charged upon E-Cigarette
Yes
No
8. Do you consume it in future also?
Yes
No
TASK 2
Following tables are prepared with an aim to assess the age ranges which firm will target
for the new generation mobile phone.
2.1 Drawing the cumulative frequency graph
Age group
Mid Value
(Lower limit + Upper limit/ 2) Population (F) Cumulative frequency (CF)
Under 10 5 9 9
10-20 15 8 17
20-30 25 7 24
30-40 35 7 31
40-50 45 7 38
50-60 55 7 45
60-70 65 5 50
70-80 75 3 53
80-100 90 1 54
54
Table 1: Cumulative frequency graph
2.1 and 2.3 Determining lower quartile, upper quartile, mean, median and mode
Age group Mid Value (X) Population (F)
Cumulative
frequency
FX (F value multiply
with X value)
6
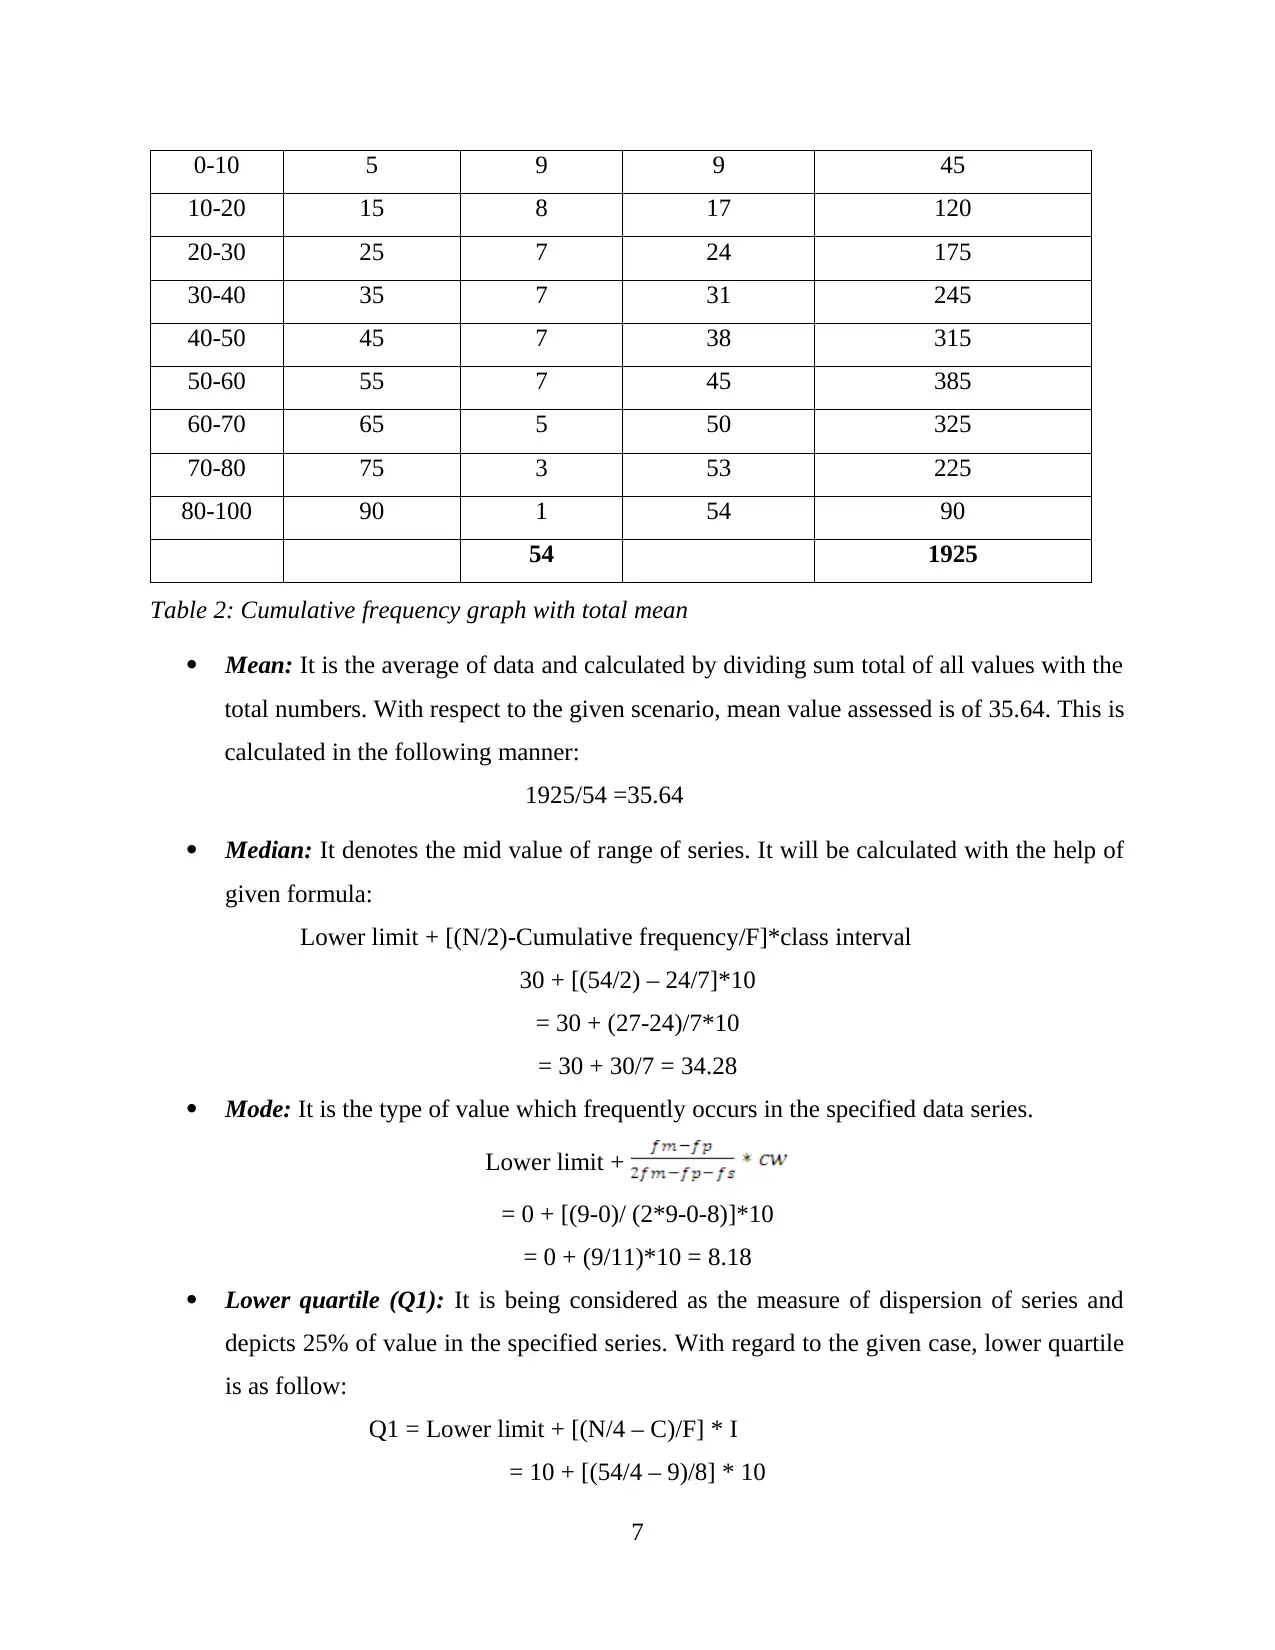
0-10 5 9 9 45
10-20 15 8 17 120
20-30 25 7 24 175
30-40 35 7 31 245
40-50 45 7 38 315
50-60 55 7 45 385
60-70 65 5 50 325
70-80 75 3 53 225
80-100 90 1 54 90
54 1925
Table 2: Cumulative frequency graph with total mean
Mean: It is the average of data and calculated by dividing sum total of all values with the
total numbers. With respect to the given scenario, mean value assessed is of 35.64. This is
calculated in the following manner:
1925/54 =35.64
Median: It denotes the mid value of range of series. It will be calculated with the help of
given formula:
Lower limit + [(N/2)-Cumulative frequency/F]*class interval
30 + [(54/2) – 24/7]*10
= 30 + (27-24)/7*10
= 30 + 30/7 = 34.28
Mode: It is the type of value which frequently occurs in the specified data series.
Lower limit +
= 0 + [(9-0)/ (2*9-0-8)]*10
= 0 + (9/11)*10 = 8.18
Lower quartile (Q1): It is being considered as the measure of dispersion of series and
depicts 25% of value in the specified series. With regard to the given case, lower quartile
is as follow:
Q1 = Lower limit + [(N/4 – C)/F] * I
= 10 + [(54/4 – 9)/8] * 10
7
⊘ This is a preview!⊘
Do you want full access?
Subscribe today to unlock all pages.
Trusted by 1+ million students worldwide
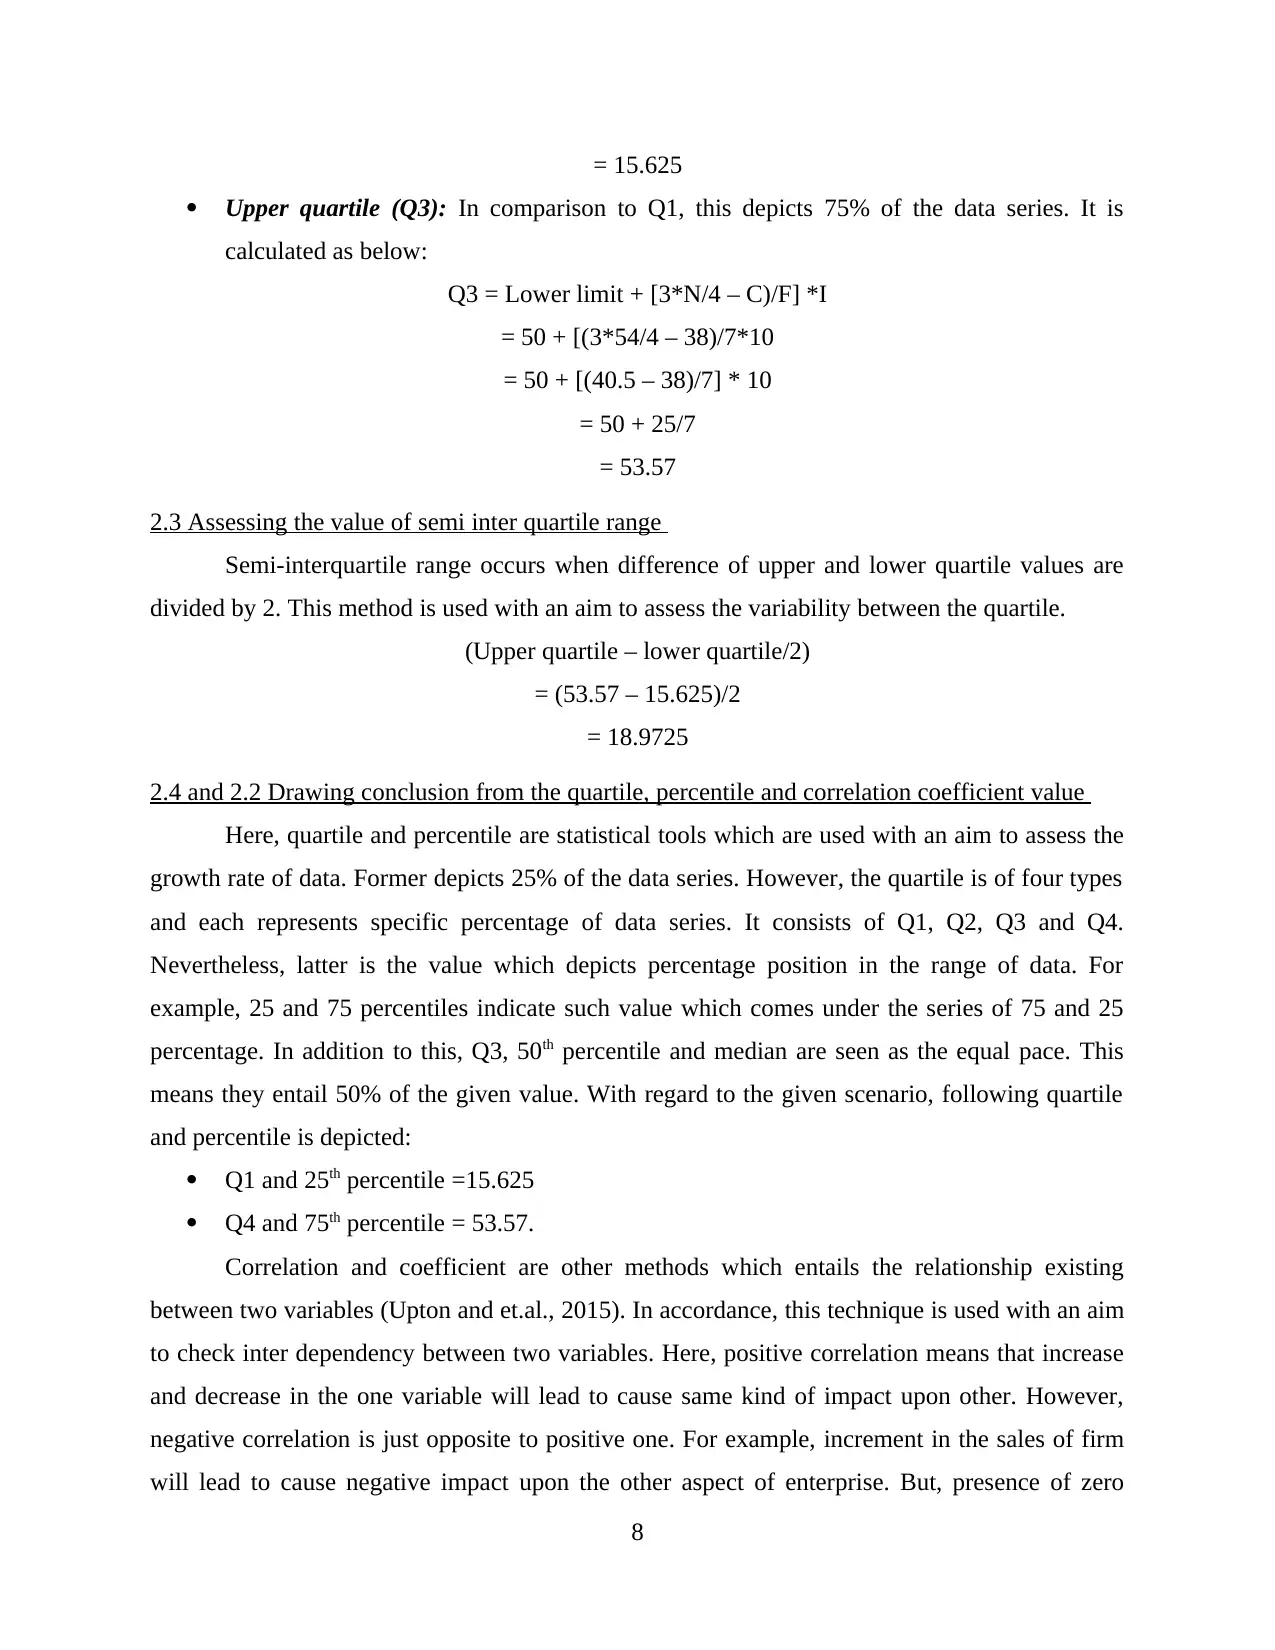
= 15.625
Upper quartile (Q3): In comparison to Q1, this depicts 75% of the data series. It is
calculated as below:
Q3 = Lower limit + [3*N/4 – C)/F] *I
= 50 + [(3*54/4 – 38)/7*10
= 50 + [(40.5 – 38)/7] * 10
= 50 + 25/7
= 53.57
2.3 Assessing the value of semi inter quartile range
Semi-interquartile range occurs when difference of upper and lower quartile values are
divided by 2. This method is used with an aim to assess the variability between the quartile.
(Upper quartile – lower quartile/2)
= (53.57 – 15.625)/2
= 18.9725
2.4 and 2.2 Drawing conclusion from the quartile, percentile and correlation coefficient value
Here, quartile and percentile are statistical tools which are used with an aim to assess the
growth rate of data. Former depicts 25% of the data series. However, the quartile is of four types
and each represents specific percentage of data series. It consists of Q1, Q2, Q3 and Q4.
Nevertheless, latter is the value which depicts percentage position in the range of data. For
example, 25 and 75 percentiles indicate such value which comes under the series of 75 and 25
percentage. In addition to this, Q3, 50th percentile and median are seen as the equal pace. This
means they entail 50% of the given value. With regard to the given scenario, following quartile
and percentile is depicted:
Q1 and 25th percentile =15.625
Q4 and 75th percentile = 53.57.
Correlation and coefficient are other methods which entails the relationship existing
between two variables (Upton and et.al., 2015). In accordance, this technique is used with an aim
to check inter dependency between two variables. Here, positive correlation means that increase
and decrease in the one variable will lead to cause same kind of impact upon other. However,
negative correlation is just opposite to positive one. For example, increment in the sales of firm
will lead to cause negative impact upon the other aspect of enterprise. But, presence of zero
8
Paraphrase This Document
Need a fresh take? Get an instant paraphrase of this document with our AI Paraphraser
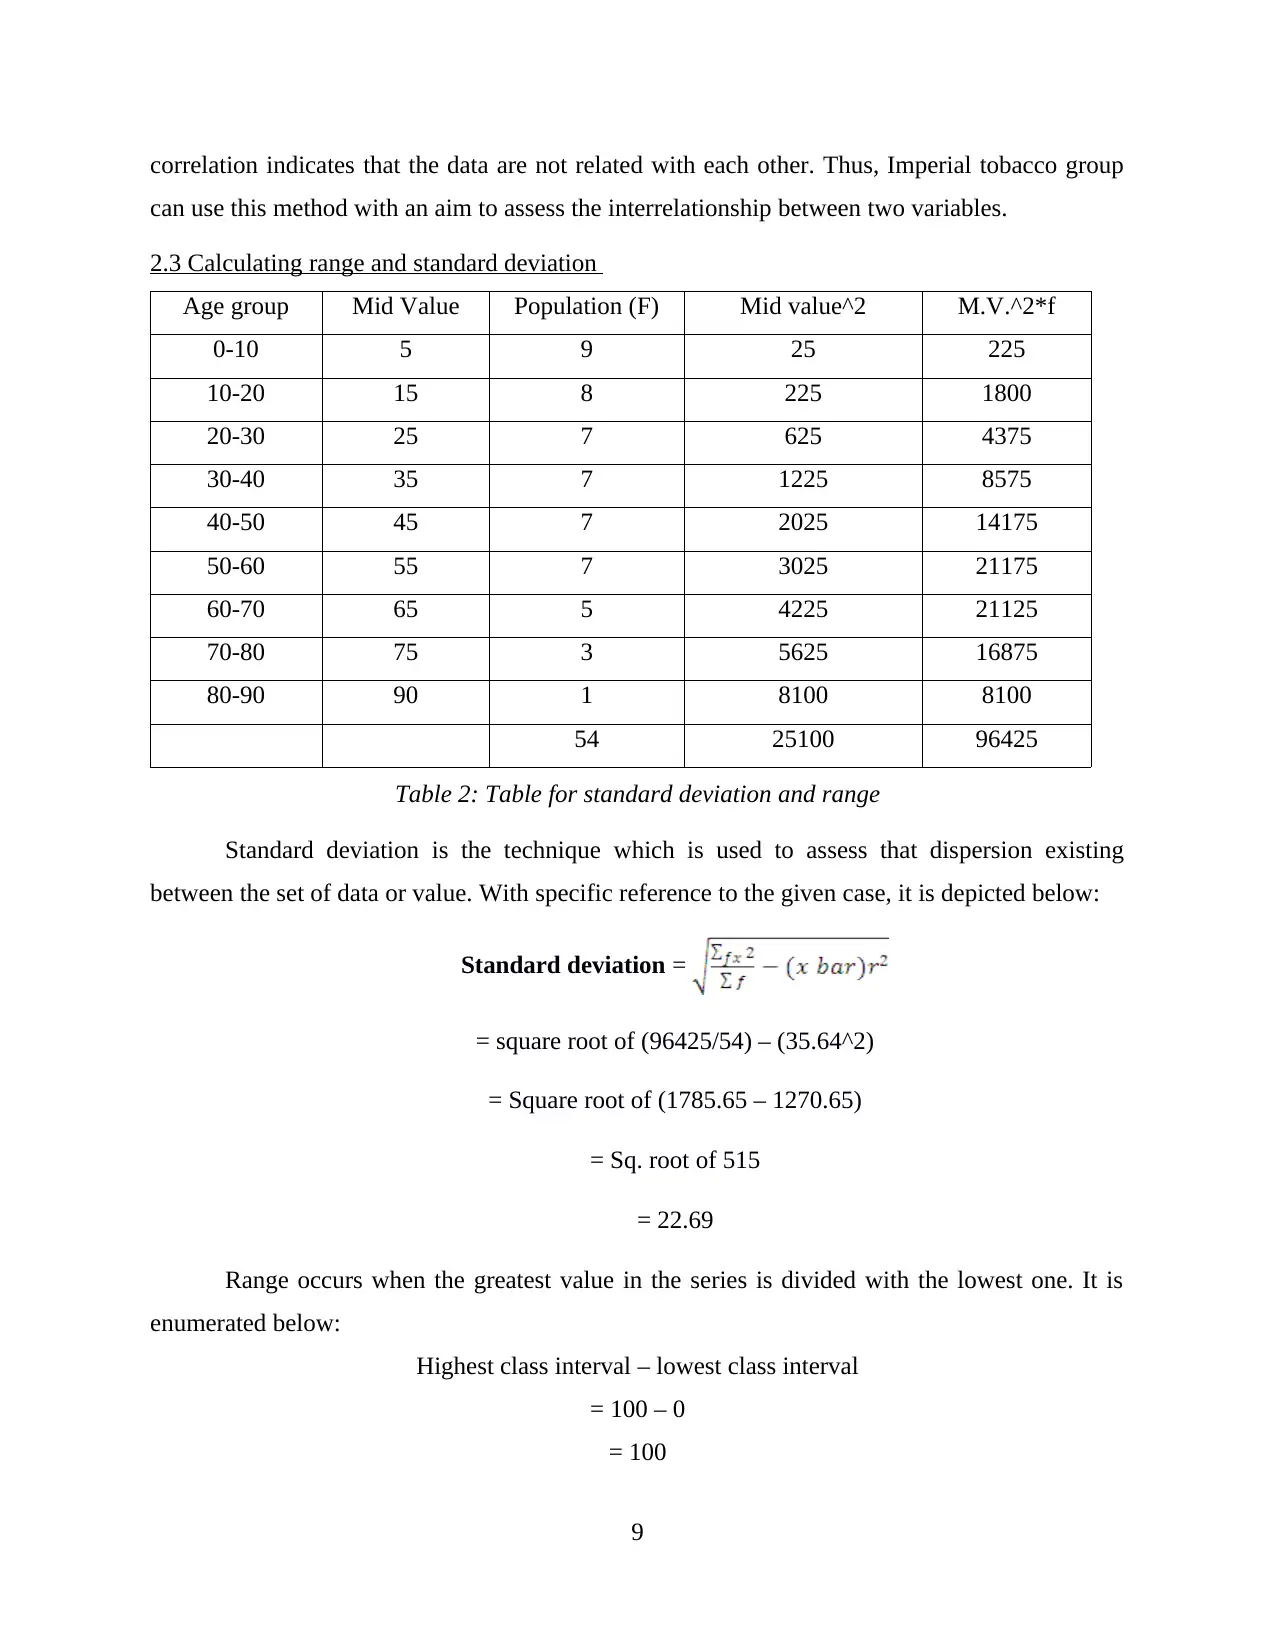
correlation indicates that the data are not related with each other. Thus, Imperial tobacco group
can use this method with an aim to assess the interrelationship between two variables.
2.3 Calculating range and standard deviation
Age group Mid Value Population (F) Mid value^2 M.V.^2*f
0-10 5 9 25 225
10-20 15 8 225 1800
20-30 25 7 625 4375
30-40 35 7 1225 8575
40-50 45 7 2025 14175
50-60 55 7 3025 21175
60-70 65 5 4225 21125
70-80 75 3 5625 16875
80-90 90 1 8100 8100
54 25100 96425
Table 2: Table for standard deviation and range
Standard deviation is the technique which is used to assess that dispersion existing
between the set of data or value. With specific reference to the given case, it is depicted below:
Standard deviation =
= square root of (96425/54) – (35.64^2)
= Square root of (1785.65 – 1270.65)
= Sq. root of 515
= 22.69
Range occurs when the greatest value in the series is divided with the lowest one. It is
enumerated below:
Highest class interval – lowest class interval
= 100 – 0
= 100
9
TASK 3
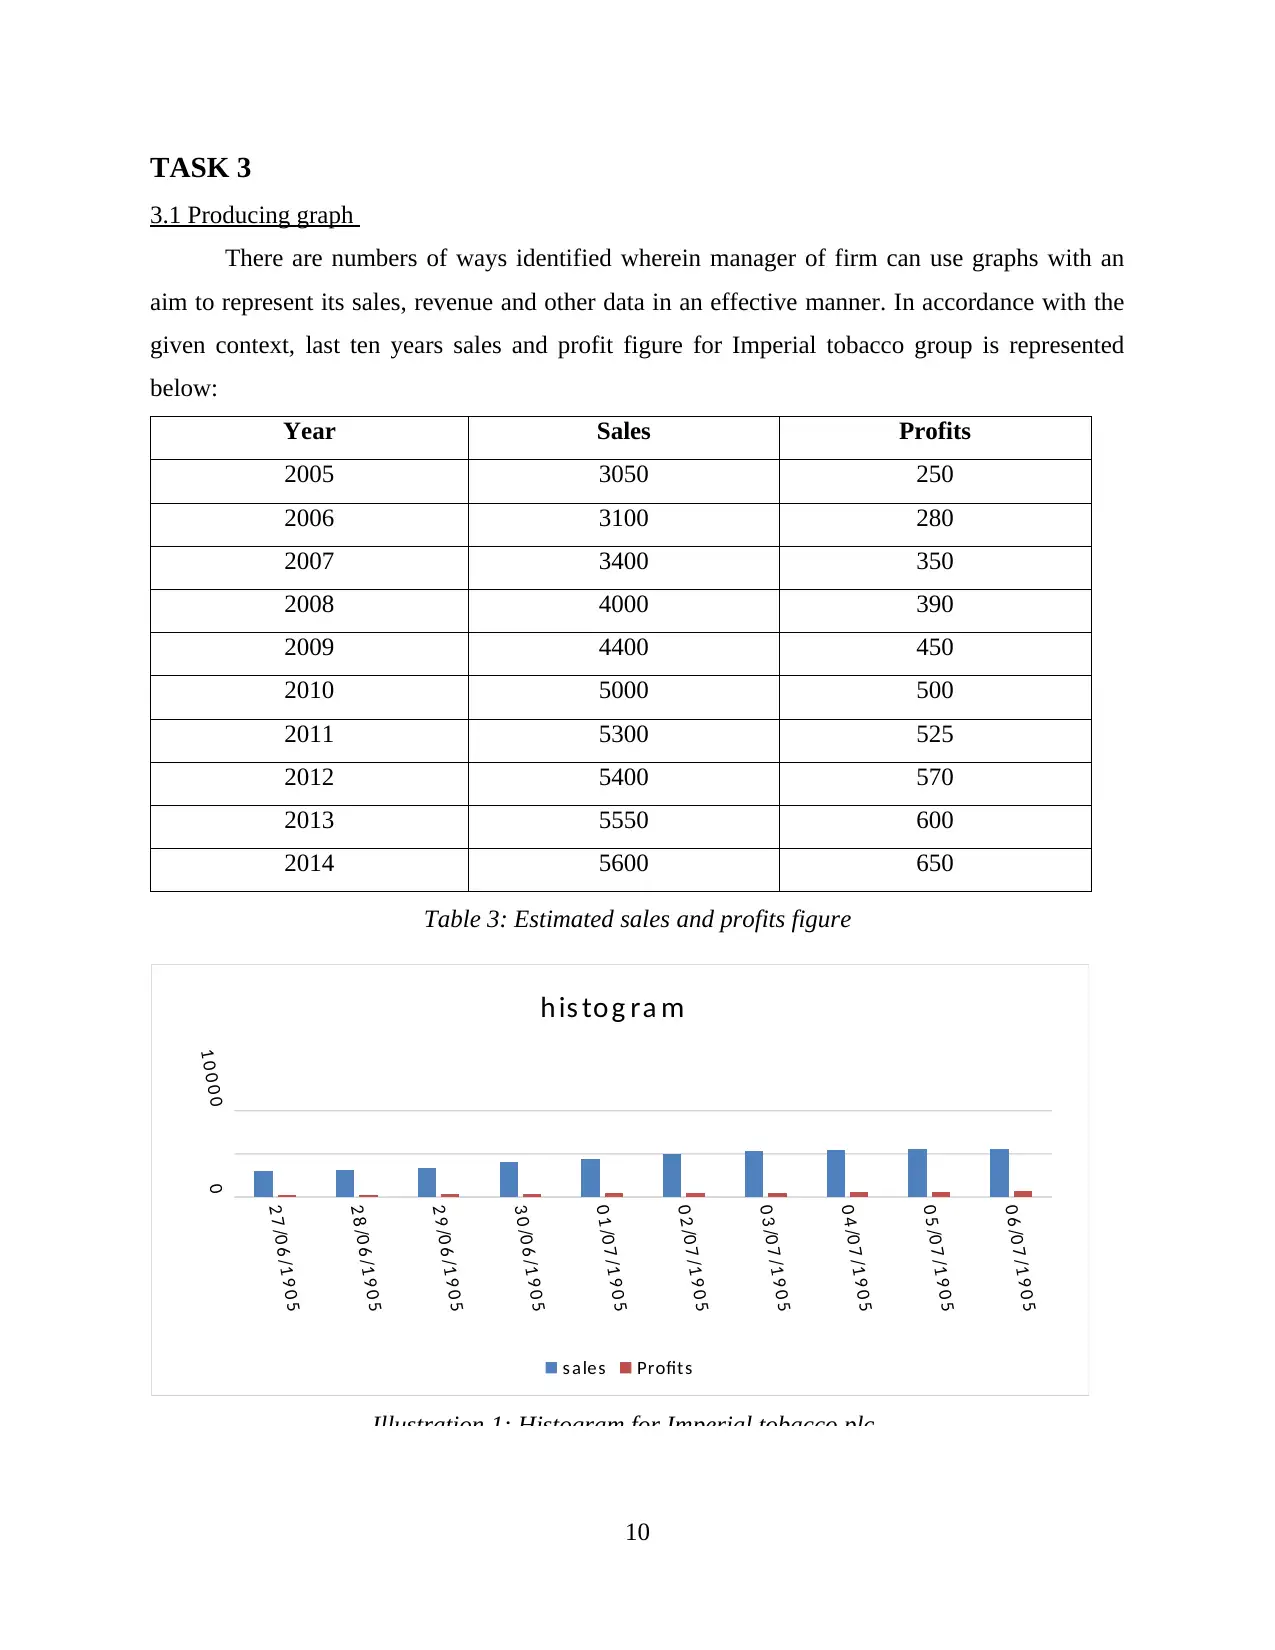
3.1 Producing graph
There are numbers of ways identified wherein manager of firm can use graphs with an
aim to represent its sales, revenue and other data in an effective manner. In accordance with the
given context, last ten years sales and profit figure for Imperial tobacco group is represented
below:
Year Sales Profits
2005 3050 250
2006 3100 280
2007 3400 350
2008 4000 390
2009 4400 450
2010 5000 500
2011 5300 525
2012 5400 570
2013 5550 600
2014 5600 650
Table 3: Estimated sales and profits figure
10
2 7 /0 6 /1 9 0 5
2 8 /0 6 /1 9 0 5
2 9 /0 6 /1 9 0 5
3 0 /0 6 /1 9 0 5
0 1 /0 7 /1 9 0 5
0 2 /0 7 /1 9 0 5
0 3 /0 7 /1 9 0 5
0 4 /0 7 /1 9 0 5
0 5 /0 7 /1 9 0 5
0 6 /0 7 /1 9 0 5
0
1 0 0 0 0
h is to g ra m
s ales Profits
Illustration 1: Histogram for Imperial tobacco plc
⊘ This is a preview!⊘
Do you want full access?
Subscribe today to unlock all pages.
Trusted by 1+ million students worldwide
1 out of 21
Related Documents


Your All-in-One AI-Powered Toolkit for Academic Success.
+13062052269
info@desklib.com
Available 24*7 on WhatsApp / Email
![[object Object]](/_next/static/media/star-bottom.7253800d.svg)
Unlock your academic potential
Copyright © 2020–2026 A2Z Services. All Rights Reserved. Developed and managed by ZUCOL.