Business Decision Making: Presentation on Student Satisfaction Levels

Verified

Added on  2023/04/04

|8
|325
|487
Presentation
AI Summary
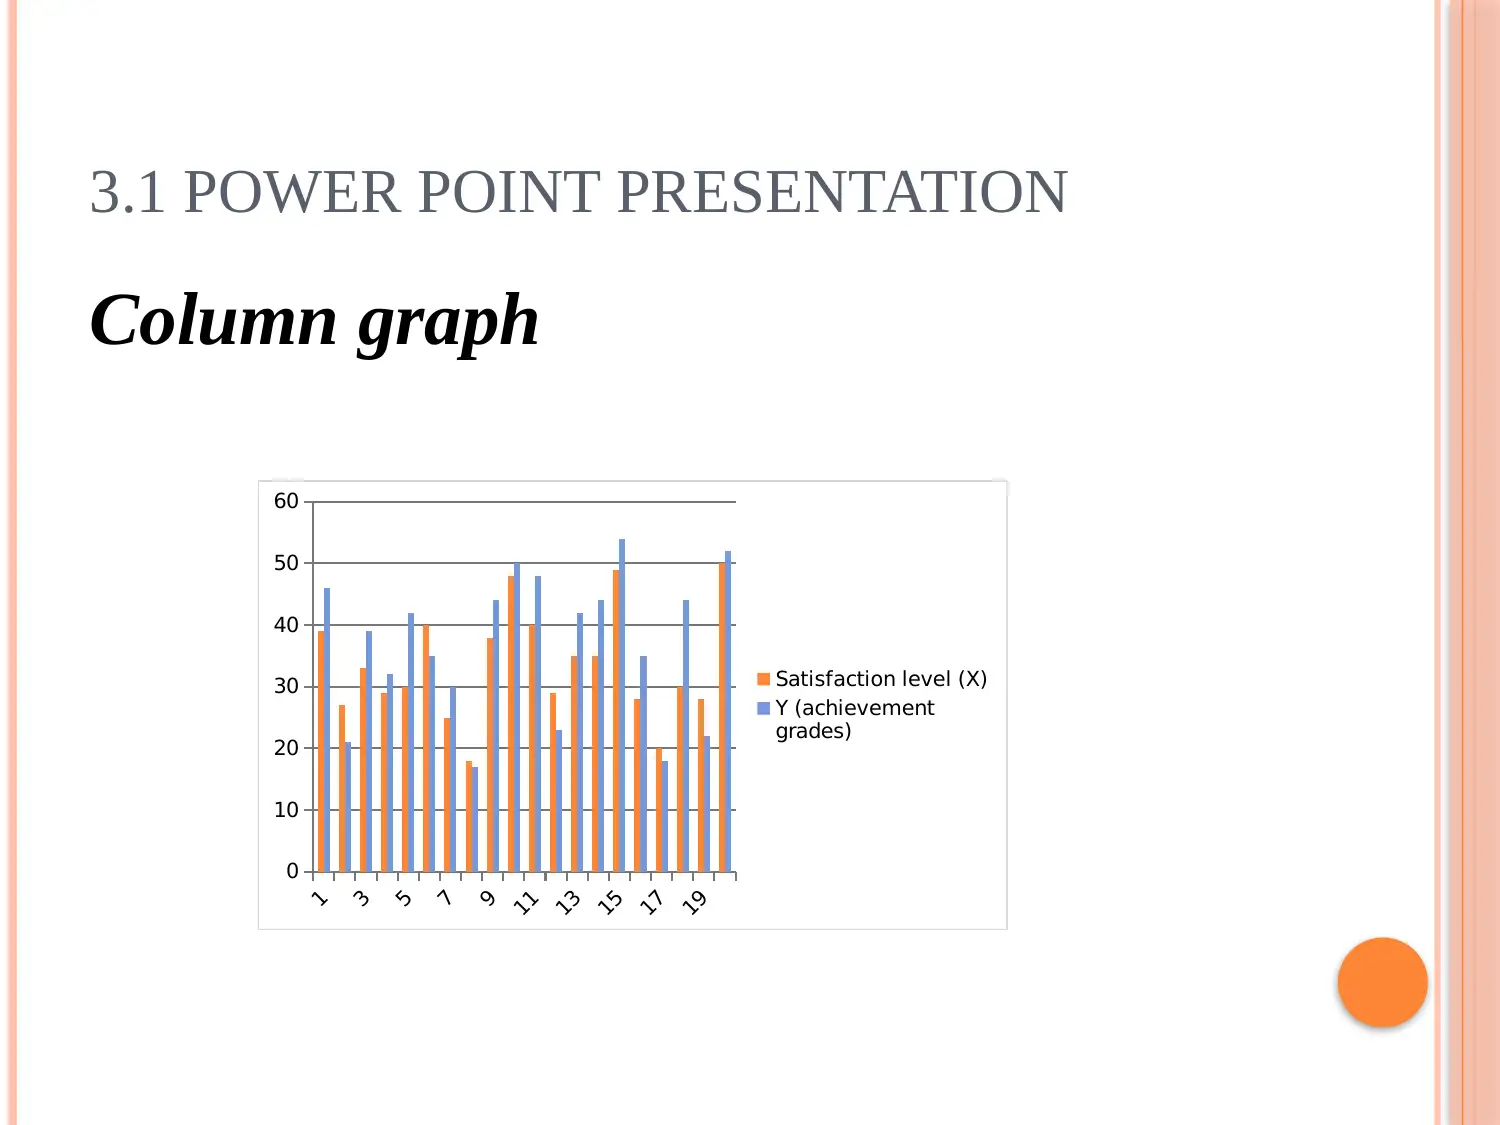
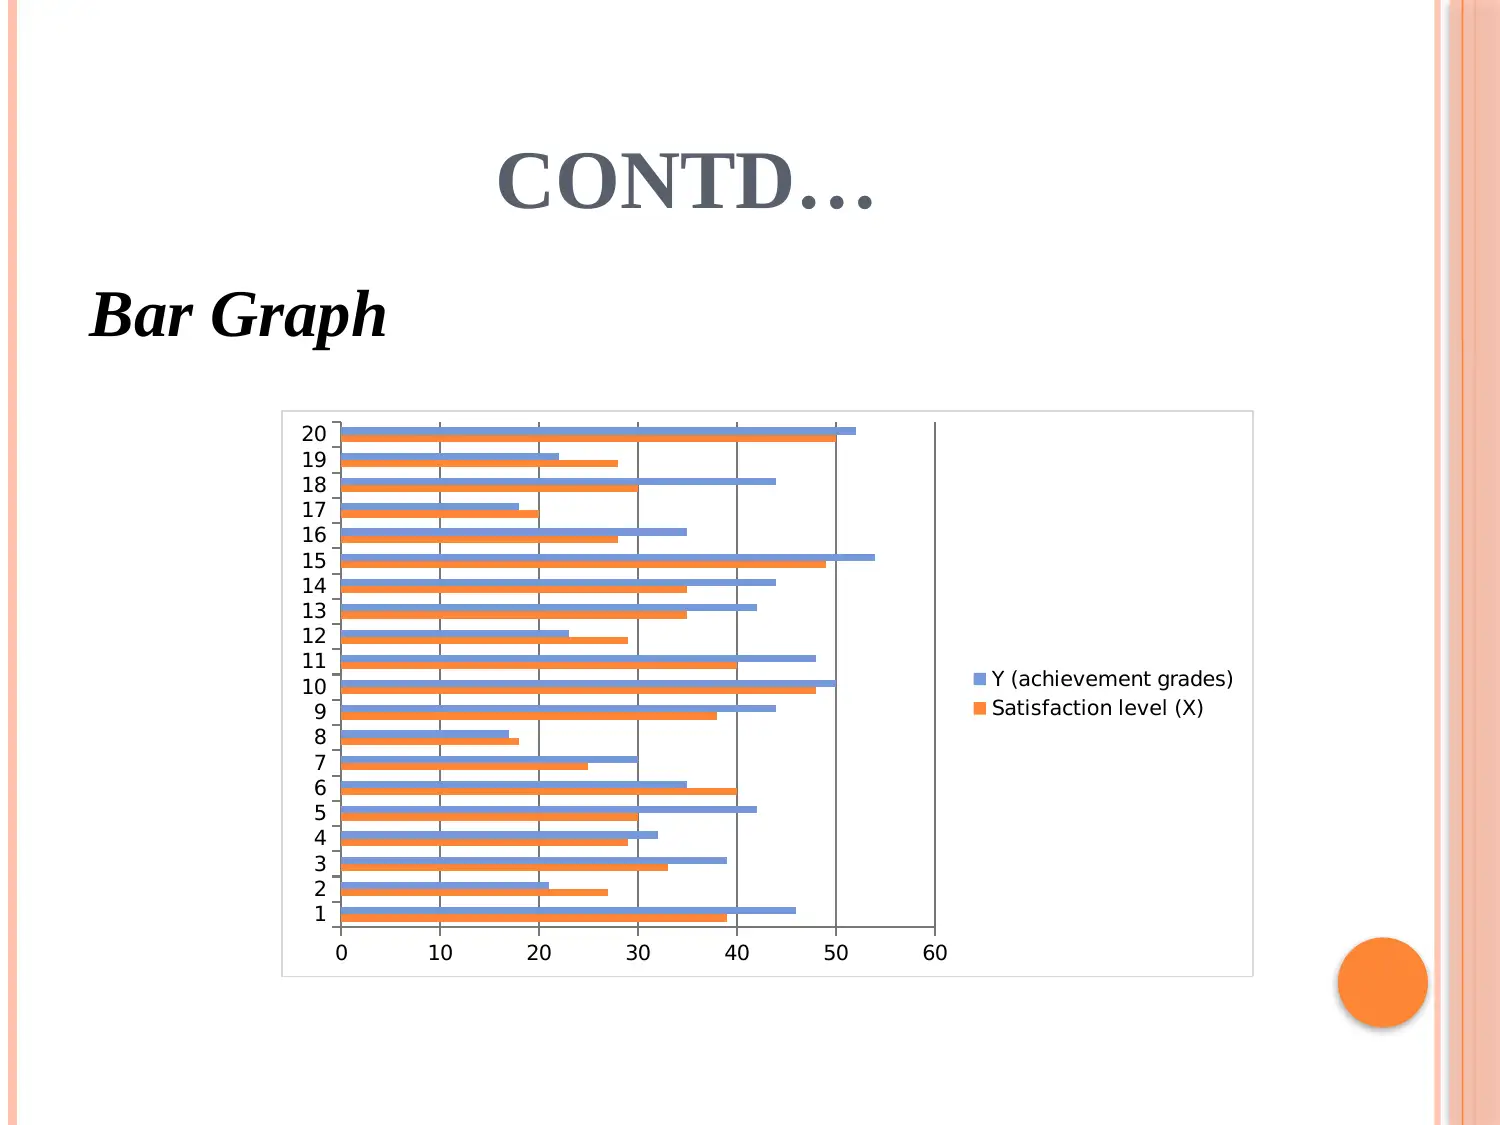
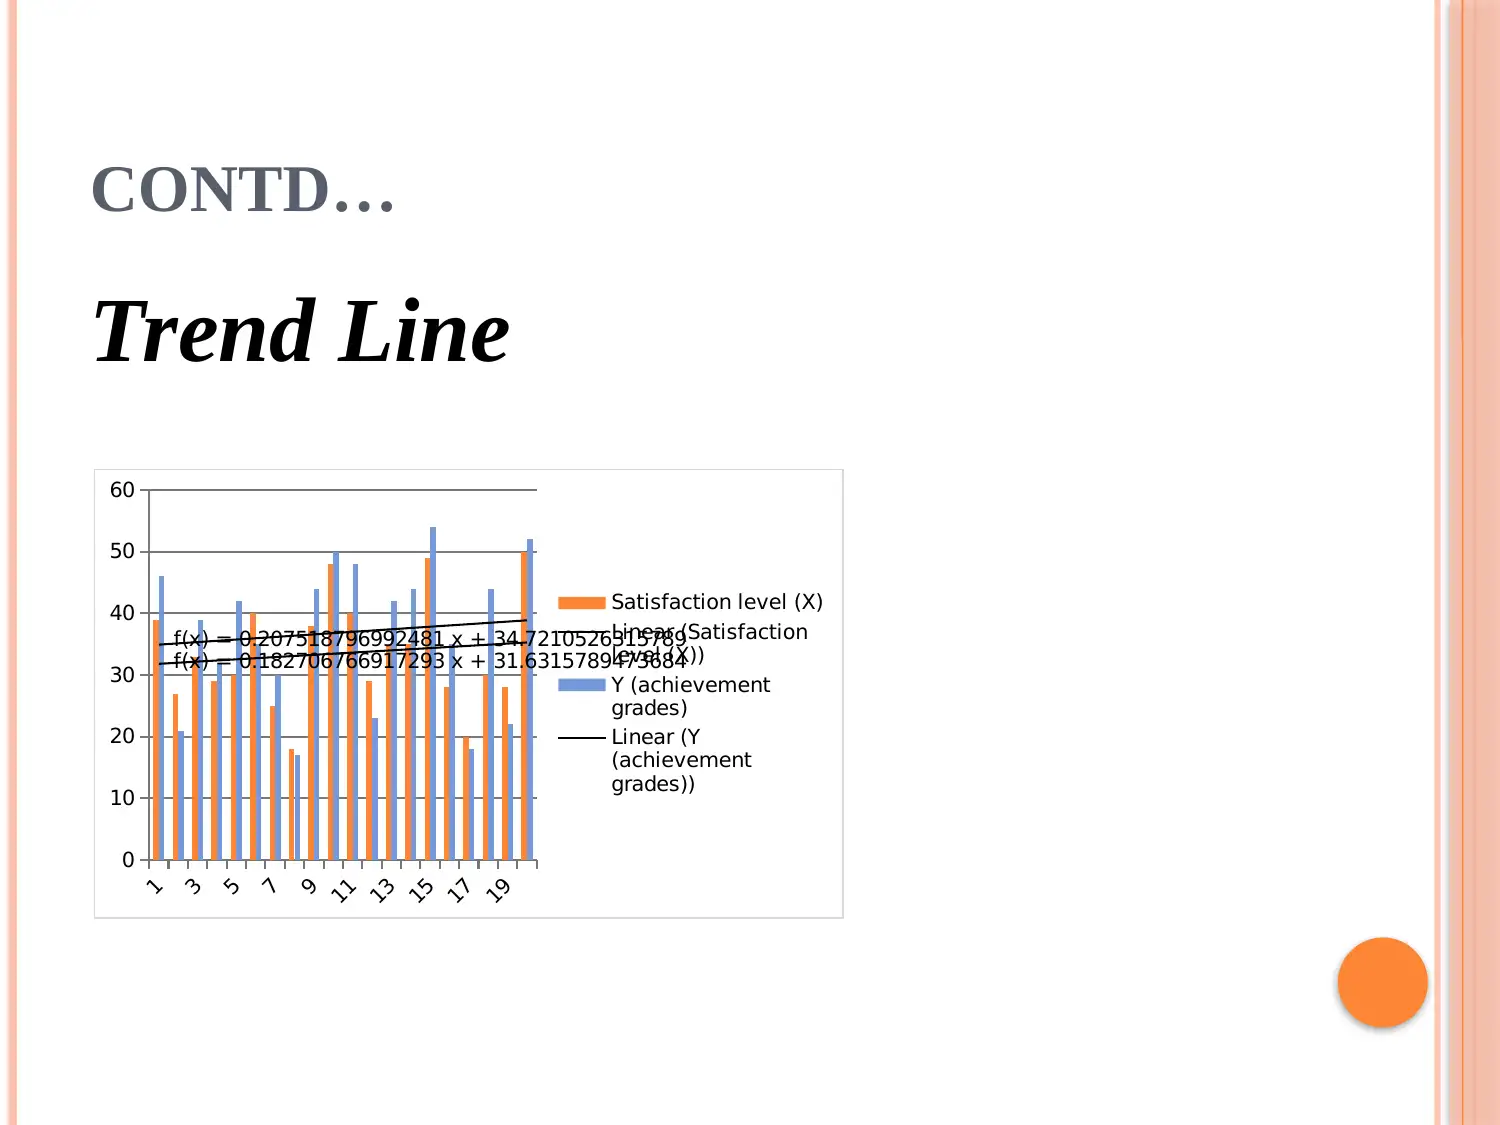
This presentation explores the relationship between student satisfaction levels and achievement grades, particularly focusing on students. Utilizing column graphs, bar graphs, and trend lines, the analysis demonstrates a positive correlation, indicating that higher achievement grades are associated with increased student satisfaction. The trend line analysis further suggests that both satisfaction levels and achievement grades are expected to rise in the future, reinforcing the importance of enhancing student performance to improve overall satisfaction within college institutions. References to relevant academic sources are included to support the findings and provide a comprehensive overview of the topic. Desklib provides this document as well as a range of study tools.
Document Page
BUSINESS DECISION MAKING
TASK 3
tabler-icon-diamond-filled.svg

Paraphrase This Document

Need a fresh take? Get an instant paraphrase of this document with our AI Paraphraser
Document Page
3.1 POWER POINT PRESENTATION
Column graph
1
3
5
7
9
11
13
15
17
19
0
10
20
30
40
50
60
Satisfaction level (X)
Y (achievement
grades)
Document Page
CONTD…
Bar Graph
1
2
3
4
5
6
7
8
9
10
11
12
13
14
15
16
17
18
19
20
0 10 20 30 40 50 60
Y (achievement grades)
Satisfaction level (X)
Document Page
CONTD…
The above mentioned graphs shows that
satisfaction level of the students of UK CBC
is highly dependent on their achievement
grades.
Thus, by enhancing the performance level of
student’s college institutions can evolve
satisfaction among them.
Graph shown below entails that satisfaction
level of the student’s are highly influenced
from the marks attained in the examination.
tabler-icon-diamond-filled.svg

Paraphrase This Document

Need a fresh take? Get an instant paraphrase of this document with our AI Paraphraser
Document Page
CONTD…
Trend Line
1
3
5
7
9
11
13
15
17
19
0
10
20
30
40
50
60
f(x) = 0.182706766917293 x + 31.6315789473684
f(x) = 0.207518796992481 x + 34.7210526315789
Satisfaction level (X)
Linear (Satisfaction
level (X))
Y (achievement
grades)
Linear (Y
(achievement
grades))
Document Page
CONTD..
Trend line may be defined as a graphical presentation
which in turn helps in evaluating the movement of data
set in an effectual way.
Such technical analysis will help in assessing whether
specific data set will rise or decline in the near future.
The above depicted trend line shows that satisfaction
level of students and their achievement grades will raise
in the near future.
Both the elements will rise in the similar direction due to
having positive relationship.
Document Page
REFERENCES
Biersack, R., Herrnson, P. S. and Wilcox, C., 2016. Risky
Business: PAC Decision Making and Strategy: PAC
Decision Making and Strategy. Routledge.
Ezeonwumelu, A. N., Kalu, C. and Johnson, E. H., 2016.
Development of swim lane workflow process map for
sales and inventory workflow management information
system: A case study of petrospan integrated services,
Eket, Akwa Ibom State, Nigeria. Mathematical and
Software Engineering. 2(2). pp.57-65.
tabler-icon-diamond-filled.svg

Paraphrase This Document

Need a fresh take? Get an instant paraphrase of this document with our AI Paraphraser
Document Page
chevron_up_icon
1 out of 8
circle_padding
hide_on_mobile
zoom_out_icon
[object Object]