Detailed Business Development Plan with Financial Projections
VerifiedAdded on 2020/05/01
|13
|2040
|56
Report
AI Summary
This business development plan provides a comprehensive overview of a startup's financial strategy. It includes a detailed sales forecast, outlining projected sales figures for the initial three years. The plan also details project funding requirements, including start-up expenses and sources of funds, such as owner contributions and potential loans. Cash flow projections are presented, illustrating anticipated cash inflows and outflows. The report includes a profit and loss account, break-even analysis, and a balance sheet to assess financial performance and stability. Additionally, a payback period analysis and a financial feasibility assessment are provided to evaluate the viability of the business model. The plan concludes with a bibliography of relevant sources.
Running head: BUSINESS DEVELOPMENT PLAN
Business Development Plan
Name of the Student
Name of the University
Authors Note
Course ID
Business Development Plan
Name of the Student
Name of the University
Authors Note
Course ID
Paraphrase This Document
Need a fresh take? Get an instant paraphrase of this document with our AI Paraphraser
1BUSINESS DEVELOPMENT PLAN
Table of Contents
Sales Forecast:............................................................................................................................2
Project Funding:.........................................................................................................................2
Cash Flow Projections:..............................................................................................................3
Profit and Loss Account:............................................................................................................4
Break-Even Analysis:.................................................................................................................5
Balance Sheet:............................................................................................................................6
Payback Period:..........................................................................................................................7
Financial feasibility:...................................................................................................................7
Bibliography List:....................................................................................................................11
2BUSINESS DEVELOPMENT PLAN
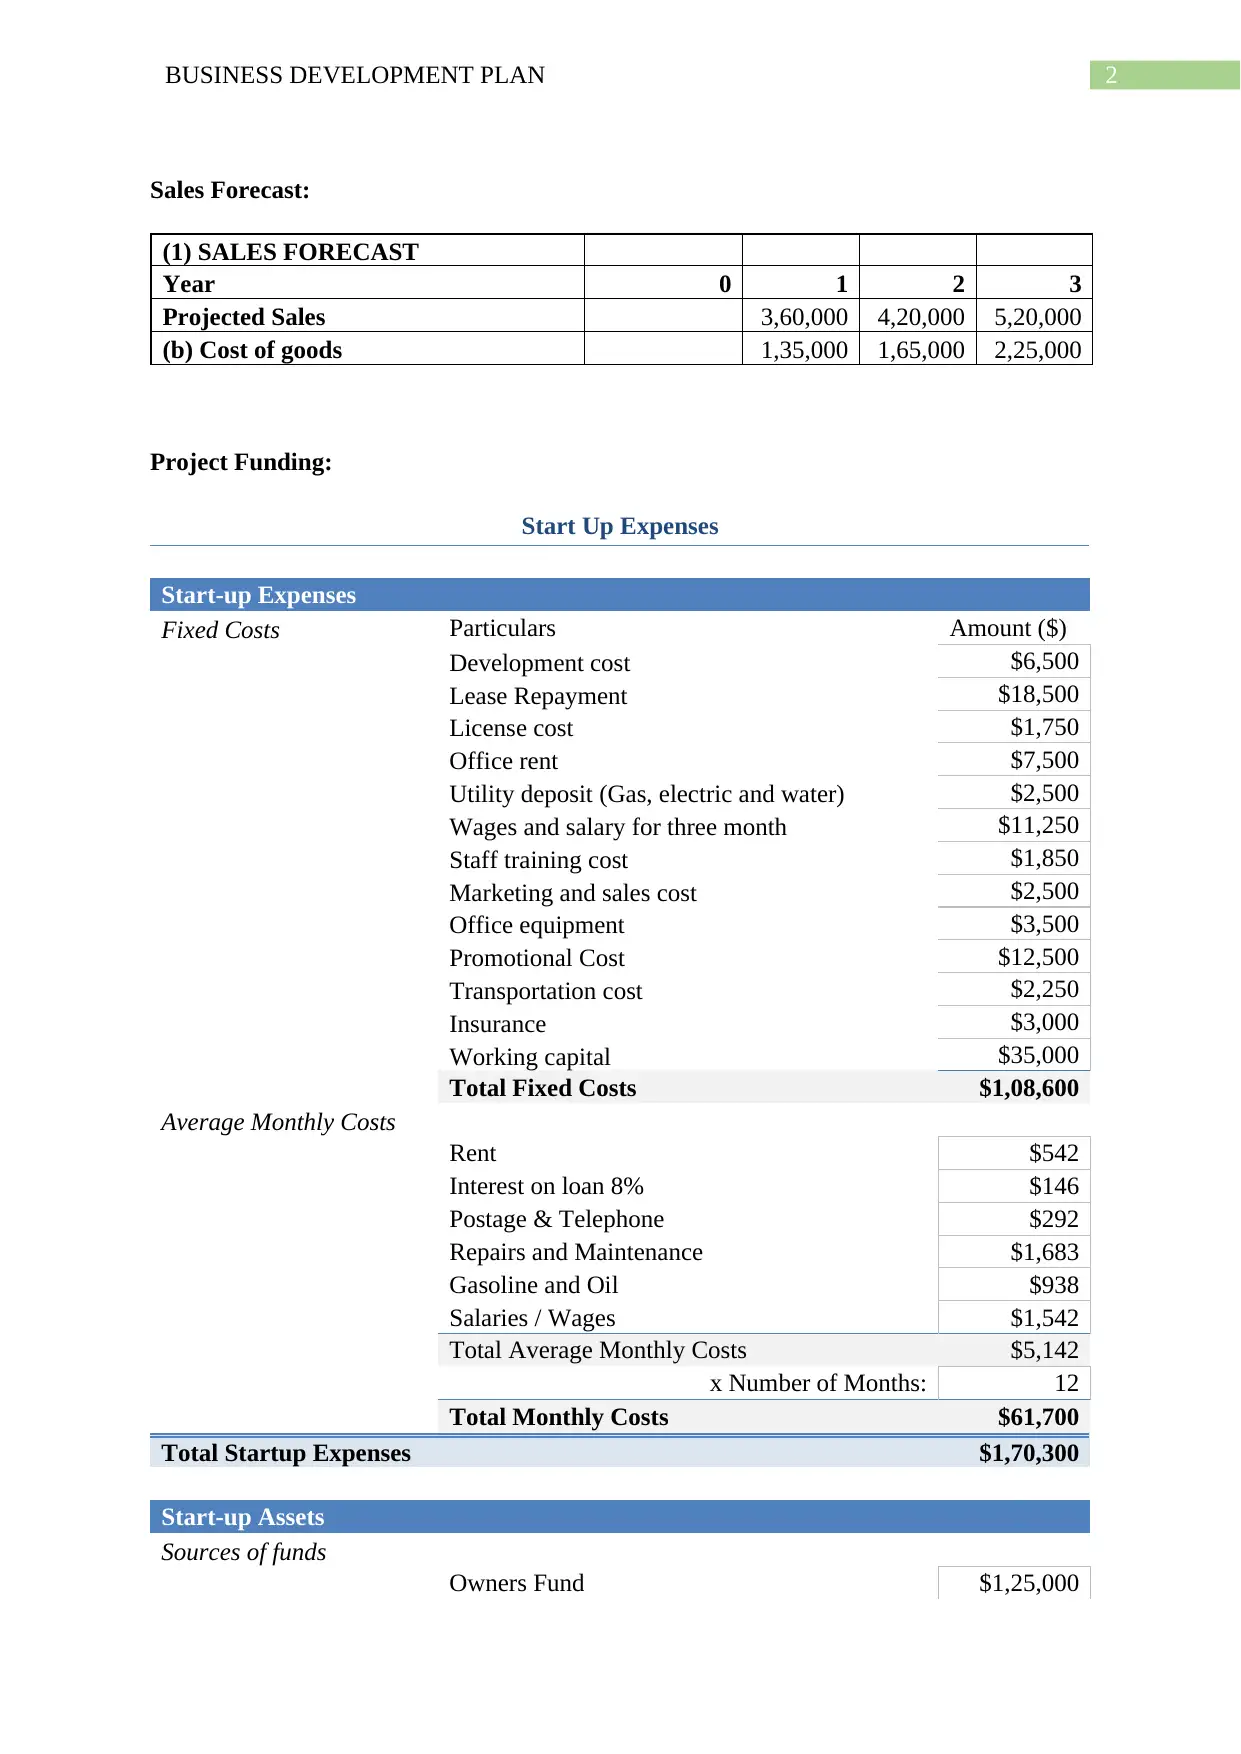
Sales Forecast:
(1) SALES FORECAST
Year 0 1 2 3
Projected Sales 3,60,000 4,20,000 5,20,000
(b) Cost of goods 1,35,000 1,65,000 2,25,000
Project Funding:
Start Up Expenses
Start-up Expenses
Fixed Costs Particulars Amount ($)
Development cost $6,500
Lease Repayment $18,500
License cost $1,750
Office rent $7,500
Utility deposit (Gas, electric and water) $2,500
Wages and salary for three month $11,250
Staff training cost $1,850
Marketing and sales cost $2,500
Office equipment $3,500
Promotional Cost $12,500
Transportation cost $2,250
Insurance $3,000
Working capital $35,000
Total Fixed Costs $1,08,600
Average Monthly Costs
Rent $542
Interest on loan 8% $146
Postage & Telephone $292
Repairs and Maintenance $1,683
Gasoline and Oil $938
Salaries / Wages $1,542
Total Average Monthly Costs $5,142
x Number of Months: 12
Total Monthly Costs $61,700
Total Startup Expenses $1,70,300
Start-up Assets
Sources of funds
Owners Fund $1,25,000
⊘ This is a preview!⊘
Do you want full access?
Subscribe today to unlock all pages.
Trusted by 1+ million students worldwide
3BUSINESS DEVELOPMENT PLAN
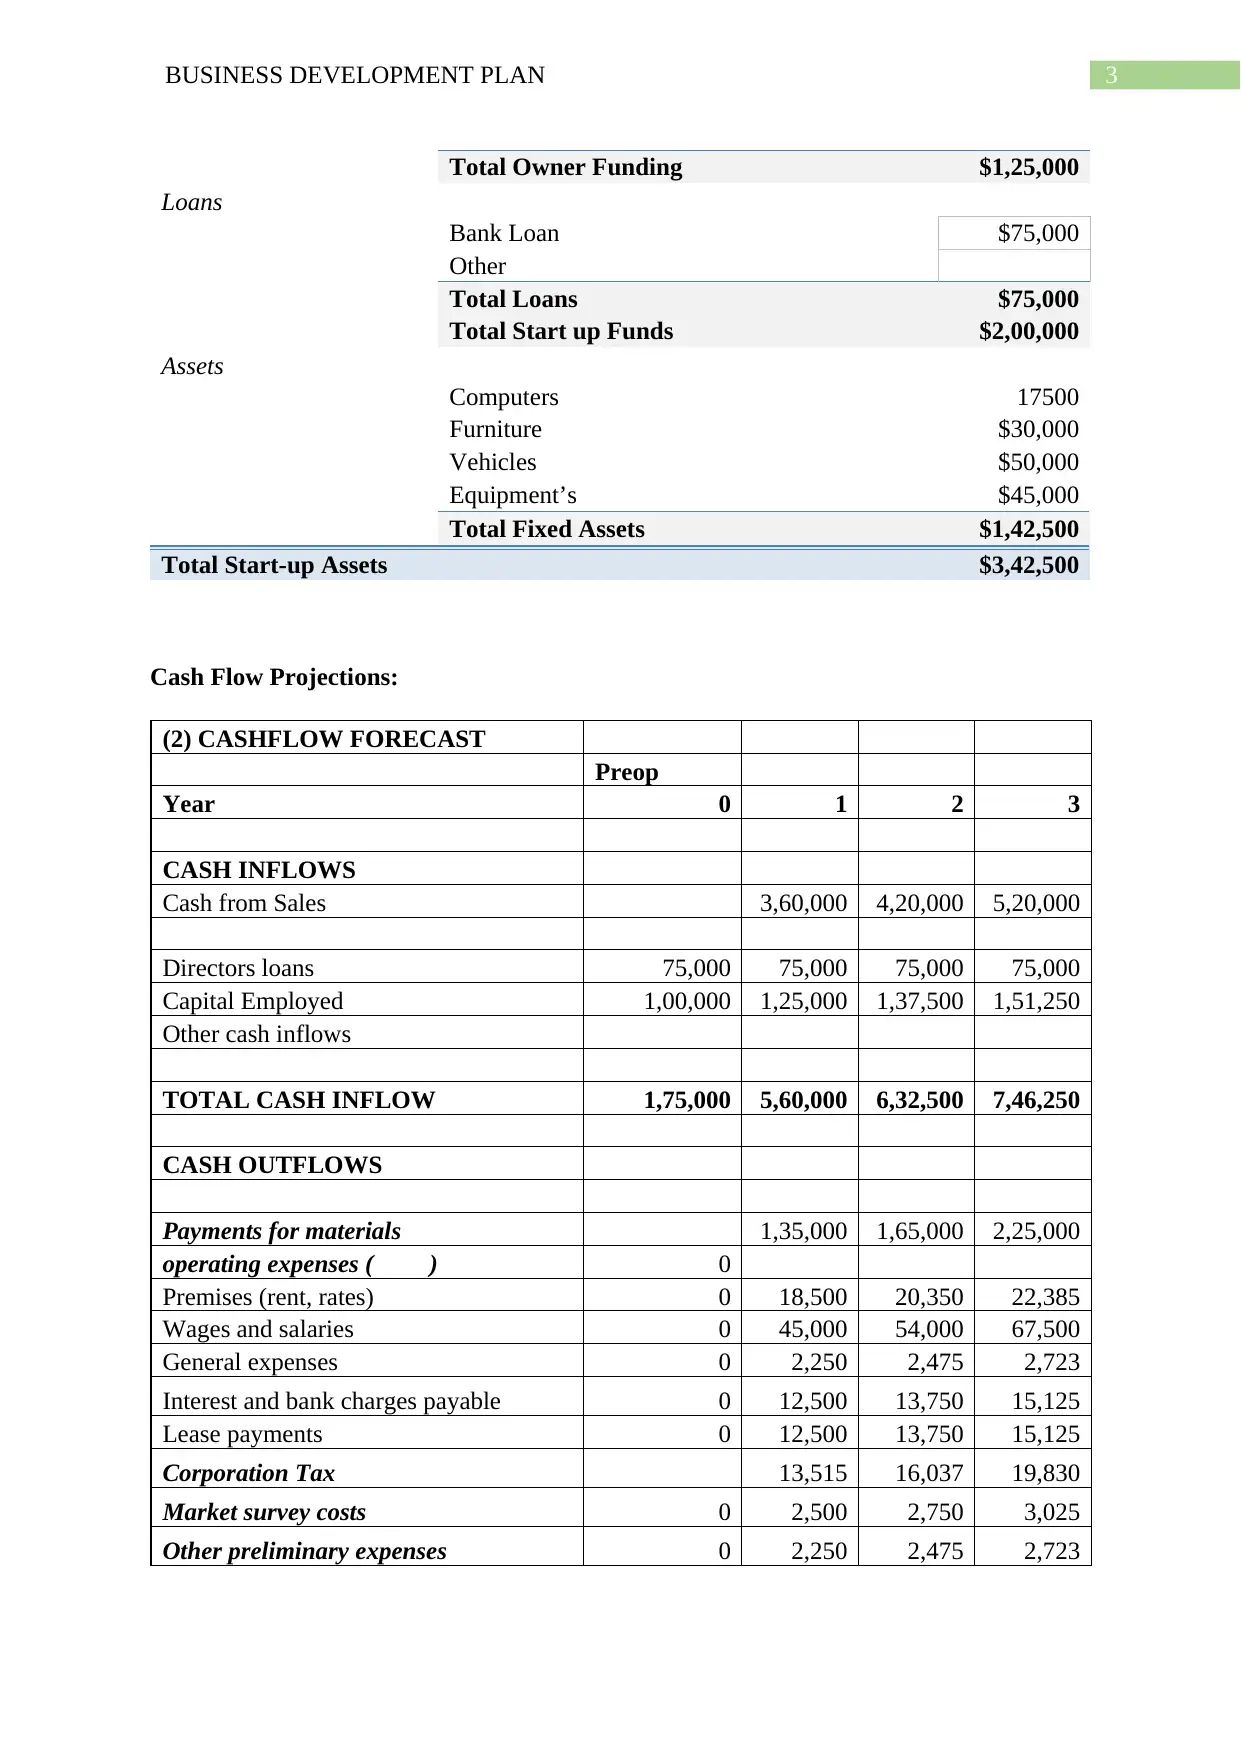
Total Owner Funding $1,25,000
Loans
Bank Loan $75,000
Other
Total Loans $75,000
Total Start up Funds $2,00,000
Assets
Computers 17500
Furniture $30,000
Vehicles $50,000
Equipment’s $45,000
Total Fixed Assets $1,42,500
Total Start-up Assets $3,42,500
Cash Flow Projections:
(2) CASHFLOW FORECAST
Preop
Year 0 1 2 3
CASH INFLOWS
Cash from Sales 3,60,000 4,20,000 5,20,000
Directors loans 75,000 75,000 75,000 75,000
Capital Employed 1,00,000 1,25,000 1,37,500 1,51,250
Other cash inflows
TOTAL CASH INFLOW 1,75,000 5,60,000 6,32,500 7,46,250
CASH OUTFLOWS
Payments for materials 1,35,000 1,65,000 2,25,000
operating expenses ( ) 0
Premises (rent, rates) 0 18,500 20,350 22,385
Wages and salaries 0 45,000 54,000 67,500
General expenses 0 2,250 2,475 2,723
Interest and bank charges payable 0 12,500 13,750 15,125
Lease payments 0 12,500 13,750 15,125
Corporation Tax 13,515 16,037 19,830
Market survey costs 0 2,500 2,750 3,025
Other preliminary expenses 0 2,250 2,475 2,723
Paraphrase This Document
Need a fresh take? Get an instant paraphrase of this document with our AI Paraphraser
4BUSINESS DEVELOPMENT PLAN
capital expenditure
Plant and other capital expenditure 0 1,42,500 1,42,500 1,42,500
financing repayments
Loan repayments 6,000 6,000
TOTAL CASH OUTFLOWS 0 3,86,515 4,39,087 5,21,935
Cash flow summary
NET CASHFLOW FOR PERIOD 1,75,000 1,73,485 1,93,414 2,24,315
OPENING CASH BALANCE 0 1,75,000 3,48,485 5,41,899
CLOSING CASH BALANCE 1,75,000 3,48,485 5,41,899 7,66,213
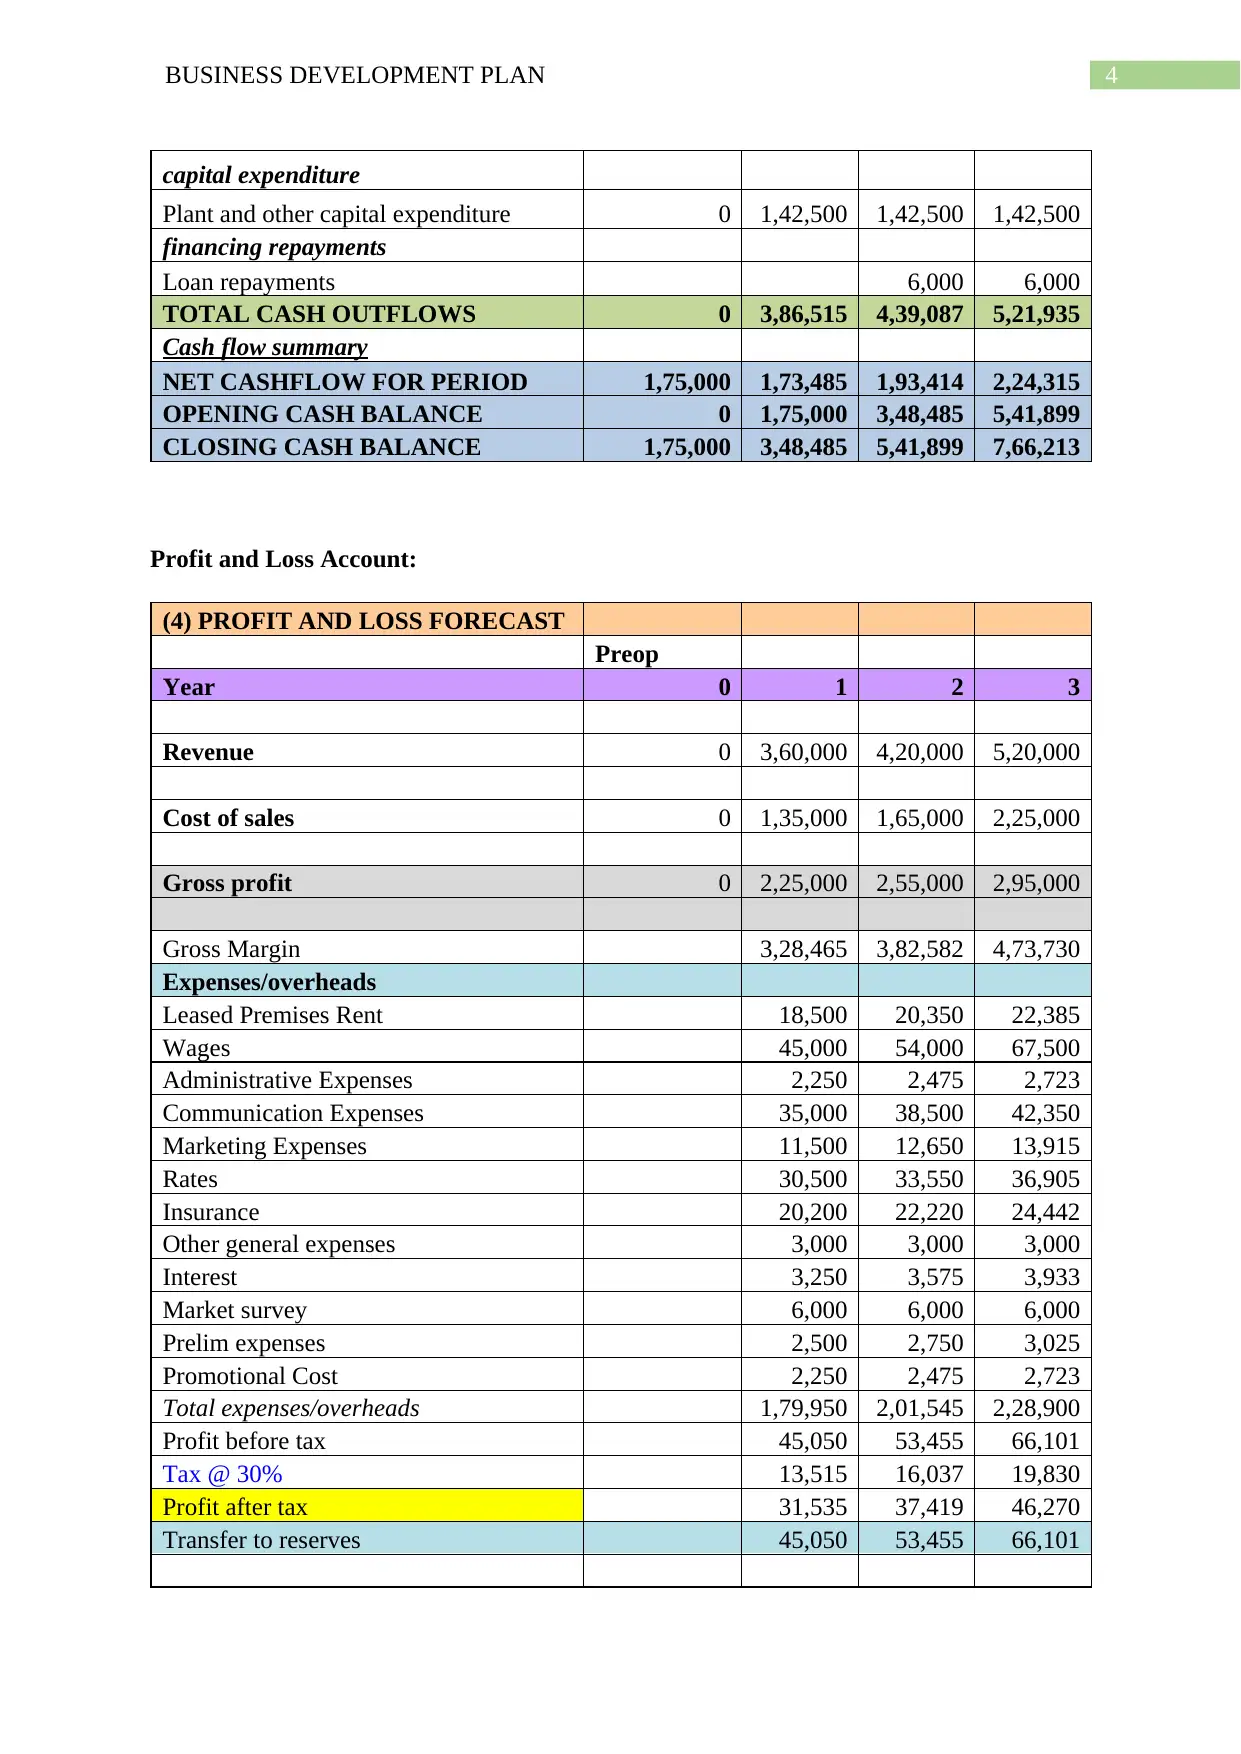
Profit and Loss Account:
(4) PROFIT AND LOSS FORECAST
Preop
Year 0 1 2 3
Revenue 0 3,60,000 4,20,000 5,20,000
Cost of sales 0 1,35,000 1,65,000 2,25,000
Gross profit 0 2,25,000 2,55,000 2,95,000
Gross Margin 3,28,465 3,82,582 4,73,730
Expenses/overheads
Leased Premises Rent 18,500 20,350 22,385
Wages 45,000 54,000 67,500
Administrative Expenses 2,250 2,475 2,723
Communication Expenses 35,000 38,500 42,350
Marketing Expenses 11,500 12,650 13,915
Rates 30,500 33,550 36,905
Insurance 20,200 22,220 24,442
Other general expenses 3,000 3,000 3,000
Interest 3,250 3,575 3,933
Market survey 6,000 6,000 6,000
Prelim expenses 2,500 2,750 3,025
Promotional Cost 2,250 2,475 2,723
Total expenses/overheads 1,79,950 2,01,545 2,28,900
Profit before tax 45,050 53,455 66,101
Tax @ 30% 13,515 16,037 19,830
Profit after tax 31,535 37,419 46,270
Transfer to reserves 45,050 53,455 66,101
capital expenditure
Plant and other capital expenditure 0 1,42,500 1,42,500 1,42,500
financing repayments
Loan repayments 6,000 6,000
TOTAL CASH OUTFLOWS 0 3,86,515 4,39,087 5,21,935
Cash flow summary
NET CASHFLOW FOR PERIOD 1,75,000 1,73,485 1,93,414 2,24,315
OPENING CASH BALANCE 0 1,75,000 3,48,485 5,41,899
CLOSING CASH BALANCE 1,75,000 3,48,485 5,41,899 7,66,213
Profit and Loss Account:
(4) PROFIT AND LOSS FORECAST
Preop
Year 0 1 2 3
Revenue 0 3,60,000 4,20,000 5,20,000
Cost of sales 0 1,35,000 1,65,000 2,25,000
Gross profit 0 2,25,000 2,55,000 2,95,000
Gross Margin 3,28,465 3,82,582 4,73,730
Expenses/overheads
Leased Premises Rent 18,500 20,350 22,385
Wages 45,000 54,000 67,500
Administrative Expenses 2,250 2,475 2,723
Communication Expenses 35,000 38,500 42,350
Marketing Expenses 11,500 12,650 13,915
Rates 30,500 33,550 36,905
Insurance 20,200 22,220 24,442
Other general expenses 3,000 3,000 3,000
Interest 3,250 3,575 3,933
Market survey 6,000 6,000 6,000
Prelim expenses 2,500 2,750 3,025
Promotional Cost 2,250 2,475 2,723
Total expenses/overheads 1,79,950 2,01,545 2,28,900
Profit before tax 45,050 53,455 66,101
Tax @ 30% 13,515 16,037 19,830
Profit after tax 31,535 37,419 46,270
Transfer to reserves 45,050 53,455 66,101
5BUSINESS DEVELOPMENT PLAN
ROC 32% 30% 34%
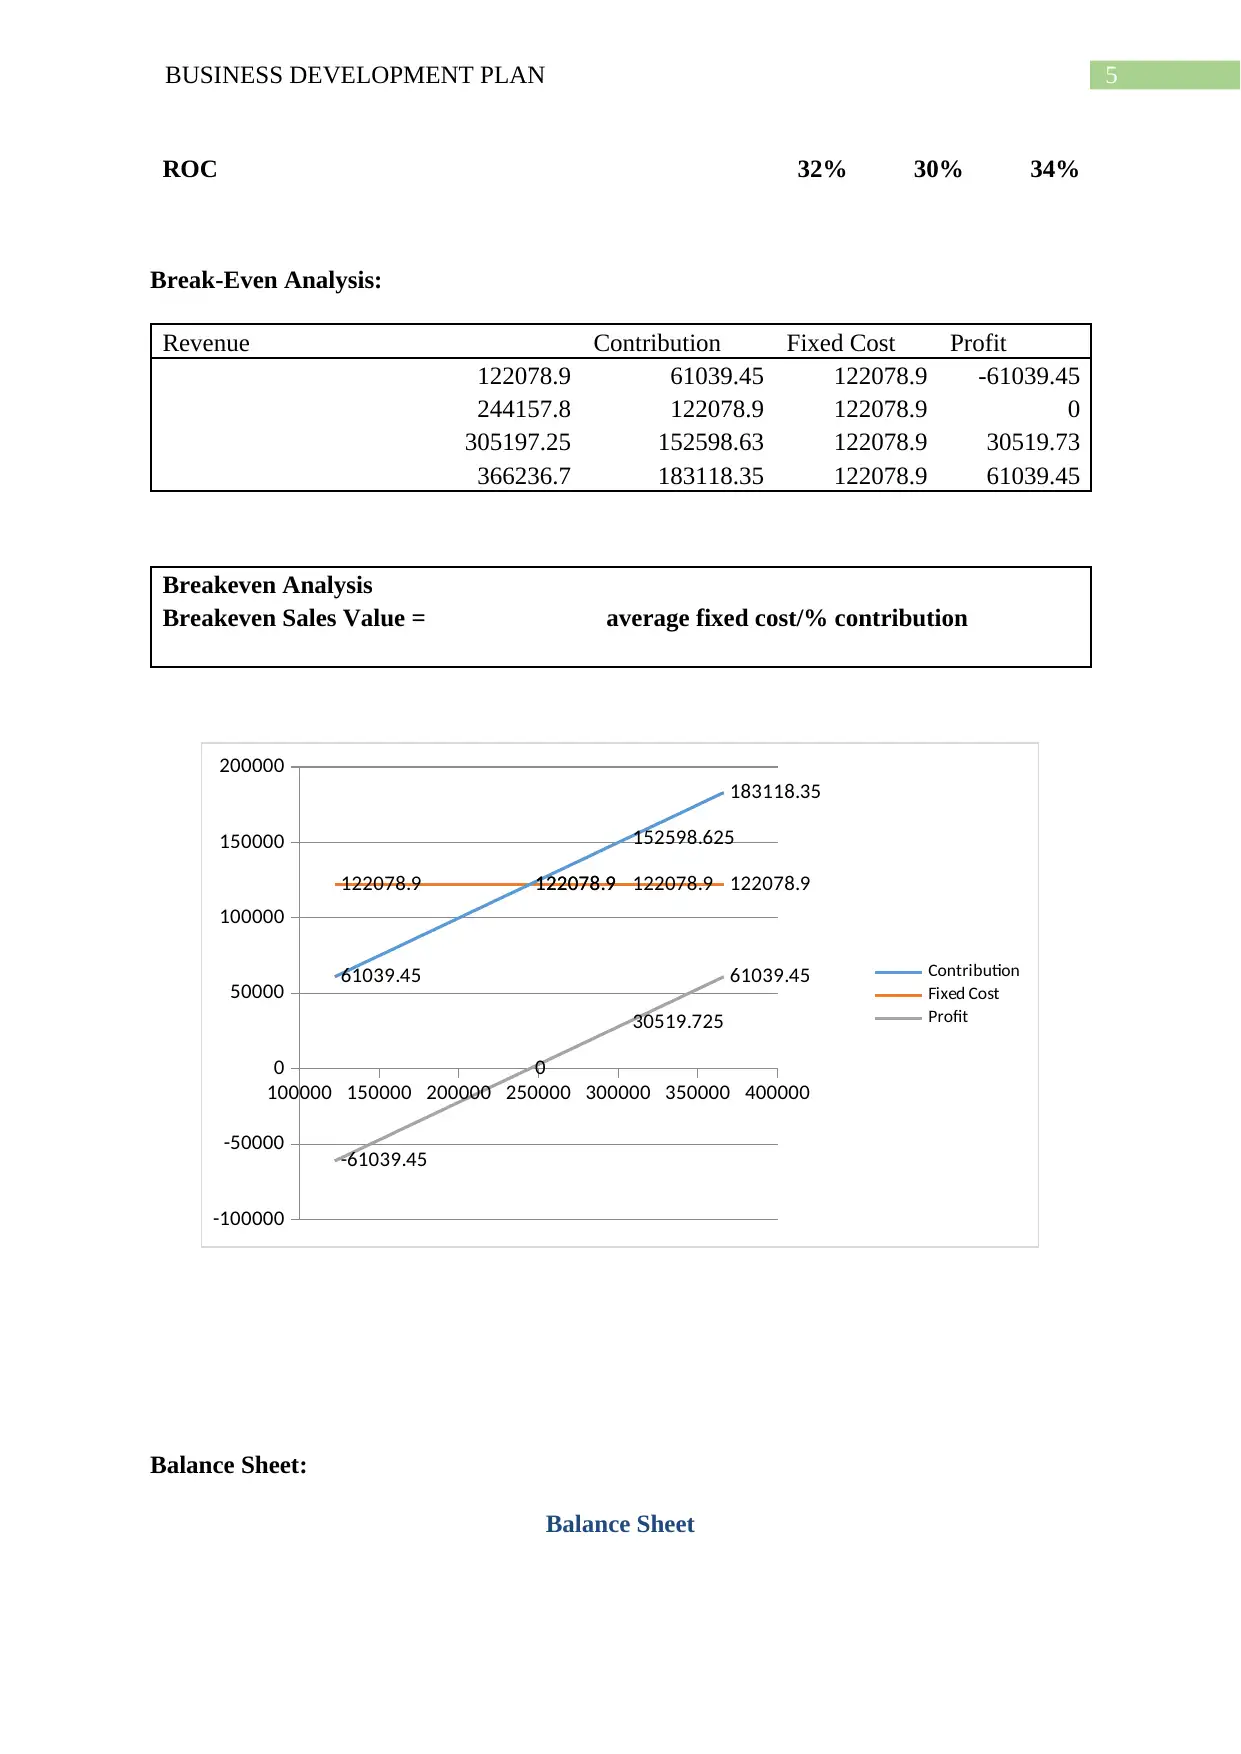
Break-Even Analysis:
Revenue Contribution Fixed Cost Profit
122078.9 61039.45 122078.9 -61039.45
244157.8 122078.9 122078.9 0
305197.25 152598.63 122078.9 30519.73
366236.7 183118.35 122078.9 61039.45
Breakeven Analysis
Breakeven Sales Value = average fixed cost/% contribution
100000 150000 200000 250000 300000 350000 400000
-100000
-50000
0
50000
100000
150000
200000
-61039.45
0
30519.725
61039.45
122078.9 122078.9 122078.9 122078.9
61039.45
122078.9
152598.625
183118.35
Contribution
Fixed Cost
Profit
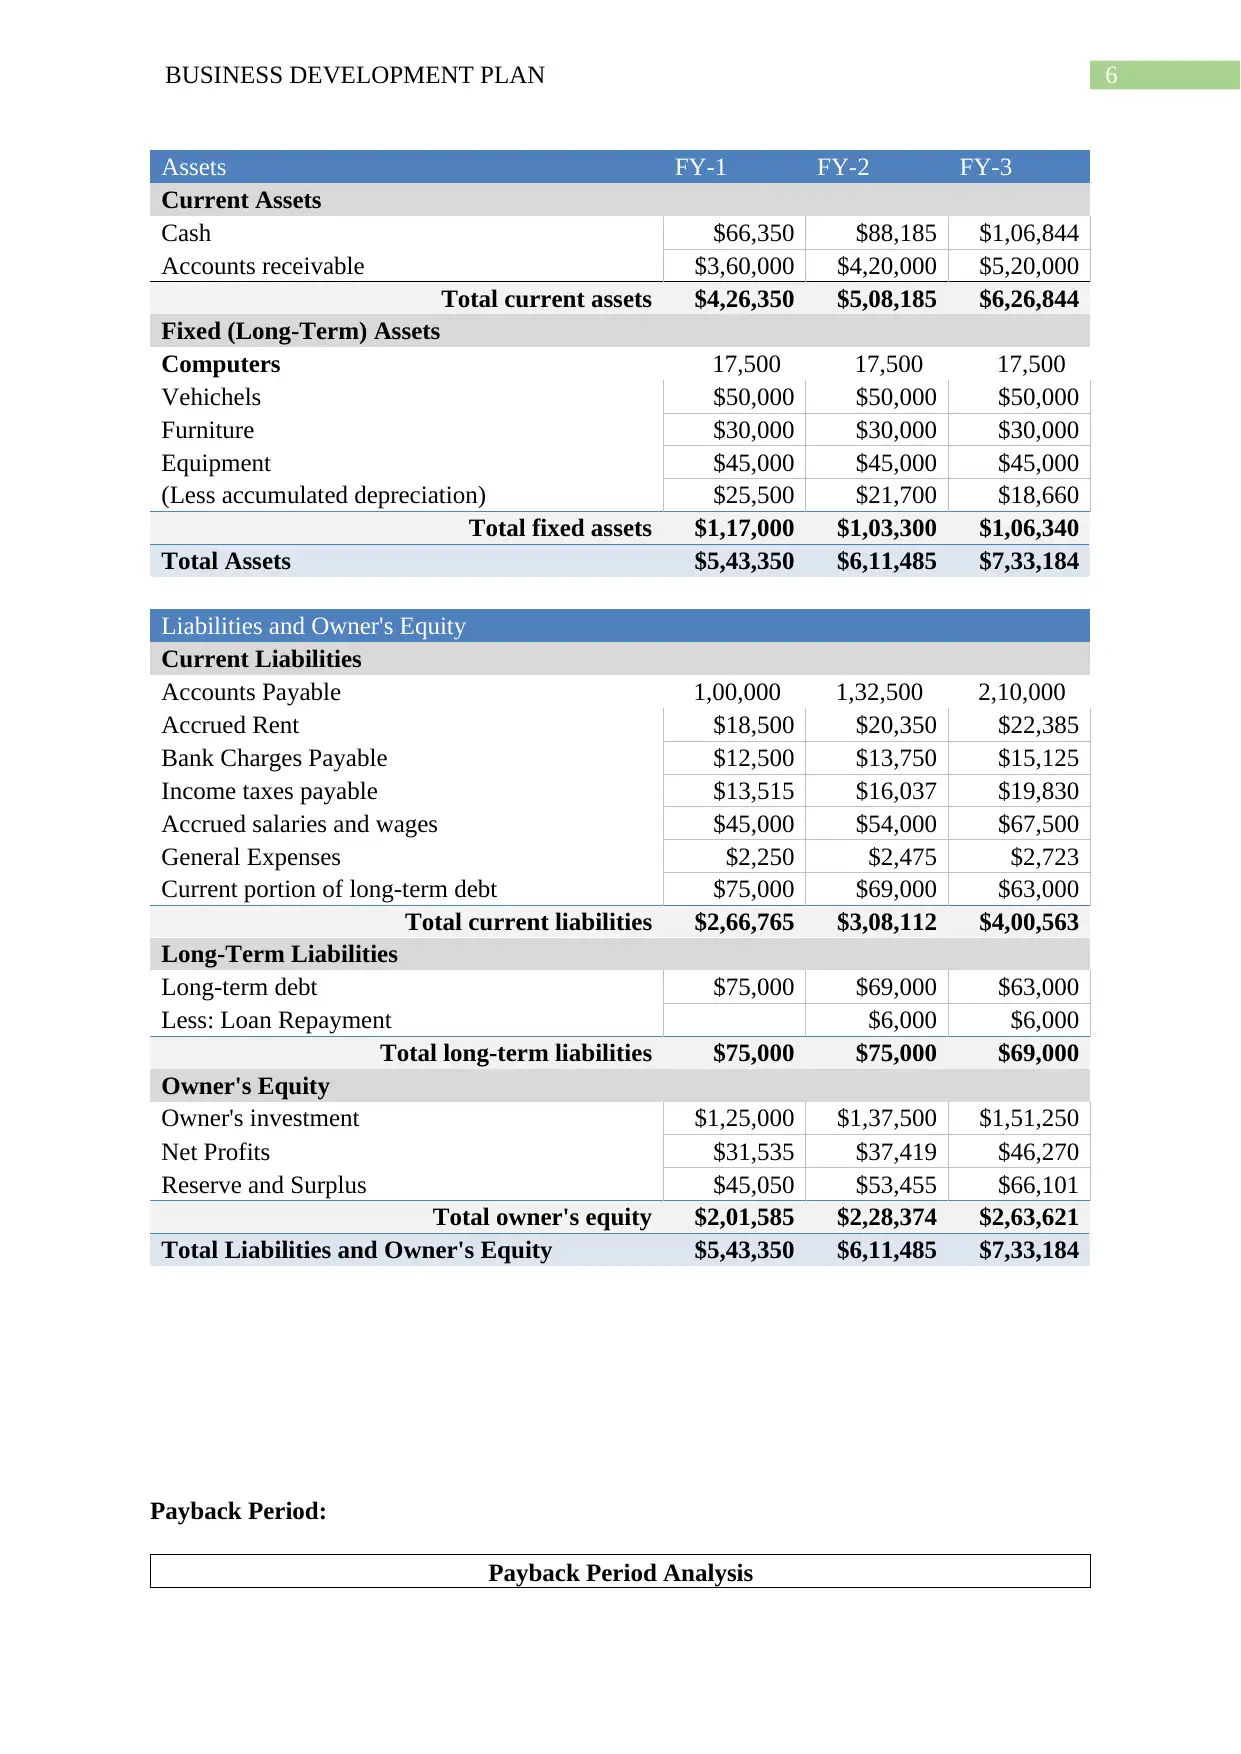
Balance Sheet:
Balance Sheet
ROC 32% 30% 34%
Break-Even Analysis:
Revenue Contribution Fixed Cost Profit
122078.9 61039.45 122078.9 -61039.45
244157.8 122078.9 122078.9 0
305197.25 152598.63 122078.9 30519.73
366236.7 183118.35 122078.9 61039.45
Breakeven Analysis
Breakeven Sales Value = average fixed cost/% contribution
100000 150000 200000 250000 300000 350000 400000
-100000
-50000
0
50000
100000
150000
200000
-61039.45
0
30519.725
61039.45
122078.9 122078.9 122078.9 122078.9
61039.45
122078.9
152598.625
183118.35
Contribution
Fixed Cost
Profit
Balance Sheet:
Balance Sheet
⊘ This is a preview!⊘
Do you want full access?
Subscribe today to unlock all pages.
Trusted by 1+ million students worldwide
6BUSINESS DEVELOPMENT PLAN
Assets FY-1 FY-2 FY-3
Current Assets
Cash $66,350 $88,185 $1,06,844
Accounts receivable $3,60,000 $4,20,000 $5,20,000
Total current assets $4,26,350 $5,08,185 $6,26,844
Fixed (Long-Term) Assets
Computers 17,500 17,500 17,500
Vehichels $50,000 $50,000 $50,000
Furniture $30,000 $30,000 $30,000
Equipment $45,000 $45,000 $45,000
(Less accumulated depreciation) $25,500 $21,700 $18,660
Total fixed assets $1,17,000 $1,03,300 $1,06,340
Total Assets $5,43,350 $6,11,485 $7,33,184
Liabilities and Owner's Equity
Current Liabilities
Accounts Payable 1,00,000 1,32,500 2,10,000
Accrued Rent $18,500 $20,350 $22,385
Bank Charges Payable $12,500 $13,750 $15,125
Income taxes payable $13,515 $16,037 $19,830
Accrued salaries and wages $45,000 $54,000 $67,500
General Expenses $2,250 $2,475 $2,723
Current portion of long-term debt $75,000 $69,000 $63,000
Total current liabilities $2,66,765 $3,08,112 $4,00,563
Long-Term Liabilities
Long-term debt $75,000 $69,000 $63,000
Less: Loan Repayment $6,000 $6,000
Total long-term liabilities $75,000 $75,000 $69,000
Owner's Equity
Owner's investment $1,25,000 $1,37,500 $1,51,250
Net Profits $31,535 $37,419 $46,270
Reserve and Surplus $45,050 $53,455 $66,101
Total owner's equity $2,01,585 $2,28,374 $2,63,621
Total Liabilities and Owner's Equity $5,43,350 $6,11,485 $7,33,184
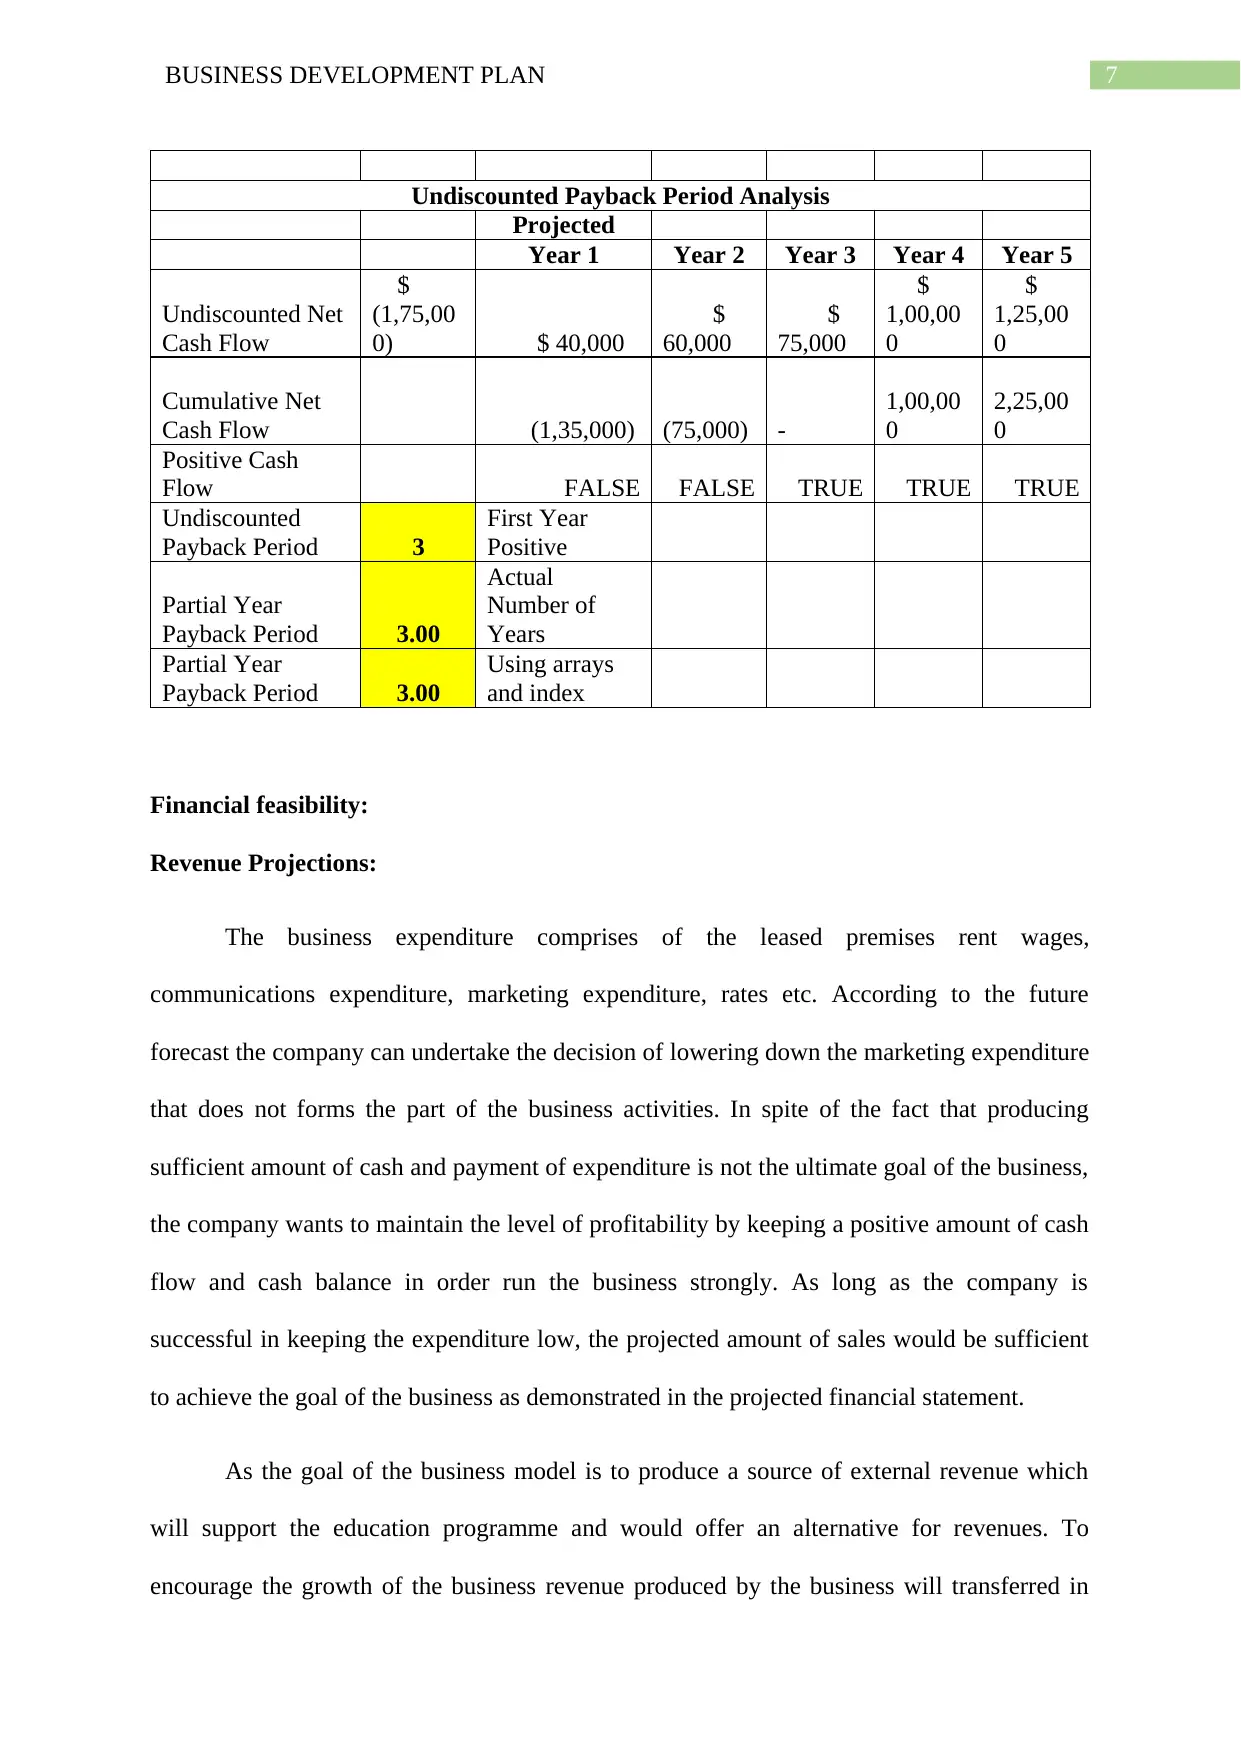
Payback Period:
Payback Period Analysis
Assets FY-1 FY-2 FY-3
Current Assets
Cash $66,350 $88,185 $1,06,844
Accounts receivable $3,60,000 $4,20,000 $5,20,000
Total current assets $4,26,350 $5,08,185 $6,26,844
Fixed (Long-Term) Assets
Computers 17,500 17,500 17,500
Vehichels $50,000 $50,000 $50,000
Furniture $30,000 $30,000 $30,000
Equipment $45,000 $45,000 $45,000
(Less accumulated depreciation) $25,500 $21,700 $18,660
Total fixed assets $1,17,000 $1,03,300 $1,06,340
Total Assets $5,43,350 $6,11,485 $7,33,184
Liabilities and Owner's Equity
Current Liabilities
Accounts Payable 1,00,000 1,32,500 2,10,000
Accrued Rent $18,500 $20,350 $22,385
Bank Charges Payable $12,500 $13,750 $15,125
Income taxes payable $13,515 $16,037 $19,830
Accrued salaries and wages $45,000 $54,000 $67,500
General Expenses $2,250 $2,475 $2,723
Current portion of long-term debt $75,000 $69,000 $63,000
Total current liabilities $2,66,765 $3,08,112 $4,00,563
Long-Term Liabilities
Long-term debt $75,000 $69,000 $63,000
Less: Loan Repayment $6,000 $6,000
Total long-term liabilities $75,000 $75,000 $69,000
Owner's Equity
Owner's investment $1,25,000 $1,37,500 $1,51,250
Net Profits $31,535 $37,419 $46,270
Reserve and Surplus $45,050 $53,455 $66,101
Total owner's equity $2,01,585 $2,28,374 $2,63,621
Total Liabilities and Owner's Equity $5,43,350 $6,11,485 $7,33,184
Payback Period:
Payback Period Analysis
Paraphrase This Document
Need a fresh take? Get an instant paraphrase of this document with our AI Paraphraser
7BUSINESS DEVELOPMENT PLAN
Undiscounted Payback Period Analysis
Projected
Year 1 Year 2 Year 3 Year 4 Year 5
Undiscounted Net
Cash Flow
$
(1,75,00
0) $ 40,000
$
60,000
$
75,000
$
1,00,00
0
$
1,25,00
0
Cumulative Net
Cash Flow (1,35,000) (75,000) -
1,00,00
0
2,25,00
0
Positive Cash
Flow FALSE FALSE TRUE TRUE TRUE
Undiscounted
Payback Period 3
First Year
Positive
Partial Year
Payback Period 3.00
Actual
Number of
Years
Partial Year
Payback Period 3.00
Using arrays
and index
Financial feasibility:
Revenue Projections:
The business expenditure comprises of the leased premises rent wages,
communications expenditure, marketing expenditure, rates etc. According to the future
forecast the company can undertake the decision of lowering down the marketing expenditure
that does not forms the part of the business activities. In spite of the fact that producing
sufficient amount of cash and payment of expenditure is not the ultimate goal of the business,
the company wants to maintain the level of profitability by keeping a positive amount of cash
flow and cash balance in order run the business strongly. As long as the company is
successful in keeping the expenditure low, the projected amount of sales would be sufficient
to achieve the goal of the business as demonstrated in the projected financial statement.
As the goal of the business model is to produce a source of external revenue which
will support the education programme and would offer an alternative for revenues. To
encourage the growth of the business revenue produced by the business will transferred in
8BUSINESS DEVELOPMENT PLAN
accordance with the agreement between the business owners to the general reserve of the
business.
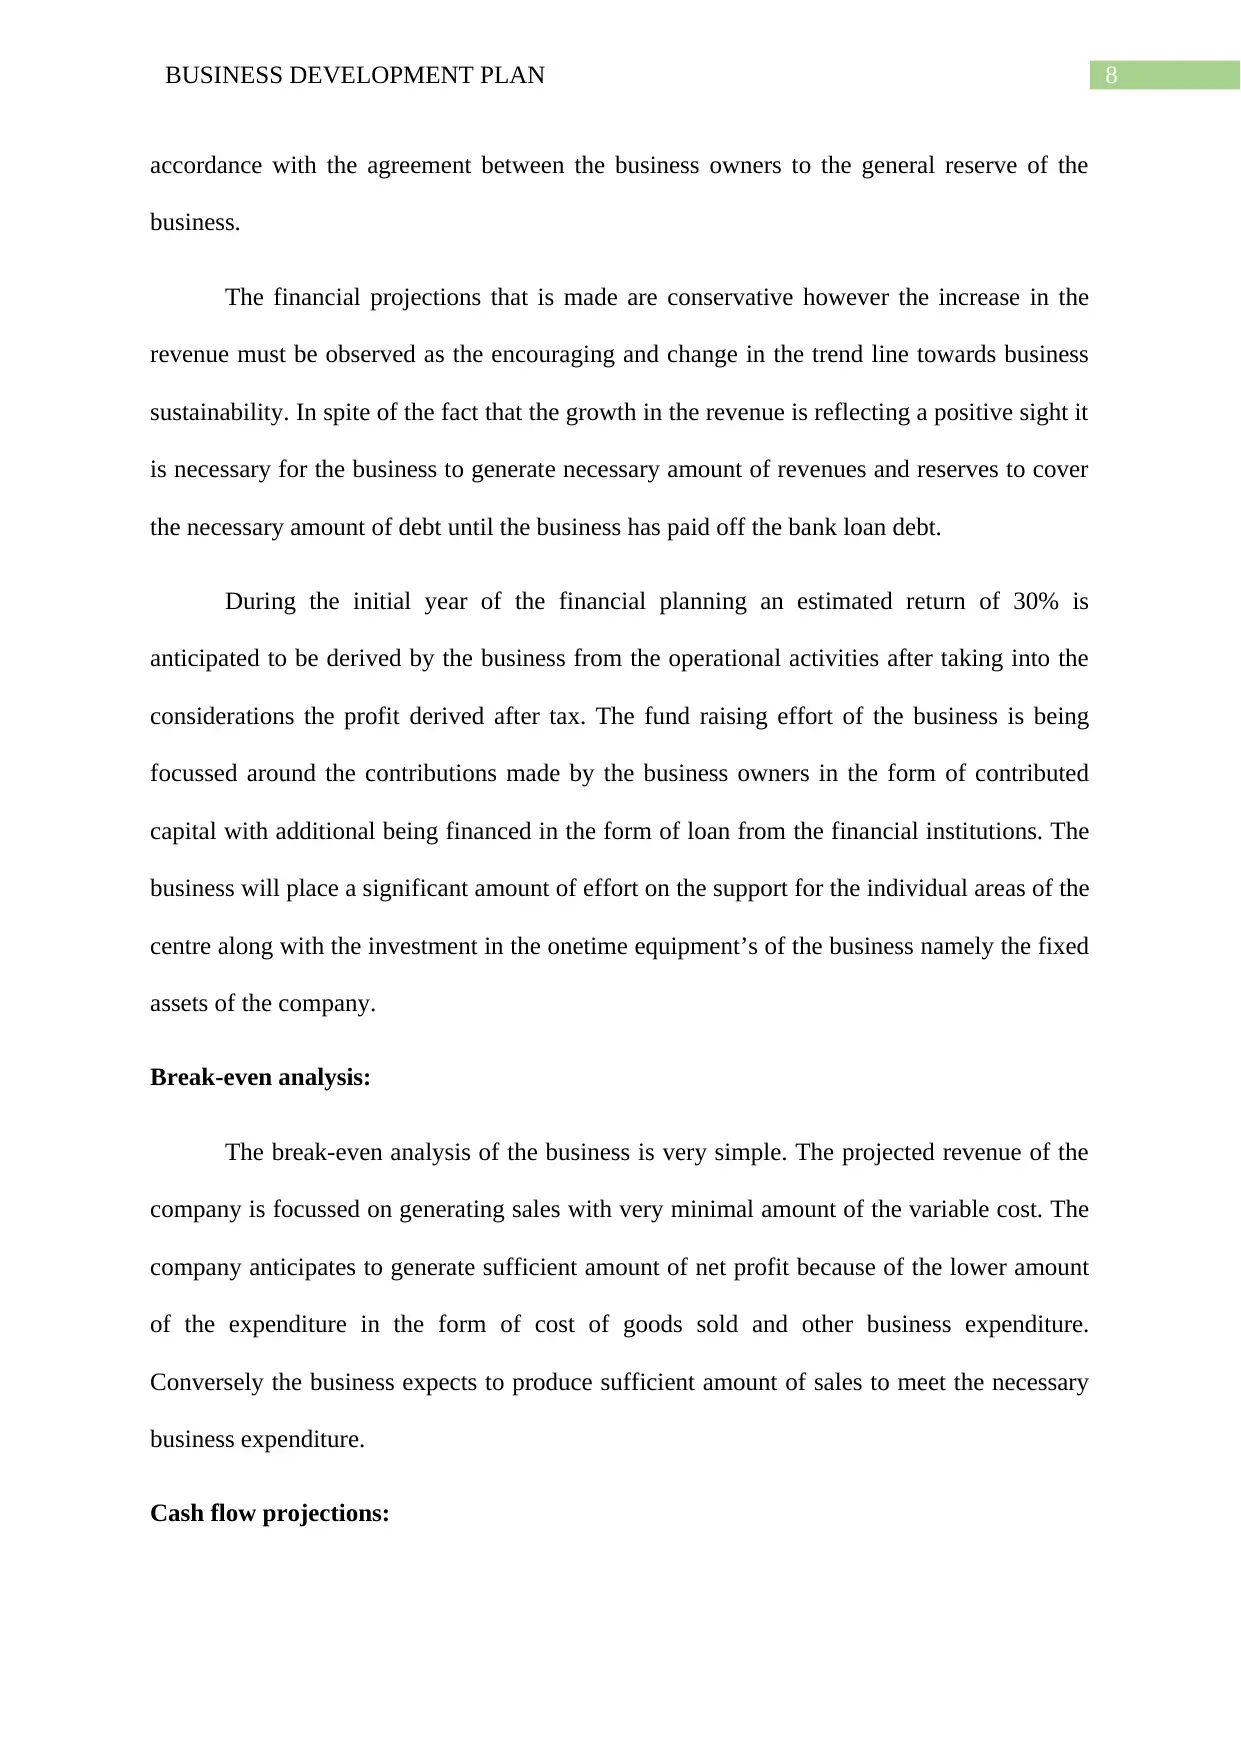
The financial projections that is made are conservative however the increase in the
revenue must be observed as the encouraging and change in the trend line towards business
sustainability. In spite of the fact that the growth in the revenue is reflecting a positive sight it
is necessary for the business to generate necessary amount of revenues and reserves to cover
the necessary amount of debt until the business has paid off the bank loan debt.
During the initial year of the financial planning an estimated return of 30% is
anticipated to be derived by the business from the operational activities after taking into the
considerations the profit derived after tax. The fund raising effort of the business is being
focussed around the contributions made by the business owners in the form of contributed
capital with additional being financed in the form of loan from the financial institutions. The
business will place a significant amount of effort on the support for the individual areas of the
centre along with the investment in the onetime equipment’s of the business namely the fixed
assets of the company.
Break-even analysis:
The break-even analysis of the business is very simple. The projected revenue of the
company is focussed on generating sales with very minimal amount of the variable cost. The
company anticipates to generate sufficient amount of net profit because of the lower amount
of the expenditure in the form of cost of goods sold and other business expenditure.
Conversely the business expects to produce sufficient amount of sales to meet the necessary
business expenditure.
Cash flow projections:
accordance with the agreement between the business owners to the general reserve of the
business.
The financial projections that is made are conservative however the increase in the
revenue must be observed as the encouraging and change in the trend line towards business
sustainability. In spite of the fact that the growth in the revenue is reflecting a positive sight it
is necessary for the business to generate necessary amount of revenues and reserves to cover
the necessary amount of debt until the business has paid off the bank loan debt.
During the initial year of the financial planning an estimated return of 30% is
anticipated to be derived by the business from the operational activities after taking into the
considerations the profit derived after tax. The fund raising effort of the business is being
focussed around the contributions made by the business owners in the form of contributed
capital with additional being financed in the form of loan from the financial institutions. The
business will place a significant amount of effort on the support for the individual areas of the
centre along with the investment in the onetime equipment’s of the business namely the fixed
assets of the company.
Break-even analysis:
The break-even analysis of the business is very simple. The projected revenue of the
company is focussed on generating sales with very minimal amount of the variable cost. The
company anticipates to generate sufficient amount of net profit because of the lower amount
of the expenditure in the form of cost of goods sold and other business expenditure.
Conversely the business expects to produce sufficient amount of sales to meet the necessary
business expenditure.
Cash flow projections:
⊘ This is a preview!⊘
Do you want full access?
Subscribe today to unlock all pages.
Trusted by 1+ million students worldwide
9BUSINESS DEVELOPMENT PLAN
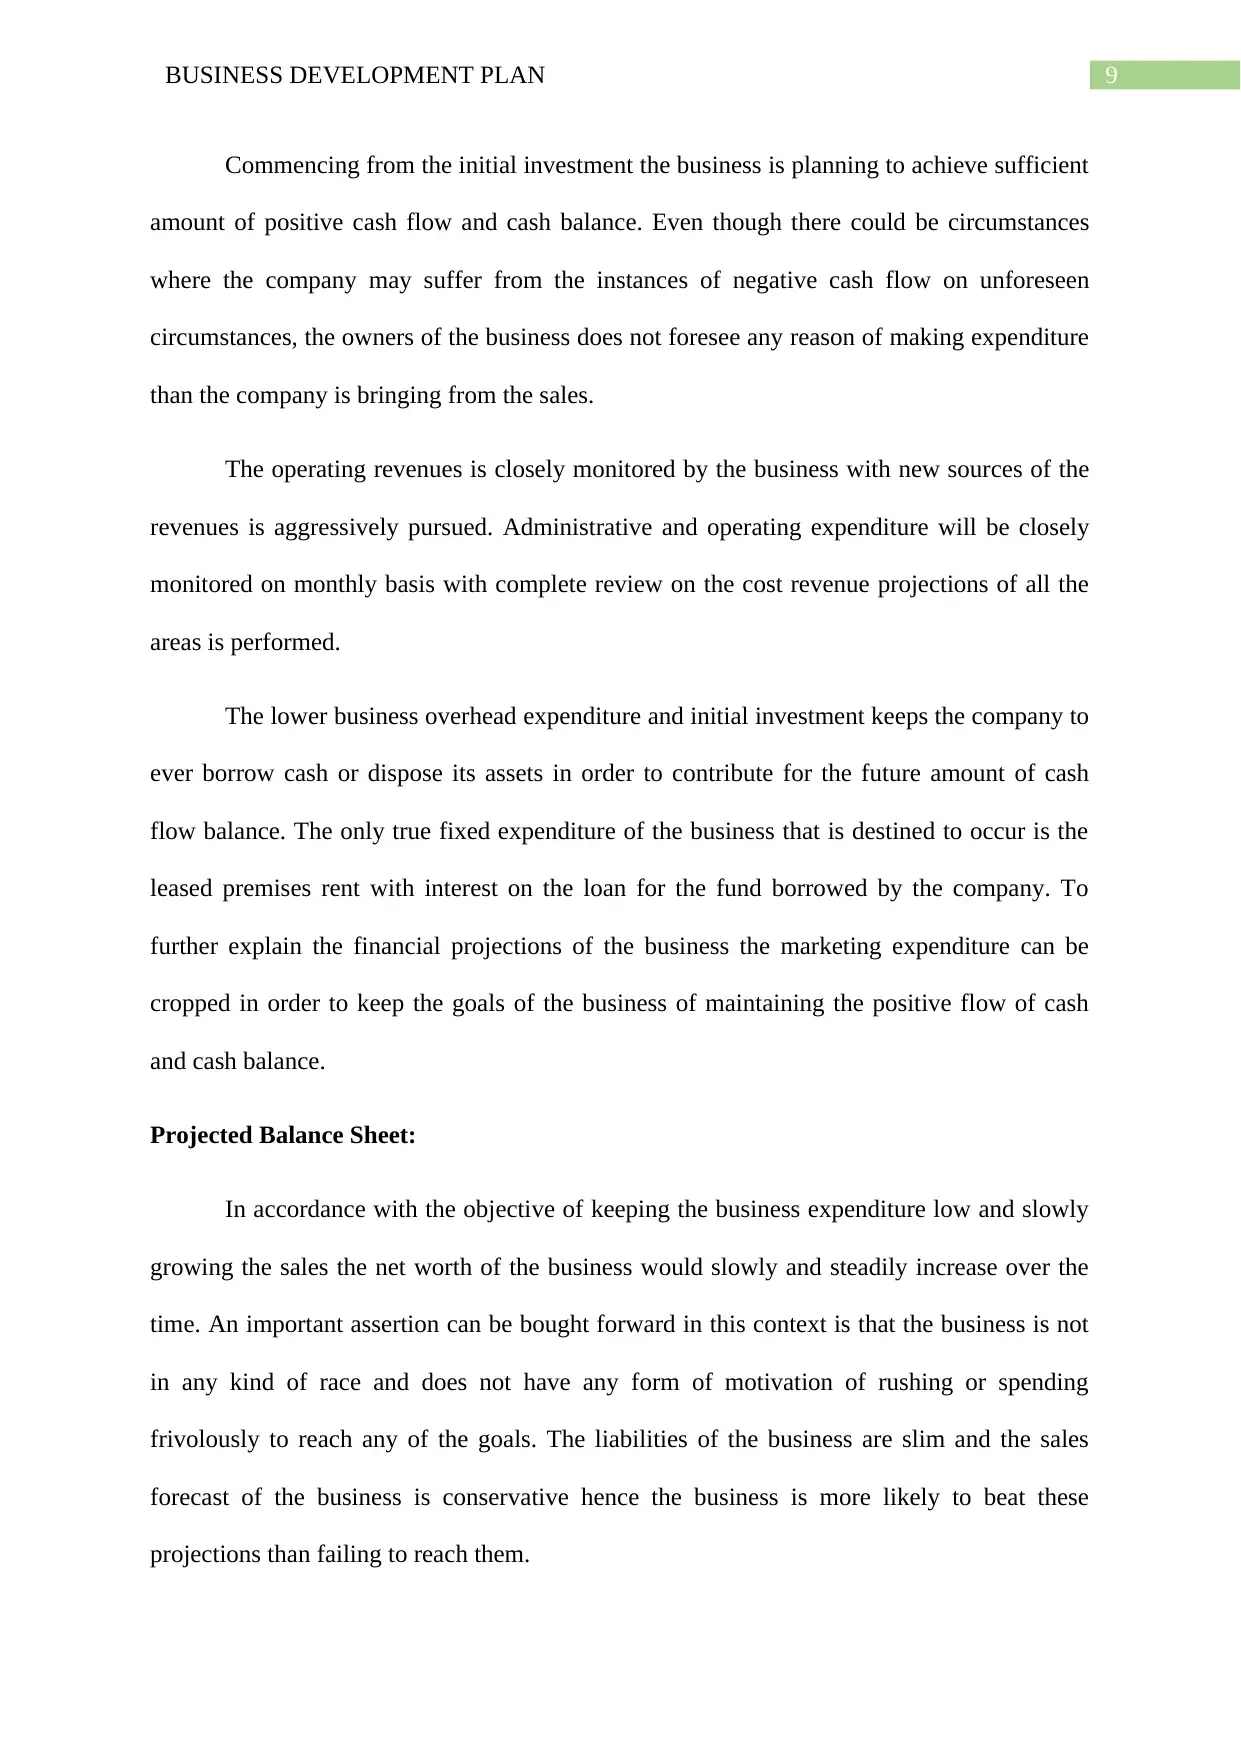
Commencing from the initial investment the business is planning to achieve sufficient
amount of positive cash flow and cash balance. Even though there could be circumstances
where the company may suffer from the instances of negative cash flow on unforeseen
circumstances, the owners of the business does not foresee any reason of making expenditure
than the company is bringing from the sales.
The operating revenues is closely monitored by the business with new sources of the
revenues is aggressively pursued. Administrative and operating expenditure will be closely
monitored on monthly basis with complete review on the cost revenue projections of all the
areas is performed.
The lower business overhead expenditure and initial investment keeps the company to
ever borrow cash or dispose its assets in order to contribute for the future amount of cash
flow balance. The only true fixed expenditure of the business that is destined to occur is the
leased premises rent with interest on the loan for the fund borrowed by the company. To
further explain the financial projections of the business the marketing expenditure can be
cropped in order to keep the goals of the business of maintaining the positive flow of cash
and cash balance.
Projected Balance Sheet:
In accordance with the objective of keeping the business expenditure low and slowly
growing the sales the net worth of the business would slowly and steadily increase over the
time. An important assertion can be bought forward in this context is that the business is not
in any kind of race and does not have any form of motivation of rushing or spending
frivolously to reach any of the goals. The liabilities of the business are slim and the sales
forecast of the business is conservative hence the business is more likely to beat these
projections than failing to reach them.
Paraphrase This Document
Need a fresh take? Get an instant paraphrase of this document with our AI Paraphraser

10BUSINESS DEVELOPMENT PLAN
11BUSINESS DEVELOPMENT PLAN
Bibliography List:
Christensen, T., Cottrell, D. and Baker, R., 2013. Advanced Financial Accounting. McGraw-
Hill.
Deegan, C., 2013. Financial accounting theory. McGraw-Hill Education Australia.
Edwards, J.R., 2013. A History of Financial Accounting (RLE Accounting) (Vol. 29).
Routledge.
Fleischmann, B., Meyr, H. and Wagner, M., 2015. Advanced planning. In Supply chain
management and advanced planning(pp. 71-95). Springer Berlin Heidelberg.
Hoskin, R.E., Fizzell, M.R. and Cherry, D.C., 2014. Financial Accounting: a user
perspective. Wiley Global Education.
Jeston, J. and Nelis, J., 2014. Business process management. Routledge.
Lederer, A.L., 2013. The Information Systems Planning Process Meeting the challenges of
information systems planning. Strategic Information Management, 216.
Macve, R., 2015. A Conceptual Framework for Financial Accounting and Reporting: Vision,
Tool, Or Threat?. Routledge.
Marshall, D., 2016. Accounting: What the numbers mean. McGraw-Hill Higher Education.
Mueller, C.B. and Naffziger, D.W., 2015. Strategic planning in small firms: Activity and
process realities. Journal of Small Business Strategy, 10(1), pp.78-85.
Weil, R.L., Schipper, K. and Francis, J., 2013. Financial accounting: an introduction to
concepts, methods and uses. Cengage Learning.
Wheelen, T.L. and Hunger, J.D., 2017. Strategic management and business policy. pearson.
⊘ This is a preview!⊘
Do you want full access?
Subscribe today to unlock all pages.
Trusted by 1+ million students worldwide
1 out of 13

Your All-in-One AI-Powered Toolkit for Academic Success.
+13062052269
info@desklib.com
Available 24*7 on WhatsApp / Email
![[object Object]](/_next/static/media/star-bottom.7253800d.svg)
Unlock your academic potential
Copyright © 2020–2026 A2Z Services. All Rights Reserved. Developed and managed by ZUCOL.