Introduction to Business Economics: Analysis of Markets Report
VerifiedAdded on 2022/10/01
|17
|3594
|246
Report
AI Summary
This report provides a comprehensive analysis of key concepts in business economics. Section B delves into microeconomics, examining the fluctuations in beef prices using supply and demand analysis, including factors influencing supply and demand, elasticity, and market dynamics. It also analyzes the kinked demand curve in oligopolistic markets, exploring price stickiness, assumptions, and real-world examples. Section C focuses on macroeconomics, explaining how the Bank of England uses monetary policy to control inflation, utilizing the money market model and discussing the monetary transmission mechanism. Furthermore, it analyzes the AD/AS model to explain how economic policymakers might respond to recessions, covering the effects of monetary and fiscal policies. The report also discusses the assumptions of the perfect competition model, providing insights into the short-run and long-run implications for firms and industries.

Running head: Introduction to business economics
Introduction to business economics
Name of the student
Course name
Course ID
Introduction to business economics
Name of the student
Course name
Course ID
Paraphrase This Document
Need a fresh take? Get an instant paraphrase of this document with our AI Paraphraser
1
Introduction to business economics
Table of Contents
1) Time Series............................................................................................................................3
2) Prices may remain sticky in an oligopolistic market.............................................................4
3) How and why the Bank of England uses monetary policy to control inflation.....................5
4. Using the AD/AS model, analyse how an economic policy maker might respond to a
recession.....................................................................................................................................6
5. Assumptions of the model of perfect competition.................................................................7
6. Oligopoly..............................................................................................................................10
7. Competitive equilibrium vs. market failure.........................................................................11
8. Circular flow of diagram......................................................................................................13
9. Monopoly.............................................................................................................................13
10. Taxing a Production Externality graph..............................................................................14
Reference list............................................................................................................................15
2
Introduction to business economics
Section B – Microeconomics
1) Time Series
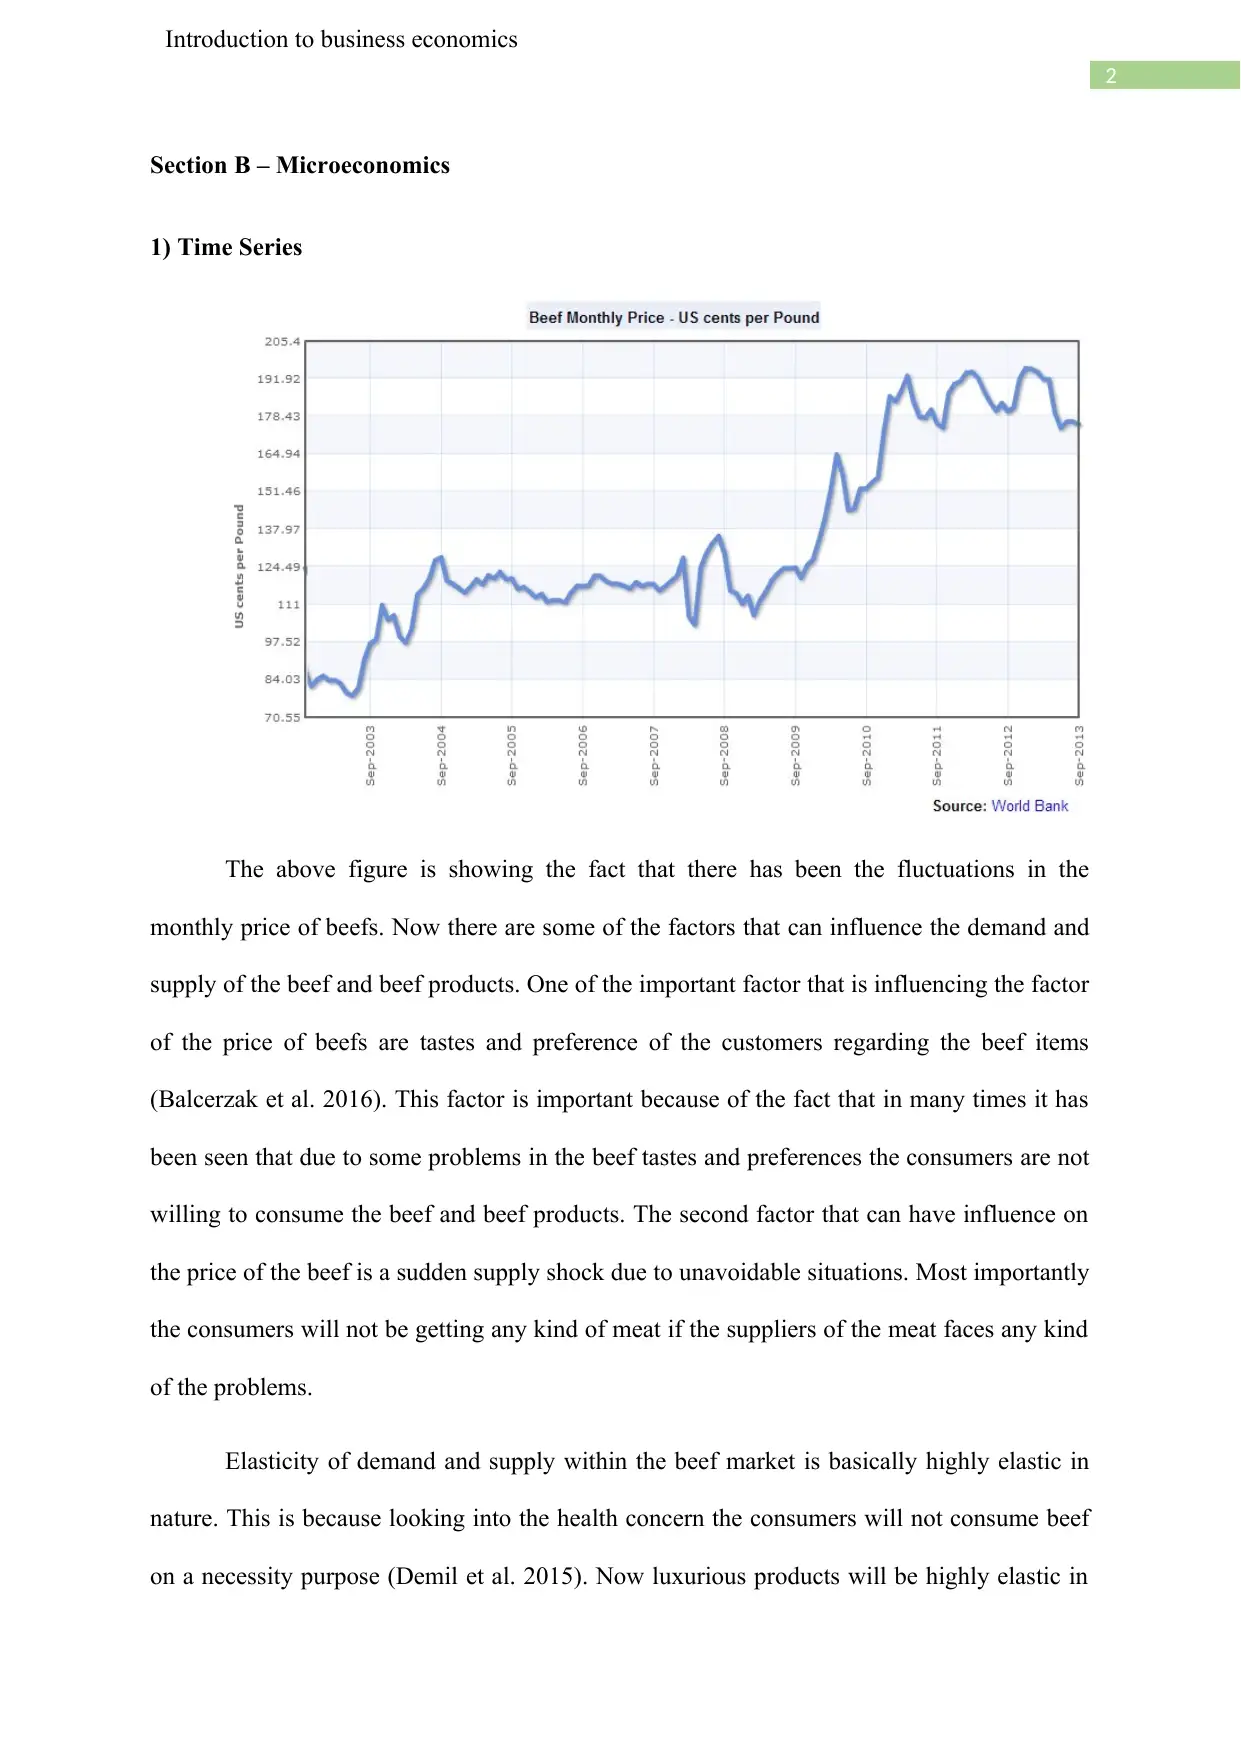
The above figure is showing the fact that there has been the fluctuations in the
monthly price of beefs. Now there are some of the factors that can influence the demand and
supply of the beef and beef products. One of the important factor that is influencing the factor
of the price of beefs are tastes and preference of the customers regarding the beef items
(Balcerzak et al. 2016). This factor is important because of the fact that in many times it has
been seen that due to some problems in the beef tastes and preferences the consumers are not
willing to consume the beef and beef products. The second factor that can have influence on
the price of the beef is a sudden supply shock due to unavoidable situations. Most importantly
the consumers will not be getting any kind of meat if the suppliers of the meat faces any kind
of the problems.
Elasticity of demand and supply within the beef market is basically highly elastic in
nature. This is because looking into the health concern the consumers will not consume beef
on a necessity purpose (Demil et al. 2015). Now luxurious products will be highly elastic in
Introduction to business economics
Section B – Microeconomics
1) Time Series
The above figure is showing the fact that there has been the fluctuations in the
monthly price of beefs. Now there are some of the factors that can influence the demand and
supply of the beef and beef products. One of the important factor that is influencing the factor
of the price of beefs are tastes and preference of the customers regarding the beef items
(Balcerzak et al. 2016). This factor is important because of the fact that in many times it has
been seen that due to some problems in the beef tastes and preferences the consumers are not
willing to consume the beef and beef products. The second factor that can have influence on
the price of the beef is a sudden supply shock due to unavoidable situations. Most importantly
the consumers will not be getting any kind of meat if the suppliers of the meat faces any kind
of the problems.
Elasticity of demand and supply within the beef market is basically highly elastic in
nature. This is because looking into the health concern the consumers will not consume beef
on a necessity purpose (Demil et al. 2015). Now luxurious products will be highly elastic in
⊘ This is a preview!⊘
Do you want full access?
Subscribe today to unlock all pages.
Trusted by 1+ million students worldwide
3
Introduction to business economics
supply and with one unit increase in the price will decrease the quantity demanded of the beef
meats. Through the incorporation of both demand and supply, the economic activities will
definitely increase the development of fluctuations. It is important for the producers to keep
the prices below the market equilibrium level in order to gain maximum level of the revenue.
2) Prices may remain sticky in an oligopolistic market
Figure 2: Kinked demand curve
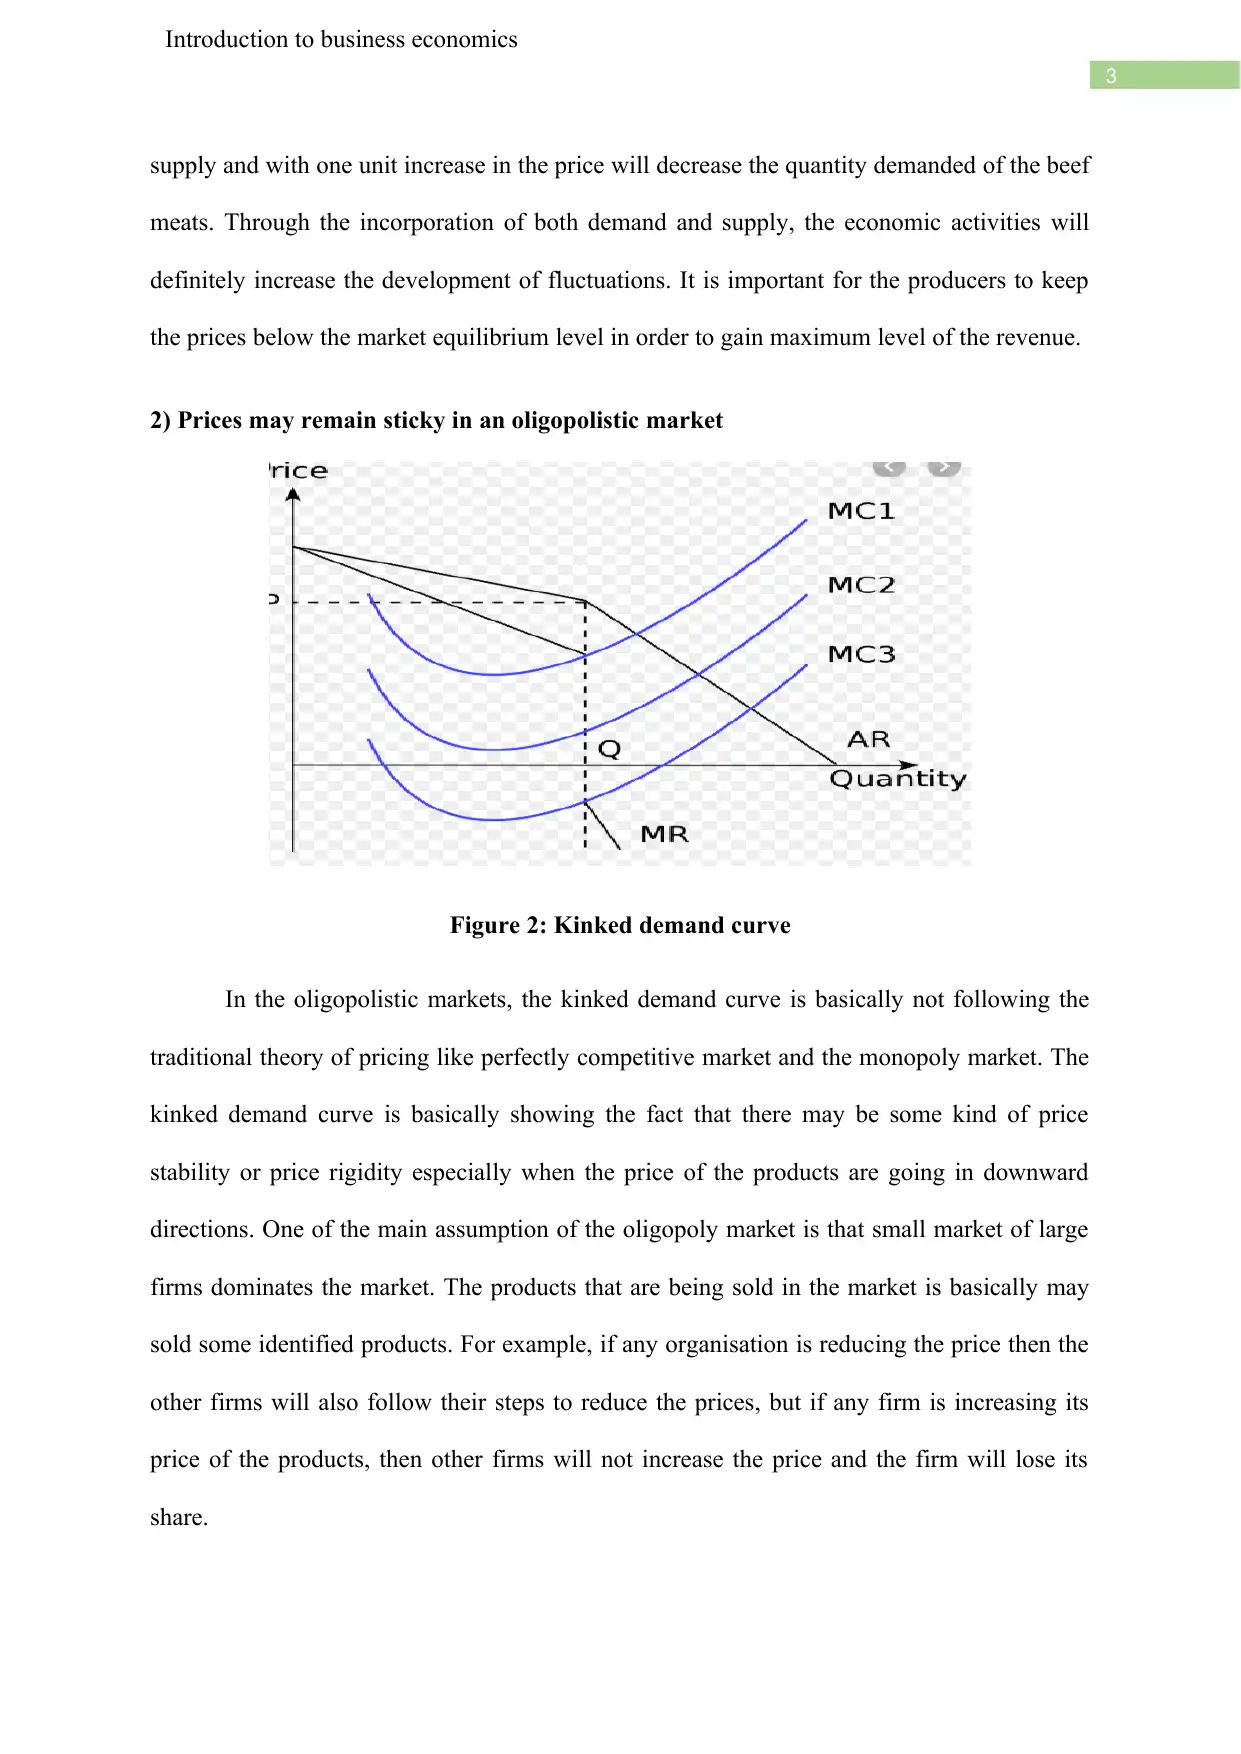
In the oligopolistic markets, the kinked demand curve is basically not following the
traditional theory of pricing like perfectly competitive market and the monopoly market. The
kinked demand curve is basically showing the fact that there may be some kind of price
stability or price rigidity especially when the price of the products are going in downward
directions. One of the main assumption of the oligopoly market is that small market of large
firms dominates the market. The products that are being sold in the market is basically may
sold some identified products. For example, if any organisation is reducing the price then the
other firms will also follow their steps to reduce the prices, but if any firm is increasing its
price of the products, then other firms will not increase the price and the firm will lose its
share.
Introduction to business economics
supply and with one unit increase in the price will decrease the quantity demanded of the beef
meats. Through the incorporation of both demand and supply, the economic activities will
definitely increase the development of fluctuations. It is important for the producers to keep
the prices below the market equilibrium level in order to gain maximum level of the revenue.
2) Prices may remain sticky in an oligopolistic market
Figure 2: Kinked demand curve
In the oligopolistic markets, the kinked demand curve is basically not following the
traditional theory of pricing like perfectly competitive market and the monopoly market. The
kinked demand curve is basically showing the fact that there may be some kind of price
stability or price rigidity especially when the price of the products are going in downward
directions. One of the main assumption of the oligopoly market is that small market of large
firms dominates the market. The products that are being sold in the market is basically may
sold some identified products. For example, if any organisation is reducing the price then the
other firms will also follow their steps to reduce the prices, but if any firm is increasing its
price of the products, then other firms will not increase the price and the firm will lose its
share.
Paraphrase This Document
Need a fresh take? Get an instant paraphrase of this document with our AI Paraphraser
4
Introduction to business economics
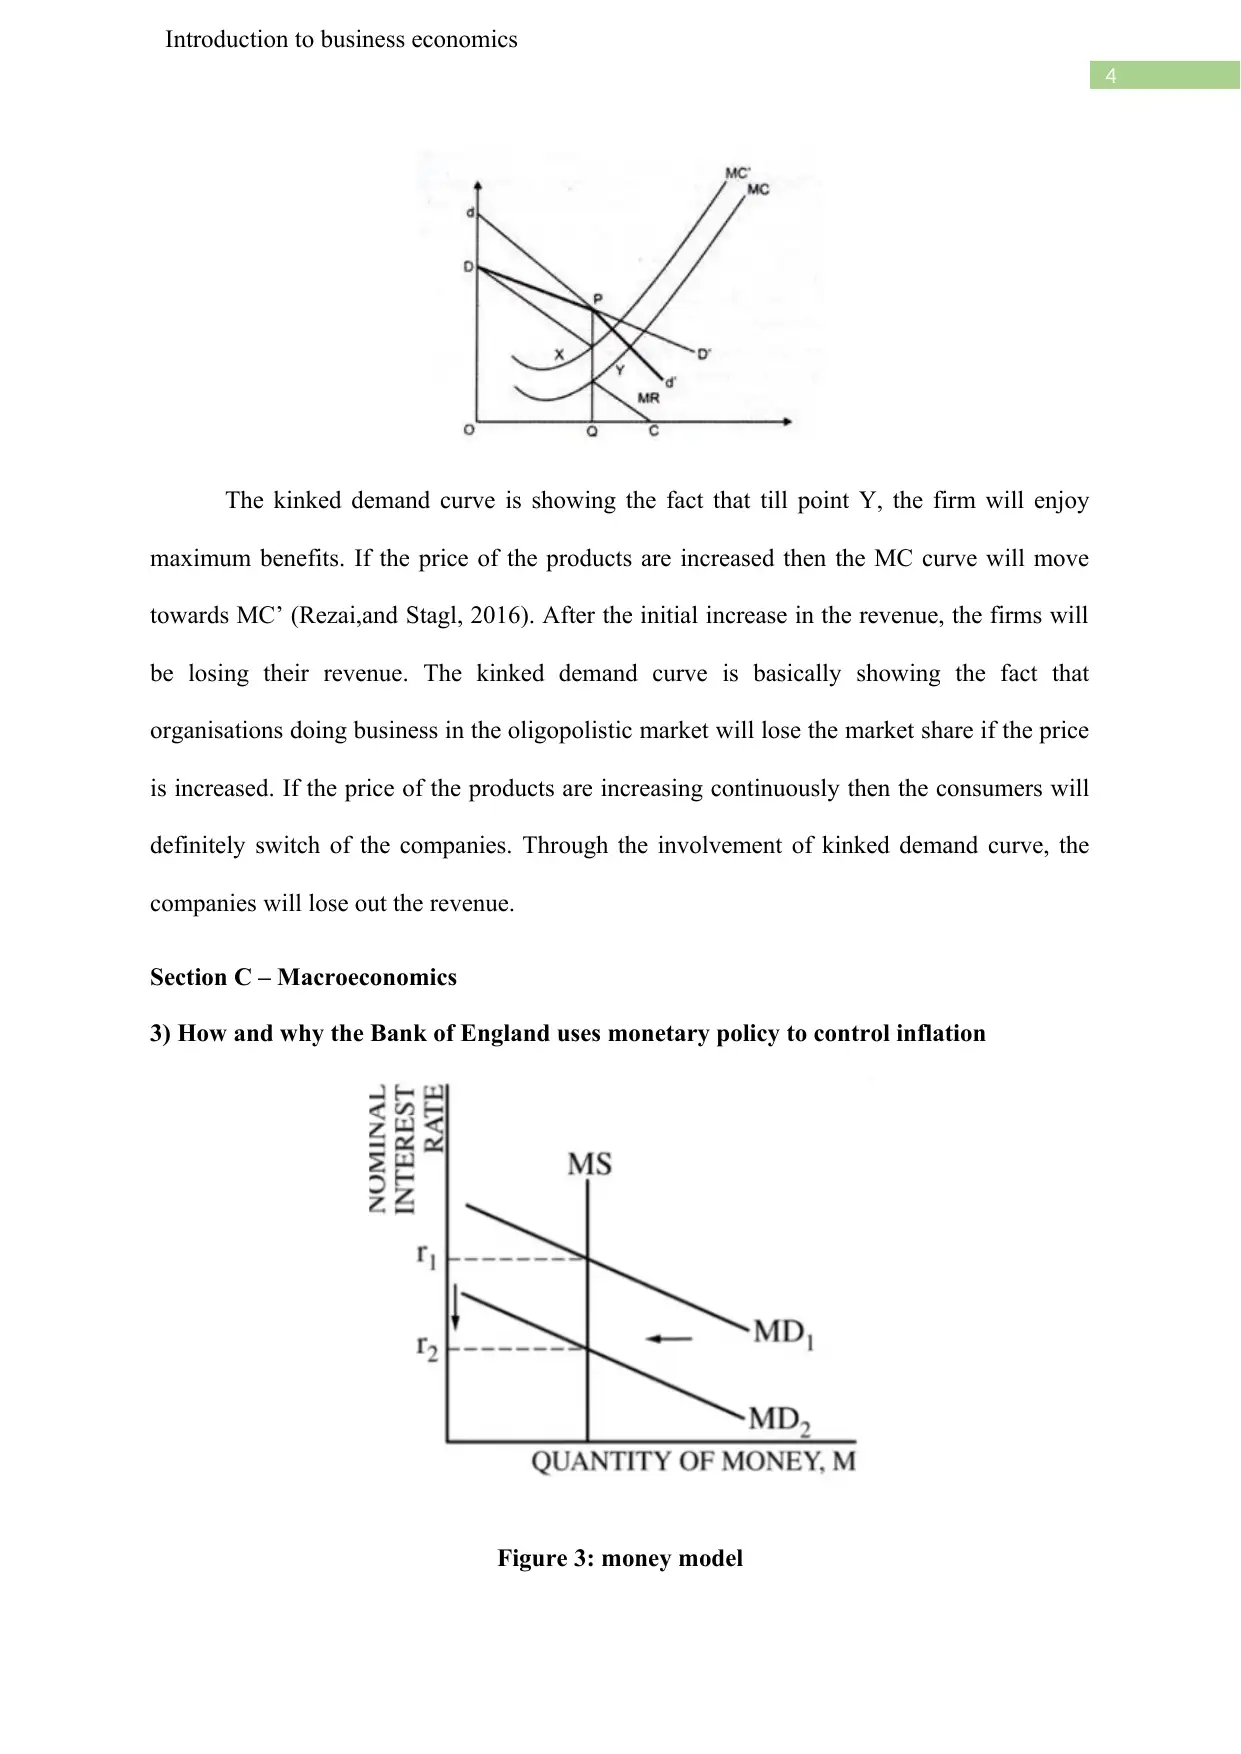
The kinked demand curve is showing the fact that till point Y, the firm will enjoy
maximum benefits. If the price of the products are increased then the MC curve will move
towards MC’ (Rezai,and Stagl, 2016). After the initial increase in the revenue, the firms will
be losing their revenue. The kinked demand curve is basically showing the fact that
organisations doing business in the oligopolistic market will lose the market share if the price
is increased. If the price of the products are increasing continuously then the consumers will
definitely switch of the companies. Through the involvement of kinked demand curve, the
companies will lose out the revenue.
Section C – Macroeconomics
3) How and why the Bank of England uses monetary policy to control inflation
Figure 3: money model
Introduction to business economics
The kinked demand curve is showing the fact that till point Y, the firm will enjoy
maximum benefits. If the price of the products are increased then the MC curve will move
towards MC’ (Rezai,and Stagl, 2016). After the initial increase in the revenue, the firms will
be losing their revenue. The kinked demand curve is basically showing the fact that
organisations doing business in the oligopolistic market will lose the market share if the price
is increased. If the price of the products are increasing continuously then the consumers will
definitely switch of the companies. Through the involvement of kinked demand curve, the
companies will lose out the revenue.
Section C – Macroeconomics
3) How and why the Bank of England uses monetary policy to control inflation
Figure 3: money model

5
Introduction to business economics
Bank of England is basically going to revive the monetary policy by identifying the
money demand and money supply within the economy. In order to control the level of the
inflation, it is important for the bank of England to minimise the supply of money if the
economy is having more MS because that will lead to the increase in the nominal interest rate
within the economy. In order to minimise the interest rate within the economy of England, it
is important for the economy to bring in high grade of resources and if the government can
pose a control on the money supply then the whole economy will be able to tighten the
economy then the beneficial will be in the form of low rate of inflation. However, expansion
of the government infrastructure is basically increase the overall resource building
technology and that will increase the demand of the consumers (Evans et al. 2017).
Monetary transmission mechanism is working on the basis of the demand and supply
of goods and services. This is an important aspect in the sense that through the increased
level of development in infrastructure, the economy will rely on the building of resources that
will definitely increase the overall demand of the economy. If the economy is having high
rate of growth in the economic involvement then the whole economy will flourish.
4. Using the AD/AS model, analyse how an economic policy maker might respond to a
recession.
The period of recession is basically showing the sluggish growth of the economy. In
order to indulge the improvement of the economic activities, it is important for the economy
to flourish back. Through the involvement of better introduction of resources, the AD/AD
model is going to be highly helpful. Through the incorporation of better amount of monetary
and fiscal policy it is important for the development of resources. Moreover, during the
period the rate of cutting jobs will increase in the period of recession. Moreover, with the fall
in job rate, the income within the consumers will definitely fall by huge margin. With the fall
in the income level, the demand of the consumer will fall back. But in order to increase the
⊘ This is a preview!⊘
Do you want full access?
Subscribe today to unlock all pages.
Trusted by 1+ million students worldwide
6
Introduction to business economics
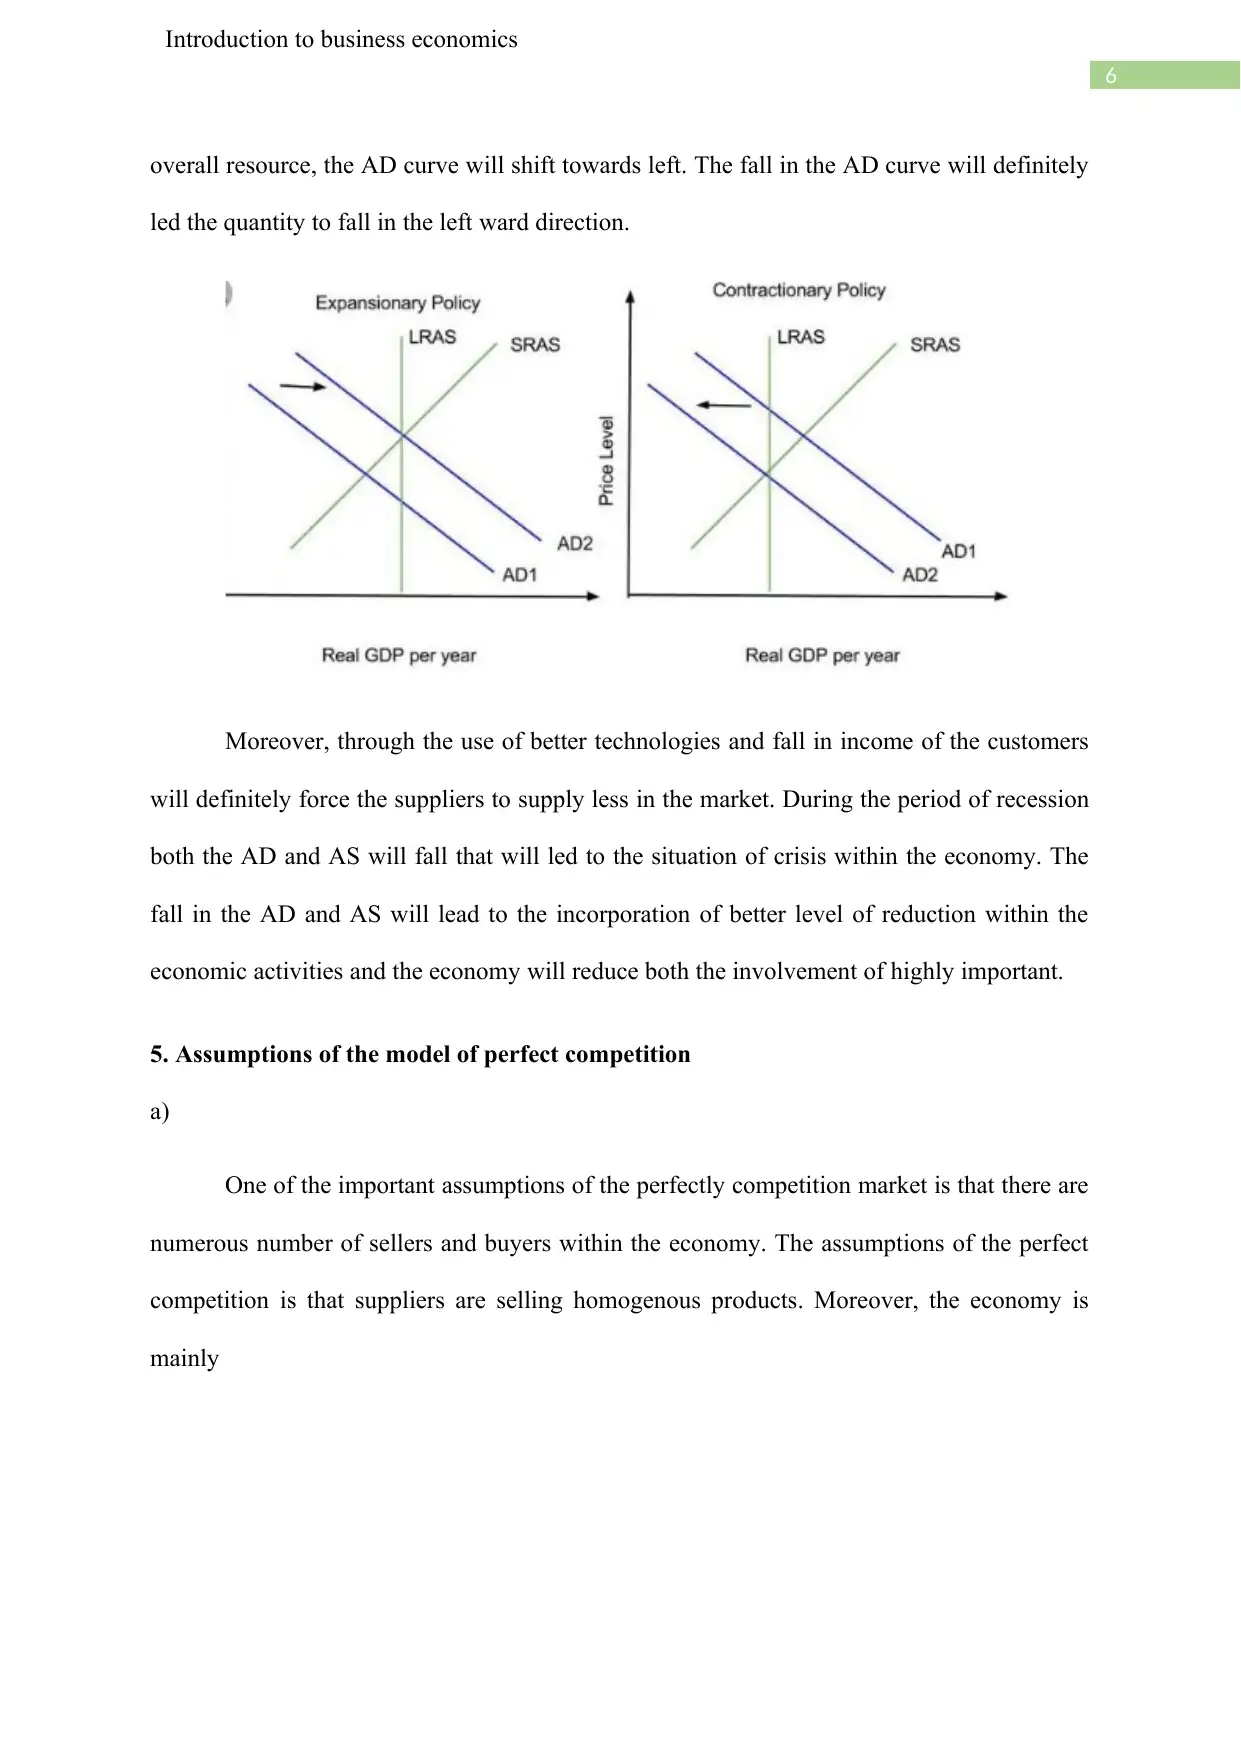
overall resource, the AD curve will shift towards left. The fall in the AD curve will definitely
led the quantity to fall in the left ward direction.
Moreover, through the use of better technologies and fall in income of the customers
will definitely force the suppliers to supply less in the market. During the period of recession
both the AD and AS will fall that will led to the situation of crisis within the economy. The
fall in the AD and AS will lead to the incorporation of better level of reduction within the
economic activities and the economy will reduce both the involvement of highly important.
5. Assumptions of the model of perfect competition
a)
One of the important assumptions of the perfectly competition market is that there are
numerous number of sellers and buyers within the economy. The assumptions of the perfect
competition is that suppliers are selling homogenous products. Moreover, the economy is
mainly
Introduction to business economics
overall resource, the AD curve will shift towards left. The fall in the AD curve will definitely
led the quantity to fall in the left ward direction.
Moreover, through the use of better technologies and fall in income of the customers
will definitely force the suppliers to supply less in the market. During the period of recession
both the AD and AS will fall that will led to the situation of crisis within the economy. The
fall in the AD and AS will lead to the incorporation of better level of reduction within the
economic activities and the economy will reduce both the involvement of highly important.
5. Assumptions of the model of perfect competition
a)
One of the important assumptions of the perfectly competition market is that there are
numerous number of sellers and buyers within the economy. The assumptions of the perfect
competition is that suppliers are selling homogenous products. Moreover, the economy is
mainly
Paraphrase This Document
Need a fresh take? Get an instant paraphrase of this document with our AI Paraphraser
7
Introduction to business economics
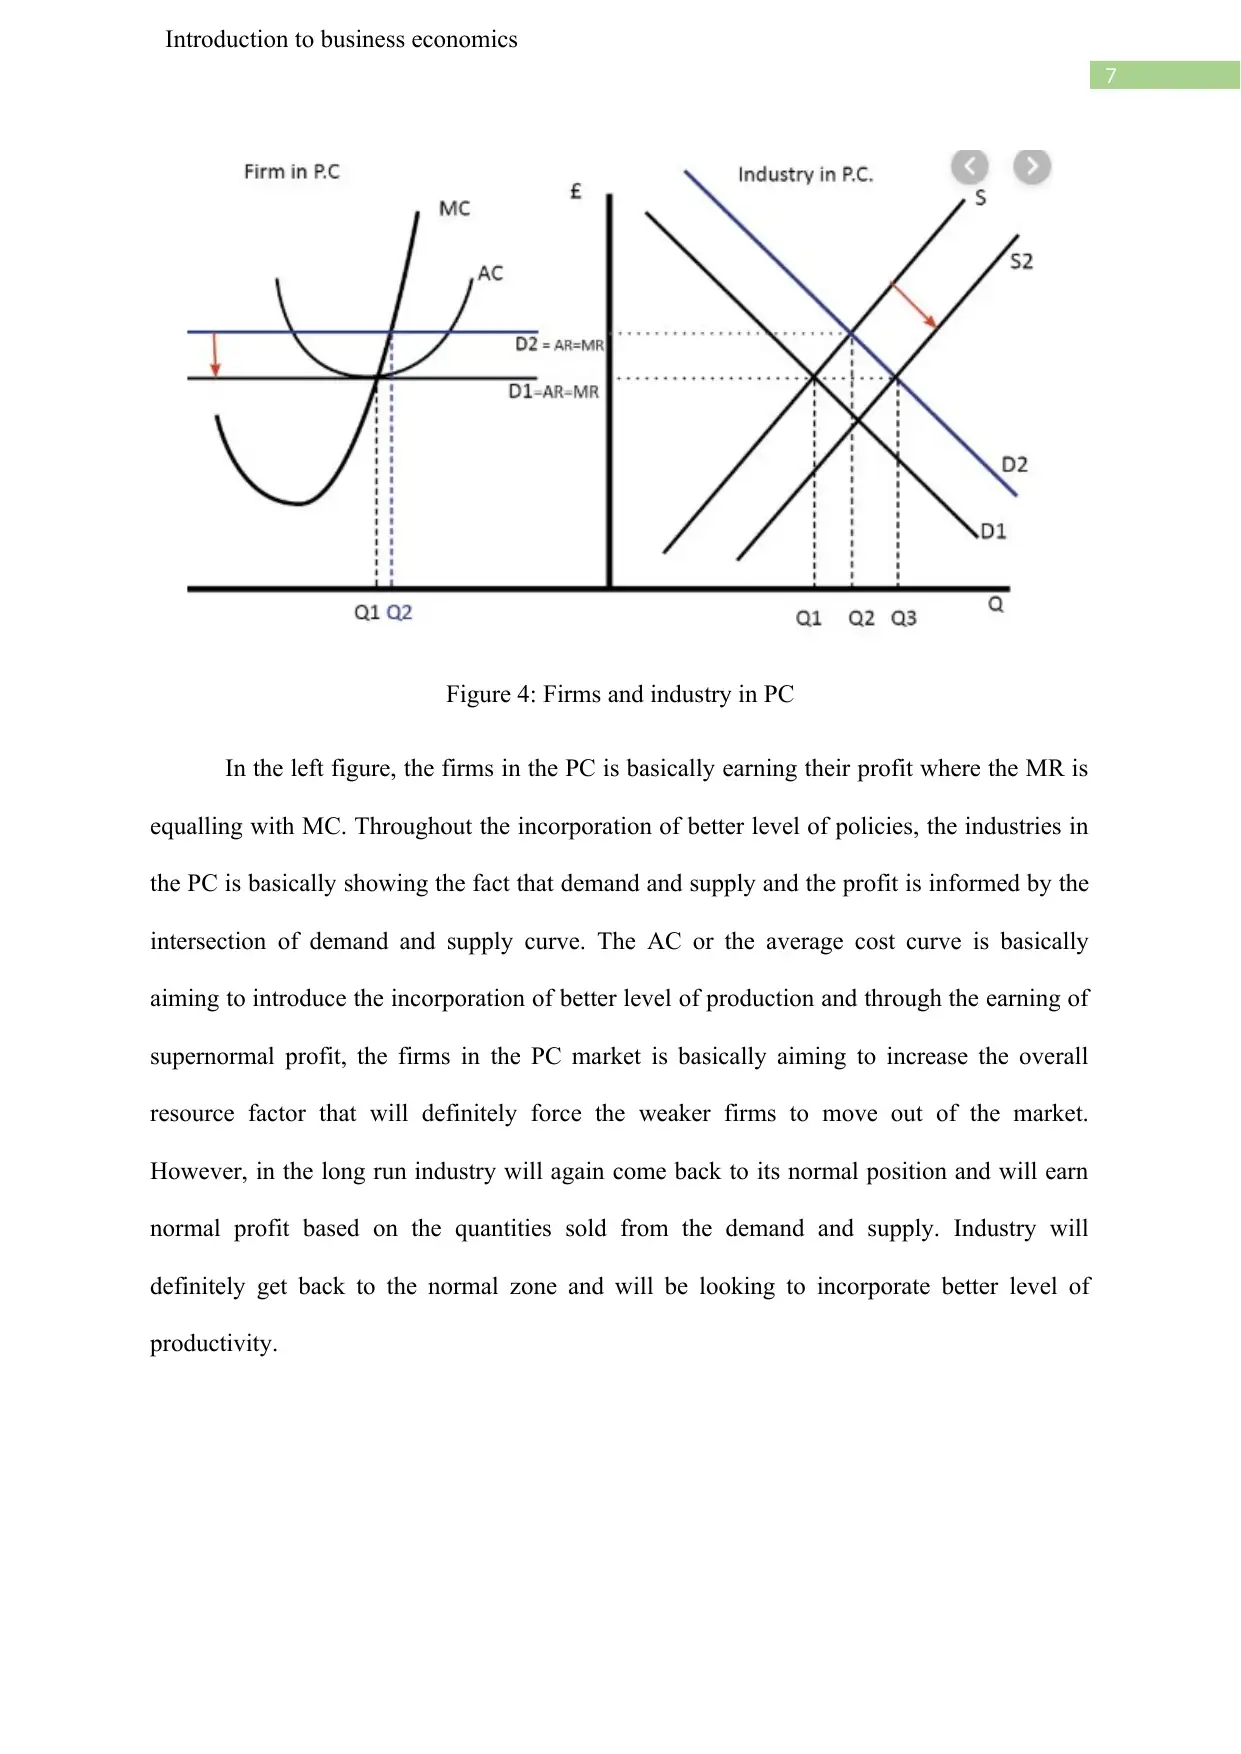
Figure 4: Firms and industry in PC
In the left figure, the firms in the PC is basically earning their profit where the MR is
equalling with MC. Throughout the incorporation of better level of policies, the industries in
the PC is basically showing the fact that demand and supply and the profit is informed by the
intersection of demand and supply curve. The AC or the average cost curve is basically
aiming to introduce the incorporation of better level of production and through the earning of
supernormal profit, the firms in the PC market is basically aiming to increase the overall
resource factor that will definitely force the weaker firms to move out of the market.
However, in the long run industry will again come back to its normal position and will earn
normal profit based on the quantities sold from the demand and supply. Industry will
definitely get back to the normal zone and will be looking to incorporate better level of
productivity.
Introduction to business economics
Figure 4: Firms and industry in PC
In the left figure, the firms in the PC is basically earning their profit where the MR is
equalling with MC. Throughout the incorporation of better level of policies, the industries in
the PC is basically showing the fact that demand and supply and the profit is informed by the
intersection of demand and supply curve. The AC or the average cost curve is basically
aiming to introduce the incorporation of better level of production and through the earning of
supernormal profit, the firms in the PC market is basically aiming to increase the overall
resource factor that will definitely force the weaker firms to move out of the market.
However, in the long run industry will again come back to its normal position and will earn
normal profit based on the quantities sold from the demand and supply. Industry will
definitely get back to the normal zone and will be looking to incorporate better level of
productivity.
8
Introduction to business economics
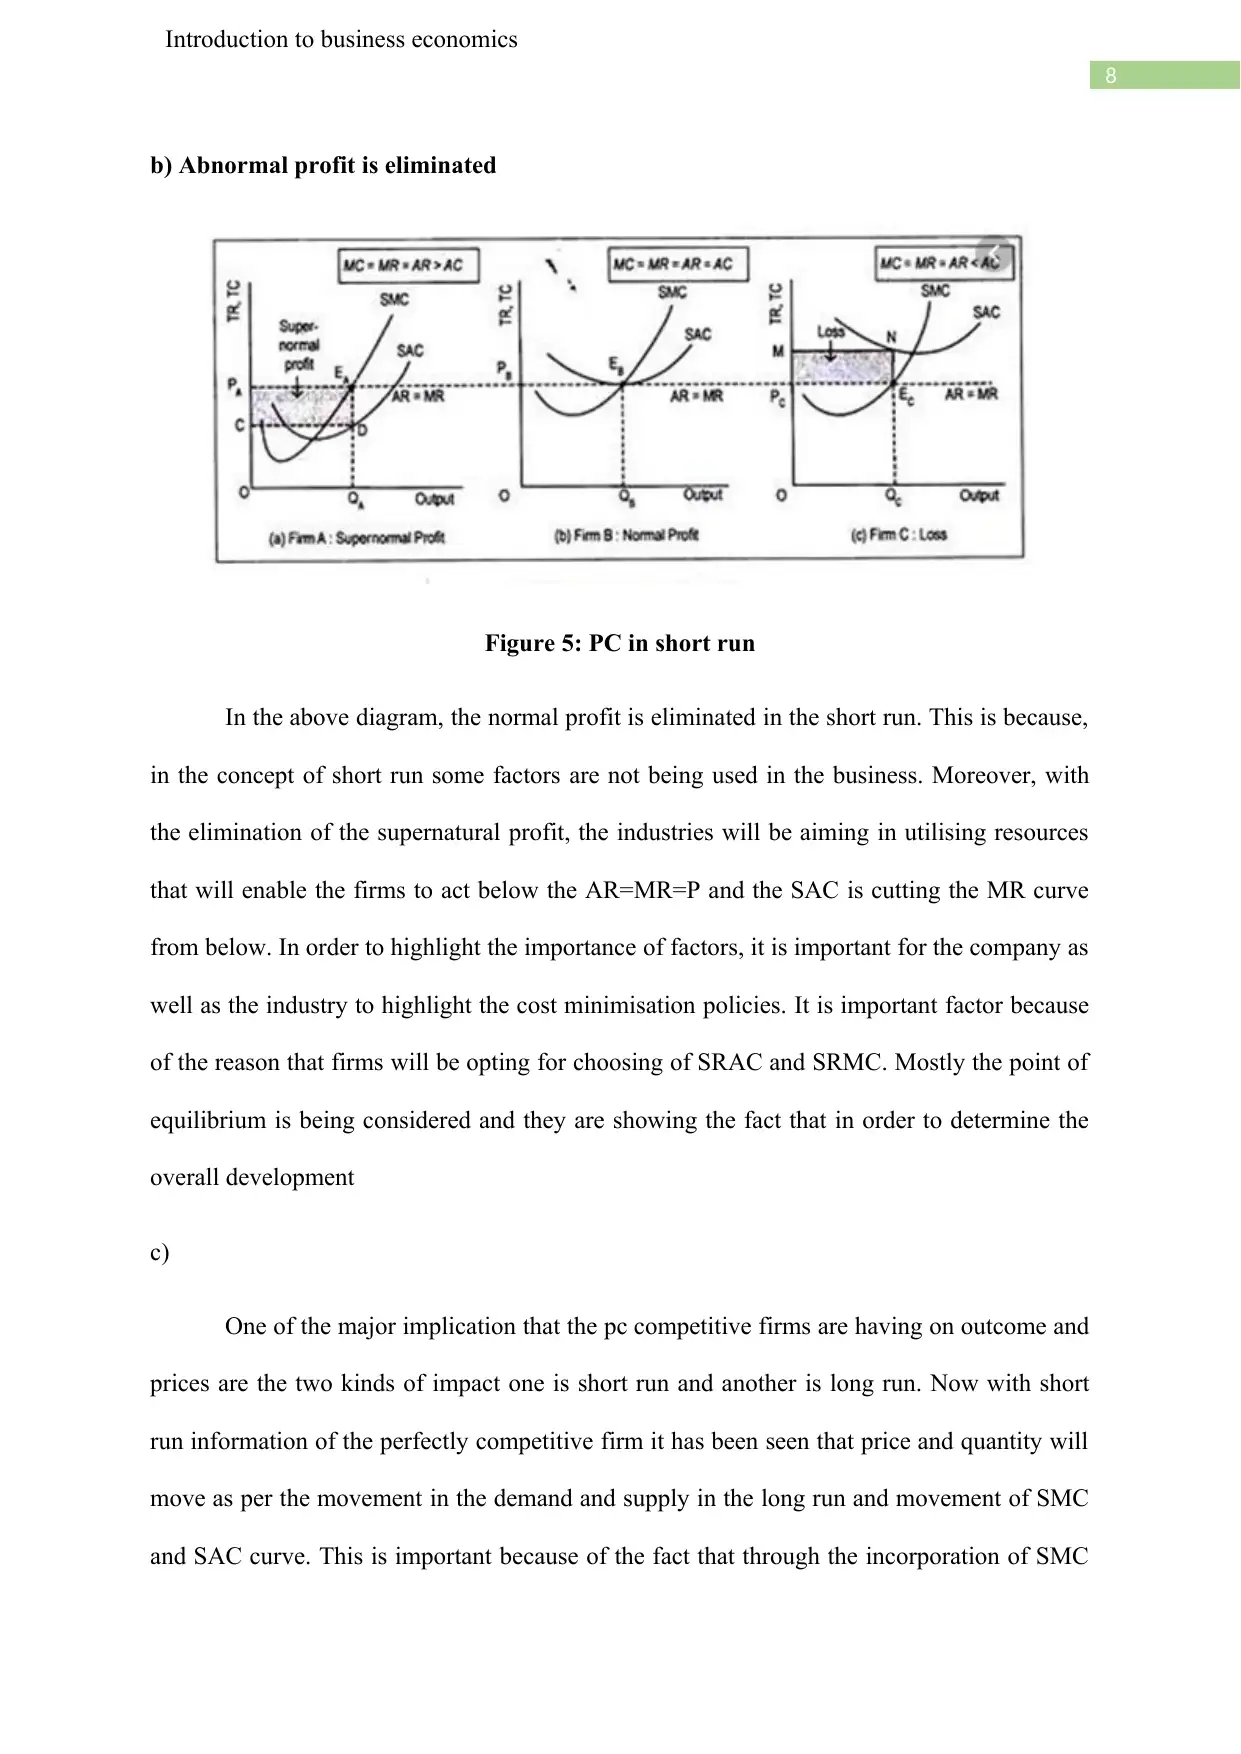
b) Abnormal profit is eliminated
Figure 5: PC in short run
In the above diagram, the normal profit is eliminated in the short run. This is because,
in the concept of short run some factors are not being used in the business. Moreover, with
the elimination of the supernatural profit, the industries will be aiming in utilising resources
that will enable the firms to act below the AR=MR=P and the SAC is cutting the MR curve
from below. In order to highlight the importance of factors, it is important for the company as
well as the industry to highlight the cost minimisation policies. It is important factor because
of the reason that firms will be opting for choosing of SRAC and SRMC. Mostly the point of
equilibrium is being considered and they are showing the fact that in order to determine the
overall development
c)
One of the major implication that the pc competitive firms are having on outcome and
prices are the two kinds of impact one is short run and another is long run. Now with short
run information of the perfectly competitive firm it has been seen that price and quantity will
move as per the movement in the demand and supply in the long run and movement of SMC
and SAC curve. This is important because of the fact that through the incorporation of SMC
Introduction to business economics
b) Abnormal profit is eliminated
Figure 5: PC in short run
In the above diagram, the normal profit is eliminated in the short run. This is because,
in the concept of short run some factors are not being used in the business. Moreover, with
the elimination of the supernatural profit, the industries will be aiming in utilising resources
that will enable the firms to act below the AR=MR=P and the SAC is cutting the MR curve
from below. In order to highlight the importance of factors, it is important for the company as
well as the industry to highlight the cost minimisation policies. It is important factor because
of the reason that firms will be opting for choosing of SRAC and SRMC. Mostly the point of
equilibrium is being considered and they are showing the fact that in order to determine the
overall development
c)
One of the major implication that the pc competitive firms are having on outcome and
prices are the two kinds of impact one is short run and another is long run. Now with short
run information of the perfectly competitive firm it has been seen that price and quantity will
move as per the movement in the demand and supply in the long run and movement of SMC
and SAC curve. This is important because of the fact that through the incorporation of SMC
⊘ This is a preview!⊘
Do you want full access?
Subscribe today to unlock all pages.
Trusted by 1+ million students worldwide
9
Introduction to business economics
and SAC curve, the long run cost curve will basically aim in bringing in better level of
improved profit maximisation condition. However, firms earning normal profit within the pc
industry is aiming to increase the overall development of resource based activities. Normal
profit is acceptable but supernormal profit is not accepted.
6. Oligopoly
a) The major assumptions of the kinked demand curve is that oligopolistic market price
stability or price rigidity is one of the big thing. Due to the price rigidity in actions it is
important for the firms that are mainly dealing with the oligopolistic market is basically
showing the fact that in order to indulge the improvement of resources, the producers will
follow the decisions to be made and they will follow one firms that are having high level of
correlation. Through the involvement of better level of resource mitigation, it is important for
the company to bring in SRMC and SRAC (FitzRoy and Papyrakis, 2016). Through the
involvement of SRMAC, the reason behind the kinked demand curve of the long run profit
maximisation is that point of time where the MR and MC are intersecting. This is an
important thinking because of the fact that looking into the fact that point of intersection of
MR and MC will obviously give better results of the profit maximisation condition of the
firms. Easy shift of the production goods is quite possible in the oligopolistic market and the
kinked in the demand curve mainly arises from the price stability and price rigidity.
b) Prices to be sticky
In oligopolistic market, one of the reason for the price to be sticky because of the fact
that in oligopolistic market, small number of large firms are competing each other to give
products to the customers and they are selling more or less homogenous products. This is an
important concept in the sense that through the competition among them, the companies are
moving to follow the stackleberg’s leader follower model by formation of cartel. If one
Paraphrase This Document
Need a fresh take? Get an instant paraphrase of this document with our AI Paraphraser
10
Introduction to business economics
company is decreasing the products the other organisations will also follow to do so but if
one company is increasing the price then the other companies will not follow and that
company will lose a huge market share. This is the main reason why the shape of the demand
curve is kinked in nature. The price within this kind of market will not be having any
tendency to move up and down. The demand of products within the oligopolistic market is
not so uniform in nature. If a business raises price and others leave their prices constant, then
we can expect quite a large substitution effect making demand relatively price elastic. The
business would then lose market share and expect to see a fall in its total revenue.
c) Criticism of kinked demand curve
The criticism of the kinked demand curve is mainly showing the modus operandi of
the kinked demand curve is not the correct theory. Now in order to highlight the working
procedure of the kinked demand curve it is highly recommended that better development of
resources and following of firms in lowering the price but the firms will not follow the
increase in price. Short living rivalry among the firms will also give rise to the kinked
demand curve. Thus the true and relative demand curve cannot be compared from kinked
demand curve.
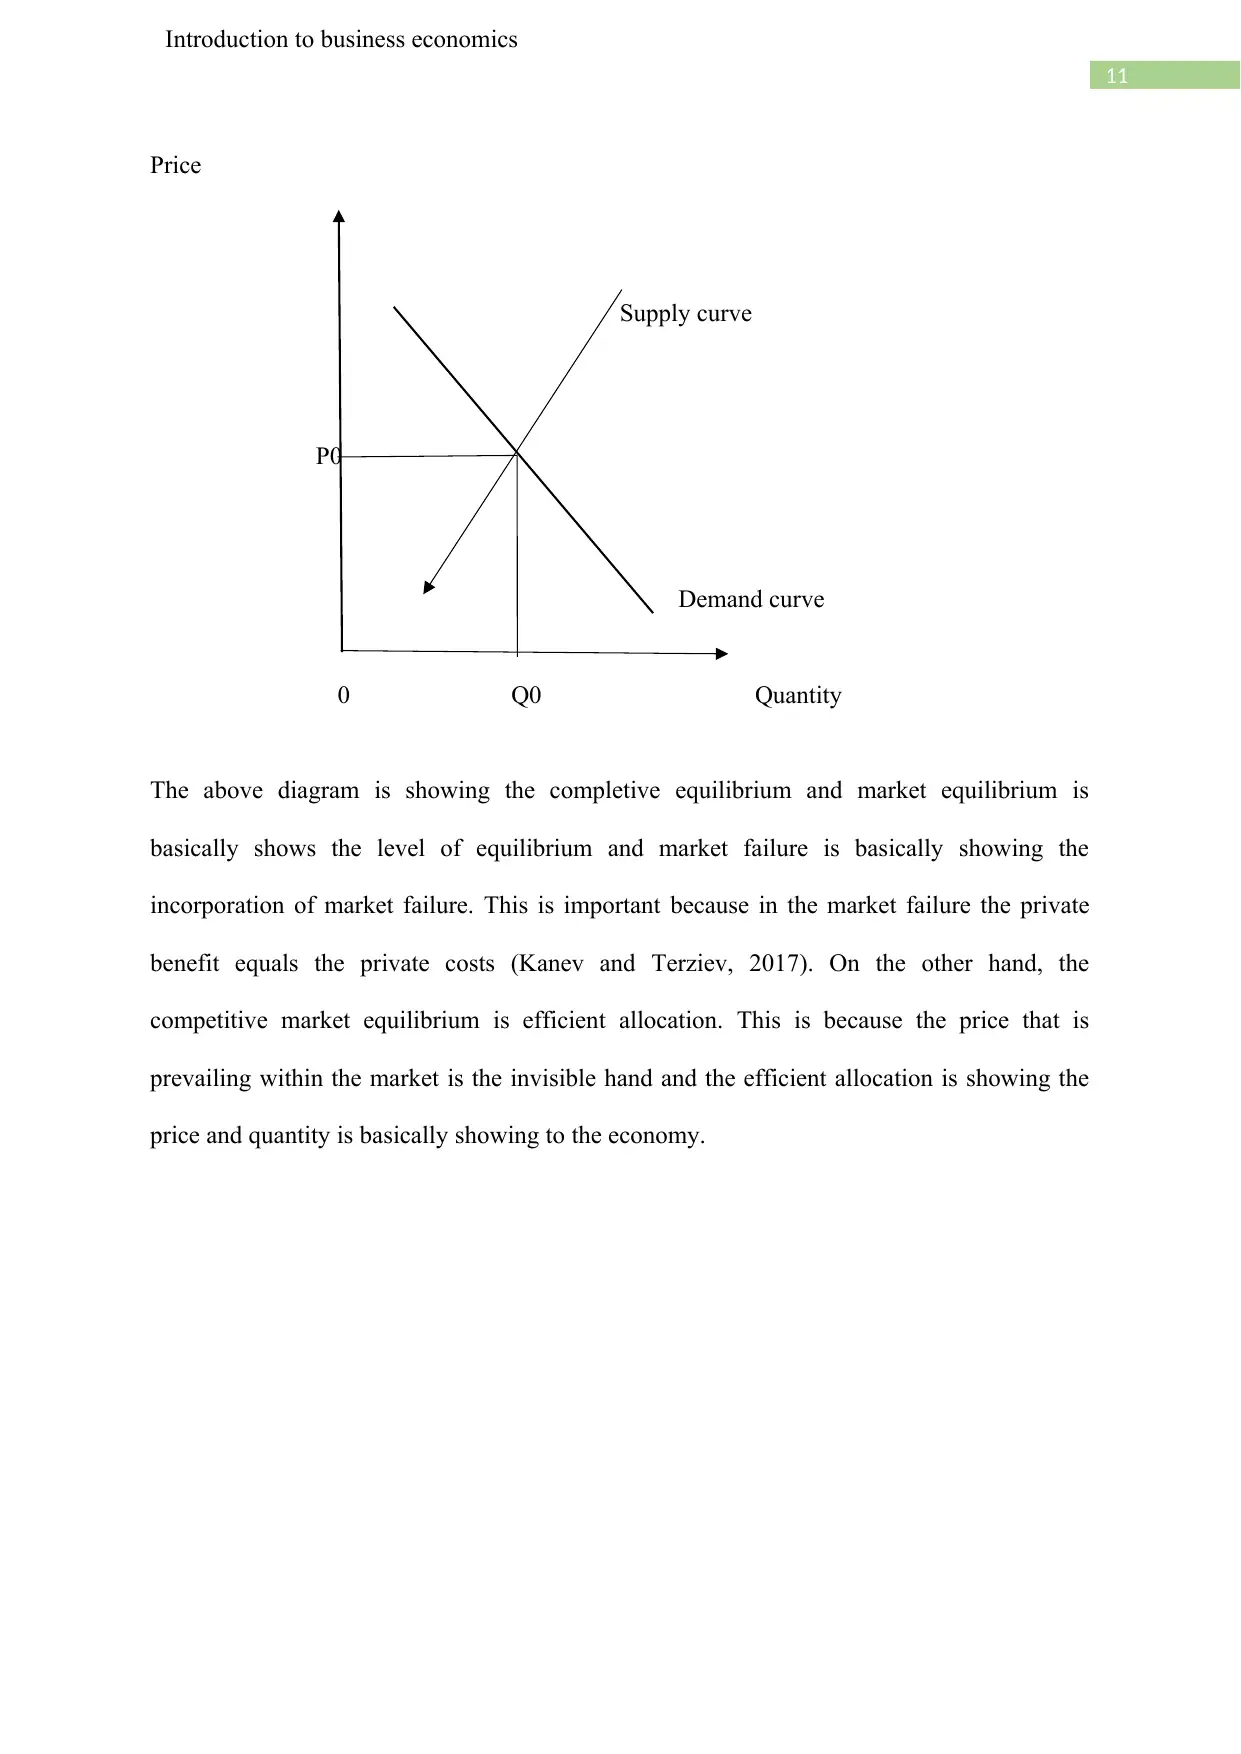
7. Competitive equilibrium vs. market failure
The model of competitive equilibrium is basically showing the intersection of demand
and supply and market failure will be the place where social benefits is lying below the social
costs curve. Moreover, the concept of competitive equilibrium is basically shown by the
demand and supply diagram shown below.
Introduction to business economics
company is decreasing the products the other organisations will also follow to do so but if
one company is increasing the price then the other companies will not follow and that
company will lose a huge market share. This is the main reason why the shape of the demand
curve is kinked in nature. The price within this kind of market will not be having any
tendency to move up and down. The demand of products within the oligopolistic market is
not so uniform in nature. If a business raises price and others leave their prices constant, then
we can expect quite a large substitution effect making demand relatively price elastic. The
business would then lose market share and expect to see a fall in its total revenue.
c) Criticism of kinked demand curve
The criticism of the kinked demand curve is mainly showing the modus operandi of
the kinked demand curve is not the correct theory. Now in order to highlight the working
procedure of the kinked demand curve it is highly recommended that better development of
resources and following of firms in lowering the price but the firms will not follow the
increase in price. Short living rivalry among the firms will also give rise to the kinked
demand curve. Thus the true and relative demand curve cannot be compared from kinked
demand curve.
7. Competitive equilibrium vs. market failure
The model of competitive equilibrium is basically showing the intersection of demand
and supply and market failure will be the place where social benefits is lying below the social
costs curve. Moreover, the concept of competitive equilibrium is basically shown by the
demand and supply diagram shown below.
11
Introduction to business economics
Price
Supply curve
P0
Demand curve
0 Q0 Quantity
The above diagram is showing the completive equilibrium and market equilibrium is
basically shows the level of equilibrium and market failure is basically showing the
incorporation of market failure. This is important because in the market failure the private
benefit equals the private costs (Kanev and Terziev, 2017). On the other hand, the
competitive market equilibrium is efficient allocation. This is because the price that is
prevailing within the market is the invisible hand and the efficient allocation is showing the
price and quantity is basically showing to the economy.
⊘ This is a preview!⊘
Do you want full access?
Subscribe today to unlock all pages.
Trusted by 1+ million students worldwide
1 out of 17
Related Documents


Your All-in-One AI-Powered Toolkit for Academic Success.
+13062052269
info@desklib.com
Available 24*7 on WhatsApp / Email
![[object Object]](/_next/static/media/star-bottom.7253800d.svg)
Unlock your academic potential
Copyright © 2020–2026 A2Z Services. All Rights Reserved. Developed and managed by ZUCOL.