BEO6600 - Business Economics: AD-AS Model Homework Assignment
VerifiedAdded on 2021/03/23
|16
|4057
|169
Homework Assignment
AI Summary
This homework assignment for Business Economics (BEO6600) provides solutions to questions on the AD-AS model, covering topics such as the downward slope of the aggregate demand curve, the upward slope of the short-run aggregate supply curve, and factors that shift the aggregate demand curve. It explores the short-run and long-run effects of these shifts, including the impact on output, price level, and unemployment. The assignment also addresses the effects of economic events on long-run aggregate supply, the impact of various developments on the money supply, and the role of monetary and fiscal policies, including automatic stabilizers, in stabilizing aggregate demand. Diagrams are used to illustrate the concepts and effects discussed, providing a comprehensive analysis of macroeconomic principles. This assignment is designed to help students understand the core concepts of the AD-AS model and the application of monetary and fiscal policies in managing the economy.

Business Economics (BEO6600)
STRUCTURED HOMEWORK ASSIGNMENT SET (4)
CHAPTER 33 AD-AS, QUESTIONS FOR REVIEW 3, 5 & 6
QUESTION 3
List and explain the three reasons the aggregate demand curve slopes downward.
The aggregate demand curve slopes downward for three reasons:
1. The inflation rate and consumption: the wealth effect
2. The inflation rate and investment: the interest-rate effect
3. The inflation rate and net exports: the exchange-rate effect.
1. The inflation rate and consumption: the wealth effect
When the price level increases, the real value of money reduces and makes consumer
poorer. It also reduces the quantity of goods and services demanded as the consumer
spending decreases because of the rise in the price level. Likewise, when the price
level decreases, the real value money increase and makes consumers better off. As a
result they spend more on goods and services which means goods and services
demanded rises.
2. The inflation rate and investment: the interest-rate effect
When the price level increases, more money is needed to make purchases and pay for
inputs. The increased demand for it will drive up its price, the rate of interest. These
higher rates will decrease the buying of goods with borrowed money, thus decreasing
the amount of real output demanded. A lower price level reduces the interest rate,
encourages greater spending on investment goods, and thereby increases the quantity
of goods and services demanded.
3. The inflation rate and net exports: the exchange-rate effect
As the United States’ price level rises relative to other countries, Americans will buy
more abroad in preference to their own output. At the same time foreigners, finding
American goods and services relatively more expensive, will decrease their buying of
American exports. Thus, with increased imports and decreased exports, American net
exports decrease and so, therefore, does the quantity demanded of American real
output. When a fall in the United States’ price level causes U.S. interest rates to fall,
the real value of the dollar declines in foreign exchange markets. With this
depreciation, U.S. net exports rises and thereby increases the quantity of goods and
services demanded.
QUESTIONS 5
List and explain the three theories for why the short run aggregate supply curve slopes
upward.
The aggregate-supply curve shows the quantity of goods and services that firms choose to
produce and sell at each inflation rate. Following theories explain why the short run
aggregate supply curve slopes upward.
1. The new classical misperceptions theory
1
Paraphrase This Document
Need a fresh take? Get an instant paraphrase of this document with our AI Paraphraser

Business Economics (BEO6600)
Misperceptions about relative prices caused due to a lower price level. It results in
suppliers to decrease the quantity of goods and services supplied in order to respond
the lower price level.
2. The Keynesian sticky-wage theory
A lower price level makes employment and production less profitable because wages
do not adjust immediately to the price level, so firms reduce the quantity of goods and
services supplied;
3. The new Keynesian sticky-price theory
Firms with higher-than-desired prices effect due to an unexpected fall in the price
because not all prices adjust immediately to changing conditions. This will results in
reduce sales and induces firms to reduce the quantity of goods and services they
produce.
QUESTIONS 6
What might shift the aggregate-demand curve to the left? Use the model of aggregate
demand and aggregate supply to trace through the short-run and long-run effects of
such a shift on output and the price level.
Situations when aggregate Demand Curve shifts to the left:
1. Changes in Consumption: Aggregate Demand curve shifts to the left when an event
that causes consumers to spend less at a given price level such as people desire to
increase saving.
2. Changes in Investment: Aggregate Demand curve shifts left when an event causes
firms to invest less at a given price. This might be increase in interest rate due to
decreasing money Supply. For example: increased taxes on the returns to investment.
3. Changes in government purchases: when decrease in government purchases on goods
and services shift aggregate demand curve to the left like a cutback in defence
spending.
4. Changes in net export: aggregate demand curve shifts left when an event that reduces
spending on government net exports at a given price level. This could be due to a
recession in overseas and speculation that causes an exchange rate.
The diagram below shows the trace through the short run and long run effects of such a shift
on aggregate demand. The economy starts at equilibrium at point E1, intersecting short run
AS1 and AD1. When the Aggregate demand curve shifts to the left to AD2, the economy
moves from E1 to E2 with reducing price level and quantity of output. During this period
people try to adjust their perceptions, wages, and prices, shifting the short-run aggregate
supply curve down to AS2 and moving the economy from point E2 to point E3, which is
again back on the long-run aggregate supply curve and has a lower price level.
2

Business Economics (BEO6600)
CHAPTER 33PROBLEMS AND APPLICATION: 1, 2 & 8
QUESTION 1
Suppose the economy is in a long-run equilibrium.
a. Draw a diagram to illustrate the state of the economy. Be sure to show aggregate
demand, short-run aggregate supply, and long-run aggregate supply.
b. Now suppose that a stock market crash causes ag- aggregate demand to fall. Use
your diagram to show what happens to output and the price level in the short
run. What happens to the unemployment rate?
c. Use the sticky-wage theory of aggregate supply to explain what will happen to
output and the price level in the long run (assuming there is no change in policy).
What role does the expected price level play in this adjustment? Be sure to
illustrate your analysis in a graph.
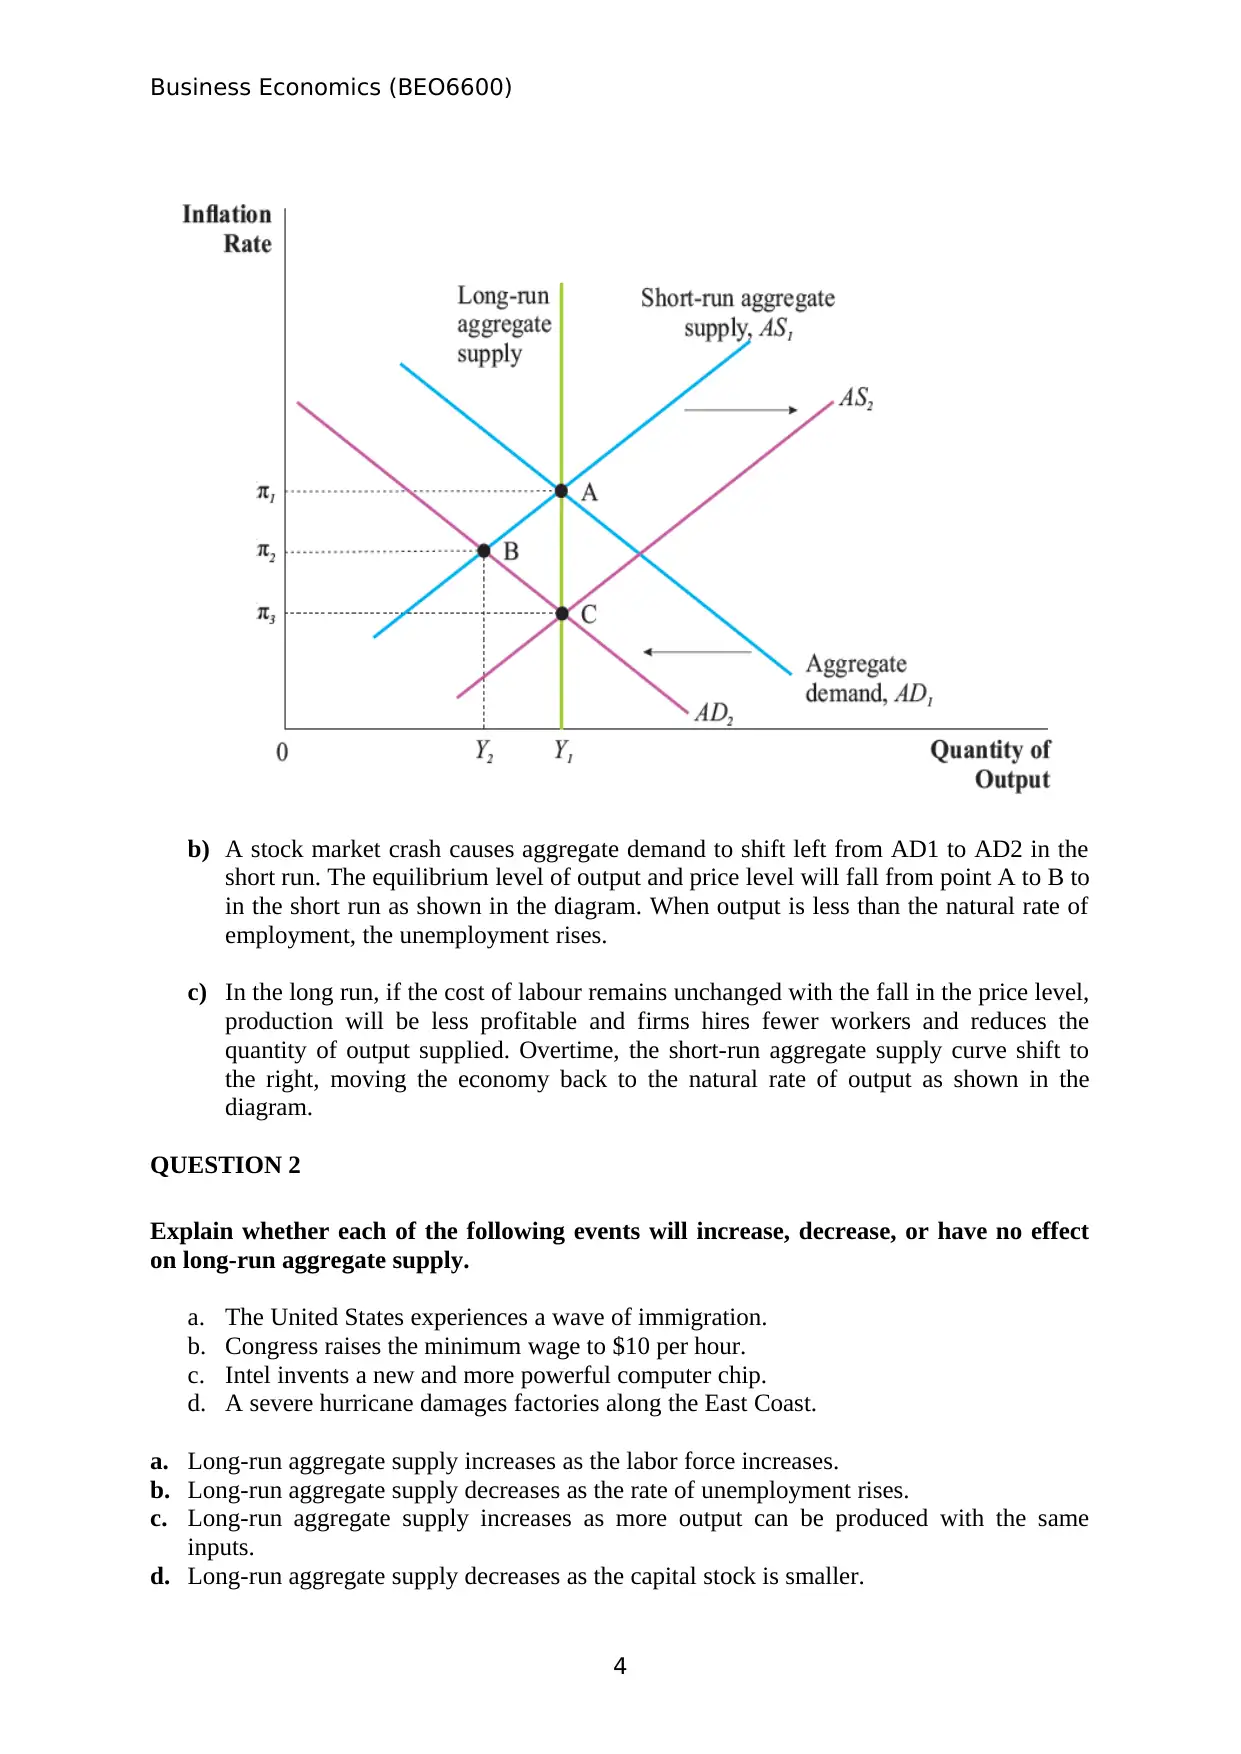
a) Figure below illustrates the state of the economy. The aggregate demand, short-run
aggregate supply and the long-run aggregate supply curve is clearly marked on the
graph. The aggregate demand and short-run aggregate supply curve intersect at the
same point on the long-run aggregate supply curve.
3
CHAPTER 33PROBLEMS AND APPLICATION: 1, 2 & 8
QUESTION 1
Suppose the economy is in a long-run equilibrium.
a. Draw a diagram to illustrate the state of the economy. Be sure to show aggregate
demand, short-run aggregate supply, and long-run aggregate supply.
b. Now suppose that a stock market crash causes ag- aggregate demand to fall. Use
your diagram to show what happens to output and the price level in the short
run. What happens to the unemployment rate?
c. Use the sticky-wage theory of aggregate supply to explain what will happen to
output and the price level in the long run (assuming there is no change in policy).
What role does the expected price level play in this adjustment? Be sure to
illustrate your analysis in a graph.
a) Figure below illustrates the state of the economy. The aggregate demand, short-run
aggregate supply and the long-run aggregate supply curve is clearly marked on the
graph. The aggregate demand and short-run aggregate supply curve intersect at the
same point on the long-run aggregate supply curve.
3
⊘ This is a preview!⊘
Do you want full access?
Subscribe today to unlock all pages.
Trusted by 1+ million students worldwide
Business Economics (BEO6600)
b) A stock market crash causes aggregate demand to shift left from AD1 to AD2 in the
short run. The equilibrium level of output and price level will fall from point A to B to
in the short run as shown in the diagram. When output is less than the natural rate of
employment, the unemployment rises.
c) In the long run, if the cost of labour remains unchanged with the fall in the price level,
production will be less profitable and firms hires fewer workers and reduces the
quantity of output supplied. Overtime, the short-run aggregate supply curve shift to
the right, moving the economy back to the natural rate of output as shown in the
diagram.
QUESTION 2
Explain whether each of the following events will increase, decrease, or have no effect
on long-run aggregate supply.
a. The United States experiences a wave of immigration.
b. Congress raises the minimum wage to $10 per hour.
c. Intel invents a new and more powerful computer chip.
d. A severe hurricane damages factories along the East Coast.
a. Long-run aggregate supply increases as the labor force increases.
b. Long-run aggregate supply decreases as the rate of unemployment rises.
c. Long-run aggregate supply increases as more output can be produced with the same
inputs.
d. Long-run aggregate supply decreases as the capital stock is smaller.
4
Paraphrase This Document
Need a fresh take? Get an instant paraphrase of this document with our AI Paraphraser

Business Economics (BEO6600)
QUESTION 8
Explain whether each of the following events shifts the short-run aggregate-supply
curve, the aggregate- demand curve, both, or neither. For each event that does shift a
curve, draw a diagram to illustrate the effect on the economy.
a. Households decide to save a larger share of their income.
When households decide to save a larger share of their income, they have to control
and reduce their spending on Consumer goods. So the aggregate demand curve shifts
to the left from AD1 to AD2 and both price and quantity decreased. Therefore the
equilibrium price change from E1 to E2. This is shown in the diagram below.
b. Florida orange groves suffer a prolonged period of below-freezing temperatures.
When Florida orange groves suffer a prolonged period of below freezing temperature,
the orange harvest will decreased. Therefore supply of orange decreased and supply
curve shifts to the left from AS1 to AS2 in the short run. The price increased and
quantity decreased. So the equilibrium price change from E1 to E2. This can be seen
in the following diagram.
5

Business Economics (BEO6600)
c. Increased job opportunities overseas cause many people to leave the country.
When job opportunities increased in overseas causes many people to leave country, so
aggregate demand decrease due to less number of consumers in market. In the short
run, aggregate Supply will also decrease due to the less number of producers in the
market. Therefore the aggregate demand Curve shifts to the left from AD1 to AD2
and Aggregate Supply curve also shifts to the left from AS1 to AS2. As a result the
output level decline in the market. The price levels changes depends on the changes of
aggregate demand and Short run aggregate supply curve. This can be seen in the
diagram below.
6
⊘ This is a preview!⊘
Do you want full access?
Subscribe today to unlock all pages.
Trusted by 1+ million students worldwide

Business Economics (BEO6600)
CHAPTER 34 MONETARY AND FISCAL POLICY, QUESTIONS FOR REVIEW 2,
4 & 5
QUESTION 2
Use the theory of liquidity preference to explain how a decrease in the money supply
affects the aggregate demand curve.
As shown in Panel (a), a decrease in the money supply shifts the money-supply curve to the
left from MS1 to MS2, rises the equilibrium interest rates from r1to r2.Because interest rate is
the cost of borrowing, increase in the interest rates falls the quantity of goods and services
demanded at a given price level frim Y1 to Y2. Thus, in panel (b), the aggregate-demand
curve shifts to the left from AD1 to AD2.
Panel (a)
7
Paraphrase This Document
Need a fresh take? Get an instant paraphrase of this document with our AI Paraphraser

Business Economics (BEO6600)
Panel (b)
QUESTION 4
Suppose that survey measures of consumer confidence indicate a wave of pessimism is
sweeping the country. If policymakers do nothing, what will happen to aggregate
demand? What should the Fed do if it wants to stabilize aggregate demand? If the Fed
does nothing, what might Congress do to stabilize aggregate demand?
Aggregate demand will fall as households’ consumption spending reduced and firms’
investments reduced. To induce households to save less and spend more, Fed must increase
the money supply and reduce the interest rate. When households’ spending increase, it will
encourage firms to invest more, both of which will increase aggregate demand and stabilize
it. To increase aggregate demand Congress could increase government purchases or reduce
taxes if the Fed does not increase the money supply.
QUESTION 5
Give an example of a government policy that acts as an automatic stabilizer. Explain
why the policy has this effect.
One of the example of a government policy that acts as an automatic Stabilizer is the
Unemployment benefits system. This policy has the effects, because the government spends
through unemployment system when the economy goes into the recession. Government
transfers money to the unemployed peoples. This increases in government spending
stimulates aggregate demand at exactly the time when aggregate demand is insufficient to
8

Business Economics (BEO6600)
maintain full employment. As a result, their (unemployed) income and spending do not fall
much during this period.
CHAPTER 34 PROBLEMS AND APPLICATION: 1, 2 & 8
QUESTION 1
Explain how each of the following developments would affect the supply of money, the
demand for money, and the interest rate. Illustrate your answers with diagrams.
a. The Fed’s bond traders buy bonds in open-market operations.
b. An increase in credit-card availability reduces the cash people hold.
c. The Federal Reserve reduces banks’ reserve requirements.
d. Households decide to hold more money to use for holiday shopping.
e. A wave of optimism boosts business investment and expands aggregate demand.
a) As show in figure 1, the money-supply curve shifts to the right from MS1 to MS2 when
Fed’s bond traders buy bonds in open-market operations. As a result the interest rate
declines from r1 to r2.
Figure 1
b) The money-demand curve shifts to the left from MD1 to MD2 when an increase in credit-
card availability reduces the cash people hold. This results in the decrease in the interest
rate from r1to r2. These effects are shown in the below figure 2.
9
⊘ This is a preview!⊘
Do you want full access?
Subscribe today to unlock all pages.
Trusted by 1+ million students worldwide
Business Economics (BEO6600)
Figure 2
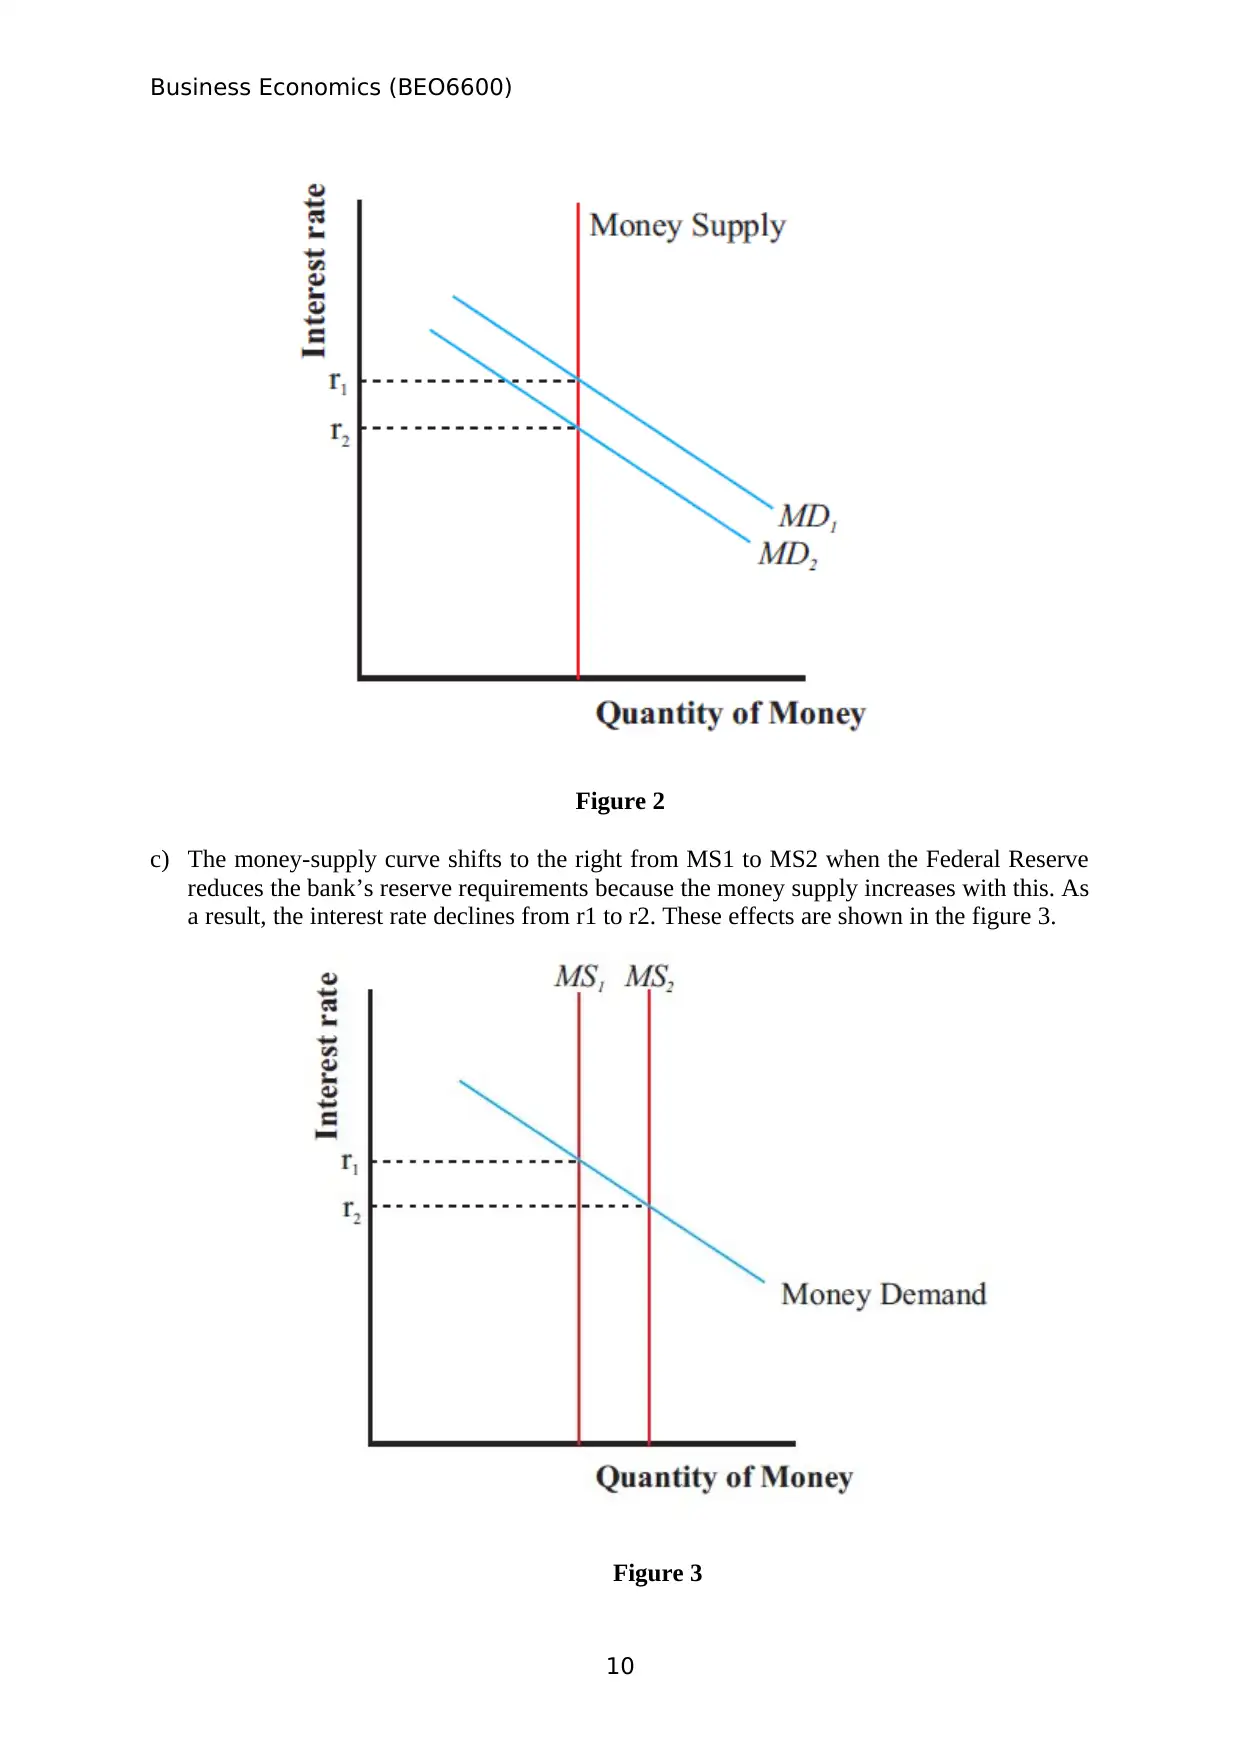
c) The money-supply curve shifts to the right from MS1 to MS2 when the Federal Reserve
reduces the bank’s reserve requirements because the money supply increases with this. As
a result, the interest rate declines from r1 to r2. These effects are shown in the figure 3.
Figure 3
10
Figure 2
c) The money-supply curve shifts to the right from MS1 to MS2 when the Federal Reserve
reduces the bank’s reserve requirements because the money supply increases with this. As
a result, the interest rate declines from r1 to r2. These effects are shown in the figure 3.
Figure 3
10
Paraphrase This Document
Need a fresh take? Get an instant paraphrase of this document with our AI Paraphraser

Business Economics (BEO6600)
d) As shown in figure 4, the money-demand curve shifts to the right from MD1 to MD2
when households decide to hold more money to use for holiday shopping. The result is a
rise in the interest rate from r1 to r2.
Figure 4
e) A wave of optimism boosts business investment and expands aggregate demand causes an
increase in money demand from MD1 to MD2 as shown in figure 5. The increase in
money demand results in the increase in interest rate from r1to r2.
11

Business Economics (BEO6600)
Figure 5
QUESTION 2
The Federal Reserve expands the money supply by 5 percent.
a. Use the theory of liquidity preference to illustrate in a graph the impact of this
policy on the interest rate.
The following Figure 6 shows that the increase in the money supply will cause the
equilibrium interest rate to decline. The following Figure 7 shows that the aggregate demand
curve shifts to the right as households will increase spending and will invest in more new
housing. Firms also will increase investment spending.
12
Figure 7Figure 6
⊘ This is a preview!⊘
Do you want full access?
Subscribe today to unlock all pages.
Trusted by 1+ million students worldwide
1 out of 16
Related Documents


Your All-in-One AI-Powered Toolkit for Academic Success.
+13062052269
info@desklib.com
Available 24*7 on WhatsApp / Email
![[object Object]](/_next/static/media/star-bottom.7253800d.svg)
Unlock your academic potential
Copyright © 2020–2026 A2Z Services. All Rights Reserved. Developed and managed by ZUCOL.