Business Economics 1 Report: Market Analysis and Policy Analysis
VerifiedAdded on 2021/04/21
|31
|7694
|25
Report
AI Summary
This comprehensive business economics report delves into the core principles of demand and supply, analyzing factors influencing the car market, such as consumer income, financing options, and the price of related goods. It examines the impact of production costs, expected future prices, and technological advancements on the supply side. The report also explores the oligopolistic nature of the car market and investigates transportation policies in East Asian countries, including public transport development in Malaysia and the implications of import tariffs. The analysis integrates economic theories with real-world examples to provide a thorough understanding of market dynamics and policy impacts. The report concludes with an overview of how various factors, from interest rates to fuel prices and technological advancements, influence both demand and supply, and how they shape the car market, incorporating relevant graphs and figures to illustrate key concepts.
Running head: BUSINESS ECONOMICS
Business economics
Name of the Student:
Name of the University:
Author’s Note:
Business economics
Name of the Student:
Name of the University:
Author’s Note:
Paraphrase This Document
Need a fresh take? Get an instant paraphrase of this document with our AI Paraphraser
1
BUSINESS ECONOMICS
Table of Contents
Answer to question 1:......................................................................................................................2
Answer to question 2:......................................................................................................................9
Answer to question 3:....................................................................................................................15
Transportation Policies in East Asian Countries...........................................................................18
Public transport development policy in Malaysia.....................................................................18
Policy of import tariff in Malaysia............................................................................................23
References list:...............................................................................................................................28
2
BUSINESS ECONOMICS
Answer to question 1:
As per economic theory, one of the fundamental principles that govern economy is law of
demand and supply. Law of demand describes the state when the price tends to increase with
increase in demand and price tends to fall with decrease in demand. It can also be said that the
demand of any commodity decreases with increase in price. The economy is said to be in
equilibrium between quantity and price, when supply and demand are in balance. Buying of car
is regarded as an act of saving as well as an act of consumption. The demand for any products is
determined by number of factors such as price of the product itself, price of substitutes, income
of consumers, taste and preferences (Baumol and Blinder 2015).
Rising disposable income-One of the crucial factors impacting the demand of any
commodity such as cars is increase in disposable income of consumers. An increase in income of
consumers is likely to increase the demand of cars and a fall in income decreased the demand for
cars. Demand for any particular car depends upon the price of cars itself.
The affect of income of consumers on demand of product can be explained with the help
of following graph. Suppose, consumers faces with an initial demand curve. Now, the condition
of economy improves and this has impacted income in a positive way. This increase in income
makes the cars affordable that increases the demand of cars. Such increase in income will cause
demand curve to shift in rightward direction (Cherryet al. 2017).
A shift in demand curve is not indicative of the fact that the quantity that each individual
consumer demands is altered by the same amount (Baset al. 2015). Instead, the pattern for
market as a whole is captured by shift in demand curve.
⊘ This is a preview!⊘
Do you want full access?
Subscribe today to unlock all pages.
Trusted by 1+ million students worldwide
3
BUSINESS ECONOMICS
Figure 1
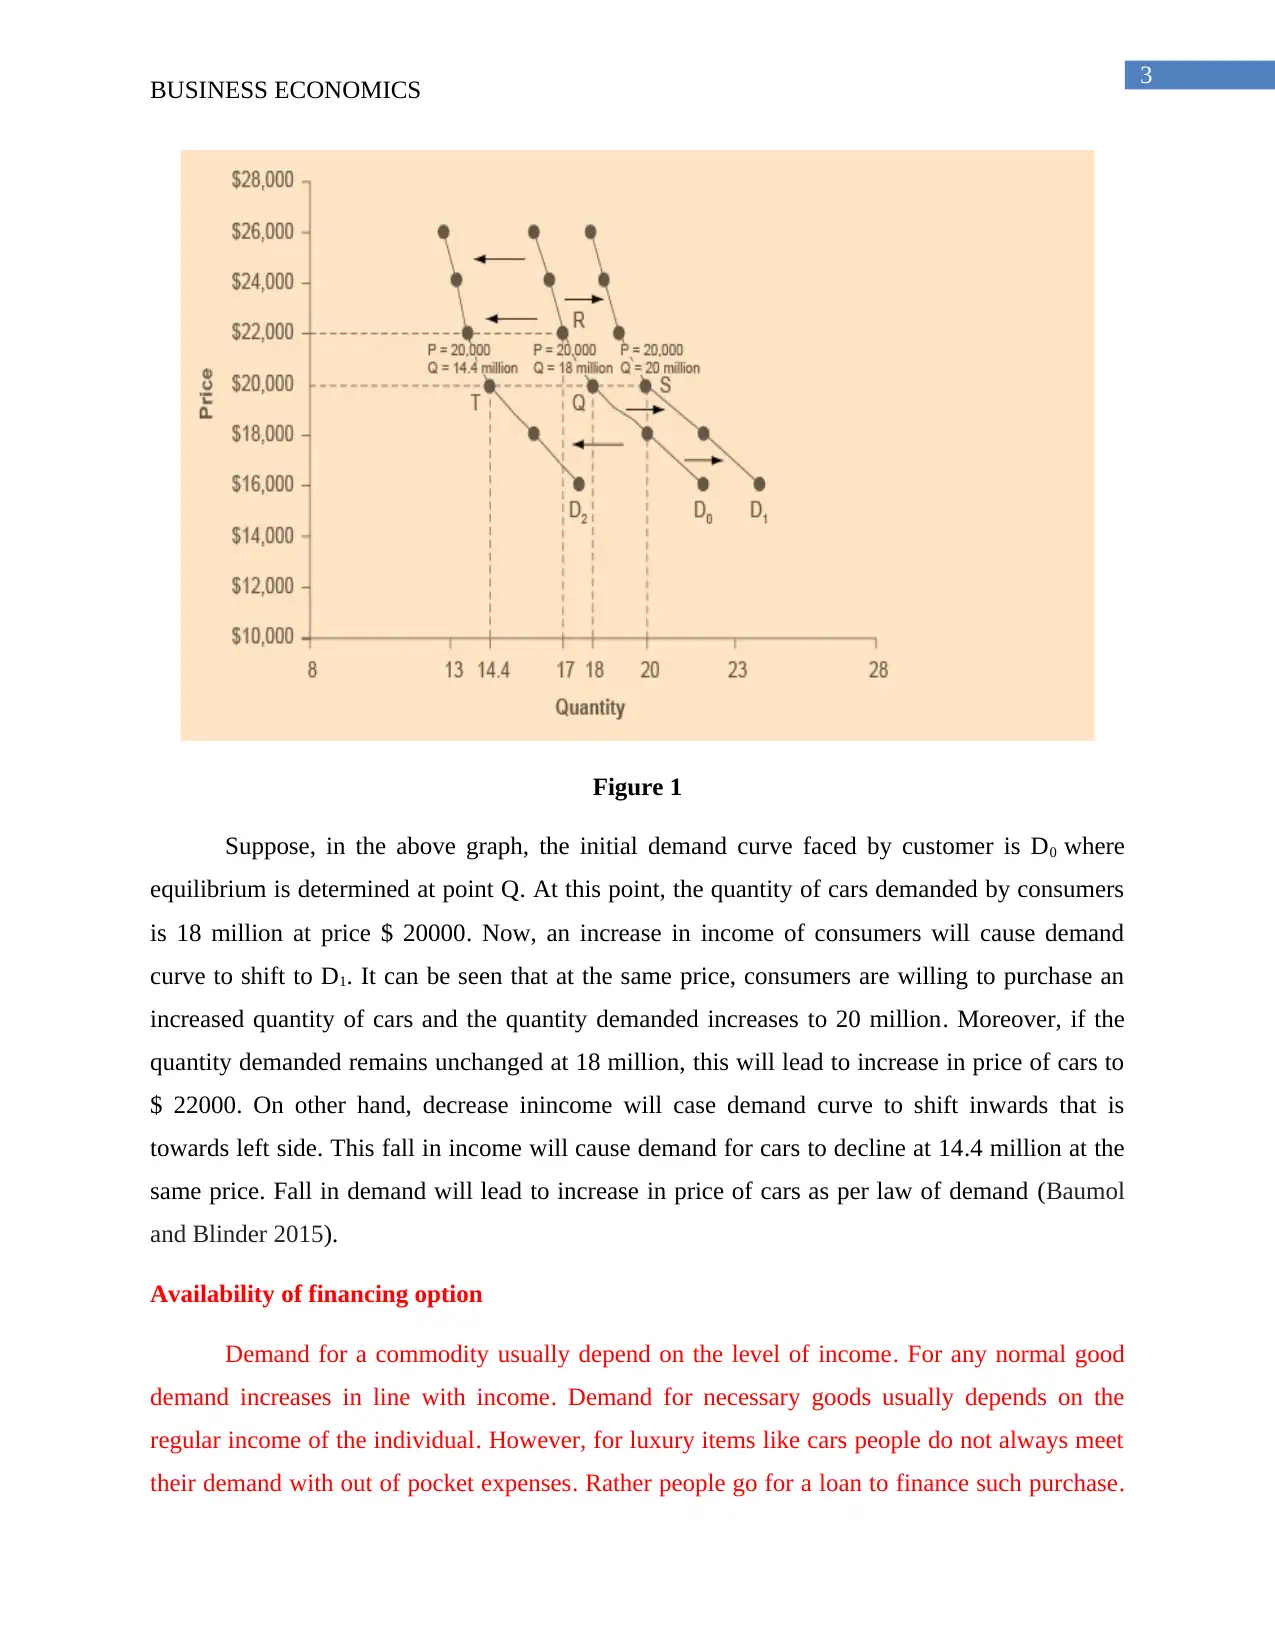
Suppose, in the above graph, the initial demand curve faced by customer is D0 where
equilibrium is determined at point Q. At this point, the quantity of cars demanded by consumers
is 18 million at price $ 20000. Now, an increase in income of consumers will cause demand
curve to shift to D1. It can be seen that at the same price, consumers are willing to purchase an
increased quantity of cars and the quantity demanded increases to 20 million. Moreover, if the
quantity demanded remains unchanged at 18 million, this will lead to increase in price of cars to
$ 22000. On other hand, decrease inincome will case demand curve to shift inwards that is
towards left side. This fall in income will cause demand for cars to decline at 14.4 million at the
same price. Fall in demand will lead to increase in price of cars as per law of demand (Baumol
and Blinder 2015).
Availability of financing option
Demand for a commodity usually depend on the level of income. For any normal good
demand increases in line with income. Demand for necessary goods usually depends on the
regular income of the individual. However, for luxury items like cars people do not always meet
their demand with out of pocket expenses. Rather people go for a loan to finance such purchase.
BUSINESS ECONOMICS
Figure 1
Suppose, in the above graph, the initial demand curve faced by customer is D0 where
equilibrium is determined at point Q. At this point, the quantity of cars demanded by consumers
is 18 million at price $ 20000. Now, an increase in income of consumers will cause demand
curve to shift to D1. It can be seen that at the same price, consumers are willing to purchase an
increased quantity of cars and the quantity demanded increases to 20 million. Moreover, if the
quantity demanded remains unchanged at 18 million, this will lead to increase in price of cars to
$ 22000. On other hand, decrease inincome will case demand curve to shift inwards that is
towards left side. This fall in income will cause demand for cars to decline at 14.4 million at the
same price. Fall in demand will lead to increase in price of cars as per law of demand (Baumol
and Blinder 2015).
Availability of financing option
Demand for a commodity usually depend on the level of income. For any normal good
demand increases in line with income. Demand for necessary goods usually depends on the
regular income of the individual. However, for luxury items like cars people do not always meet
their demand with out of pocket expenses. Rather people go for a loan to finance such purchase.
Paraphrase This Document
Need a fresh take? Get an instant paraphrase of this document with our AI Paraphraser
4
BUSINESS ECONOMICS
Therefore, the available financing option is an important determinant of demand in the car
market. The cost of borrowing is the interest rate that has to be repay for the loan taken. A lower
interest rate implies a lower cost of borrowing. As the borrowing cost reduces, is becomes a
lucrative option for people to borrow funds to finance car expenses (Maurice and Thomas 2015).
Consequently, rate of interest on borrowed capital has an inverse relation with car demand.
Lower the interest rate higher is the car demand and vice versa.
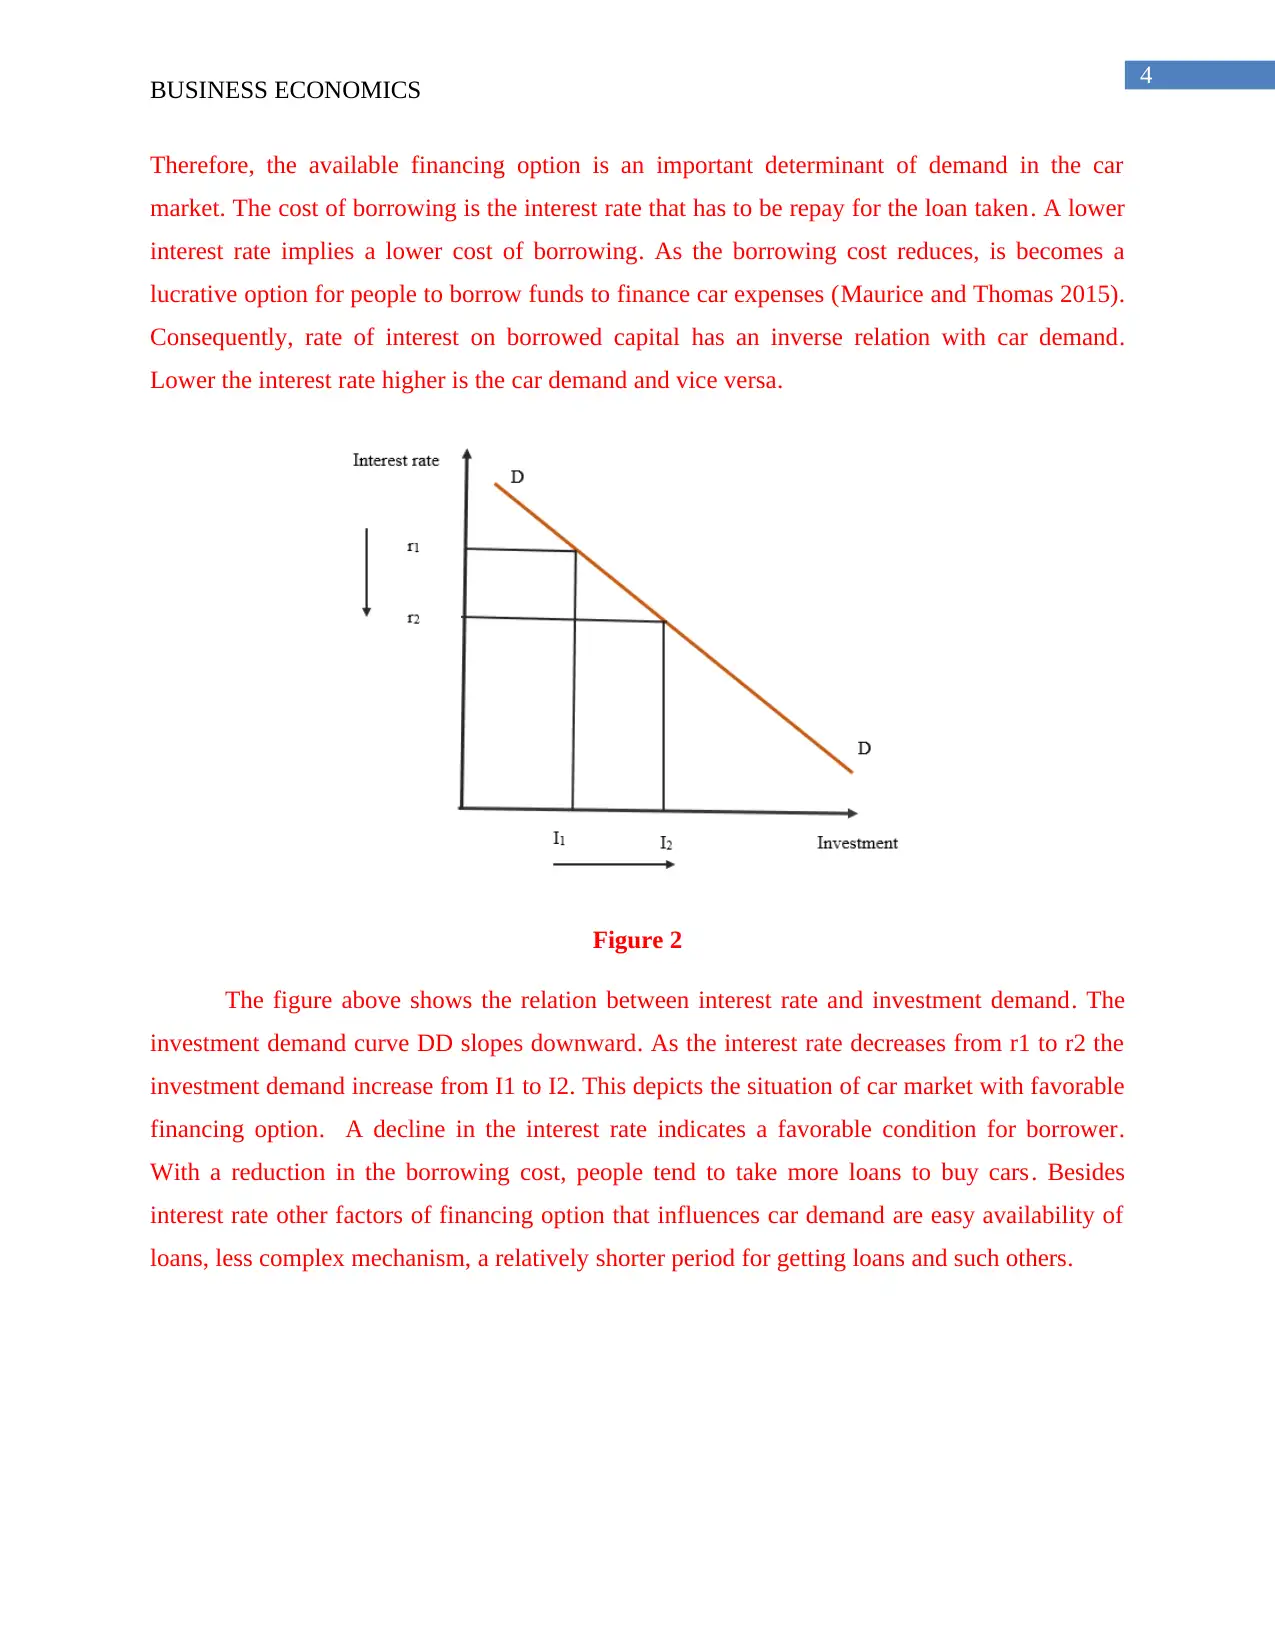
Figure 2
The figure above shows the relation between interest rate and investment demand. The
investment demand curve DD slopes downward. As the interest rate decreases from r1 to r2 the
investment demand increase from I1 to I2. This depicts the situation of car market with favorable
financing option. A decline in the interest rate indicates a favorable condition for borrower.
With a reduction in the borrowing cost, people tend to take more loans to buy cars. Besides
interest rate other factors of financing option that influences car demand are easy availability of
loans, less complex mechanism, a relatively shorter period for getting loans and such others.
BUSINESS ECONOMICS
Therefore, the available financing option is an important determinant of demand in the car
market. The cost of borrowing is the interest rate that has to be repay for the loan taken. A lower
interest rate implies a lower cost of borrowing. As the borrowing cost reduces, is becomes a
lucrative option for people to borrow funds to finance car expenses (Maurice and Thomas 2015).
Consequently, rate of interest on borrowed capital has an inverse relation with car demand.
Lower the interest rate higher is the car demand and vice versa.
Figure 2
The figure above shows the relation between interest rate and investment demand. The
investment demand curve DD slopes downward. As the interest rate decreases from r1 to r2 the
investment demand increase from I1 to I2. This depicts the situation of car market with favorable
financing option. A decline in the interest rate indicates a favorable condition for borrower.
With a reduction in the borrowing cost, people tend to take more loans to buy cars. Besides
interest rate other factors of financing option that influences car demand are easy availability of
loans, less complex mechanism, a relatively shorter period for getting loans and such others.
5
BUSINESS ECONOMICS
Price of related goods
Apart from own price, price of a commodity depends on the price of the related products
classified as substitutes and complementary goods. When price of substitute goods increases,
then demand for the concerned product decreases leading to a rise in the demand for substitute
good. However, the relation is inverse in case of complementary goods. With increases in price
of complementary good demand for both the concerned product and its substitute items
decreases. A complementary product of car is petrol or diesel used as fuel in the car engines
(Nicholson and Snyder 2014). When fuel price increases then people want to cut their spending
on fuels. This automatically reduces car demand. In the car market, fuel price is thus an
important determinant of demand. With increase in fuel price car demand reduces and vice versa.
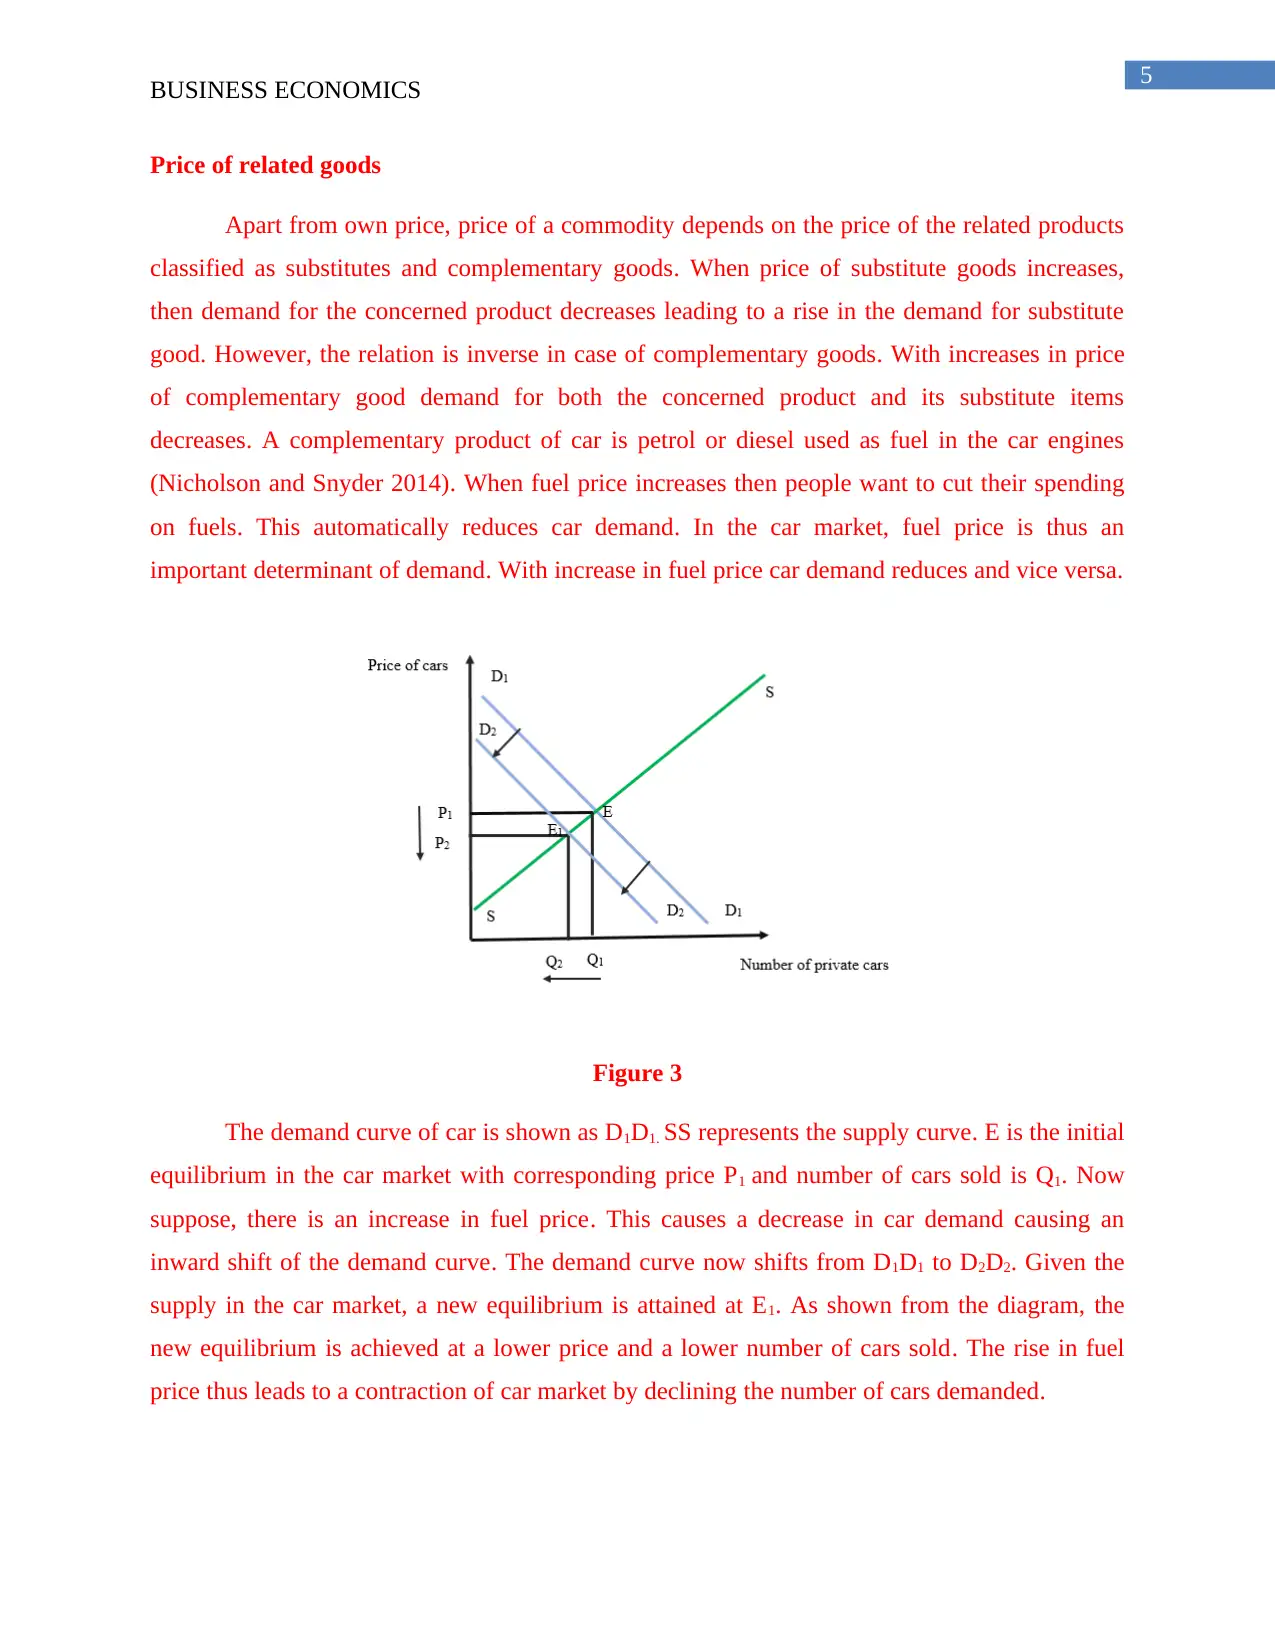
Figure 3
The demand curve of car is shown as D1D1. SS represents the supply curve. E is the initial
equilibrium in the car market with corresponding price P1 and number of cars sold is Q1. Now
suppose, there is an increase in fuel price. This causes a decrease in car demand causing an
inward shift of the demand curve. The demand curve now shifts from D1D1 to D2D2. Given the
supply in the car market, a new equilibrium is attained at E1. As shown from the diagram, the
new equilibrium is achieved at a lower price and a lower number of cars sold. The rise in fuel
price thus leads to a contraction of car market by declining the number of cars demanded.
BUSINESS ECONOMICS
Price of related goods
Apart from own price, price of a commodity depends on the price of the related products
classified as substitutes and complementary goods. When price of substitute goods increases,
then demand for the concerned product decreases leading to a rise in the demand for substitute
good. However, the relation is inverse in case of complementary goods. With increases in price
of complementary good demand for both the concerned product and its substitute items
decreases. A complementary product of car is petrol or diesel used as fuel in the car engines
(Nicholson and Snyder 2014). When fuel price increases then people want to cut their spending
on fuels. This automatically reduces car demand. In the car market, fuel price is thus an
important determinant of demand. With increase in fuel price car demand reduces and vice versa.
Figure 3
The demand curve of car is shown as D1D1. SS represents the supply curve. E is the initial
equilibrium in the car market with corresponding price P1 and number of cars sold is Q1. Now
suppose, there is an increase in fuel price. This causes a decrease in car demand causing an
inward shift of the demand curve. The demand curve now shifts from D1D1 to D2D2. Given the
supply in the car market, a new equilibrium is attained at E1. As shown from the diagram, the
new equilibrium is achieved at a lower price and a lower number of cars sold. The rise in fuel
price thus leads to a contraction of car market by declining the number of cars demanded.
⊘ This is a preview!⊘
Do you want full access?
Subscribe today to unlock all pages.
Trusted by 1+ million students worldwide
6
BUSINESS ECONOMICS
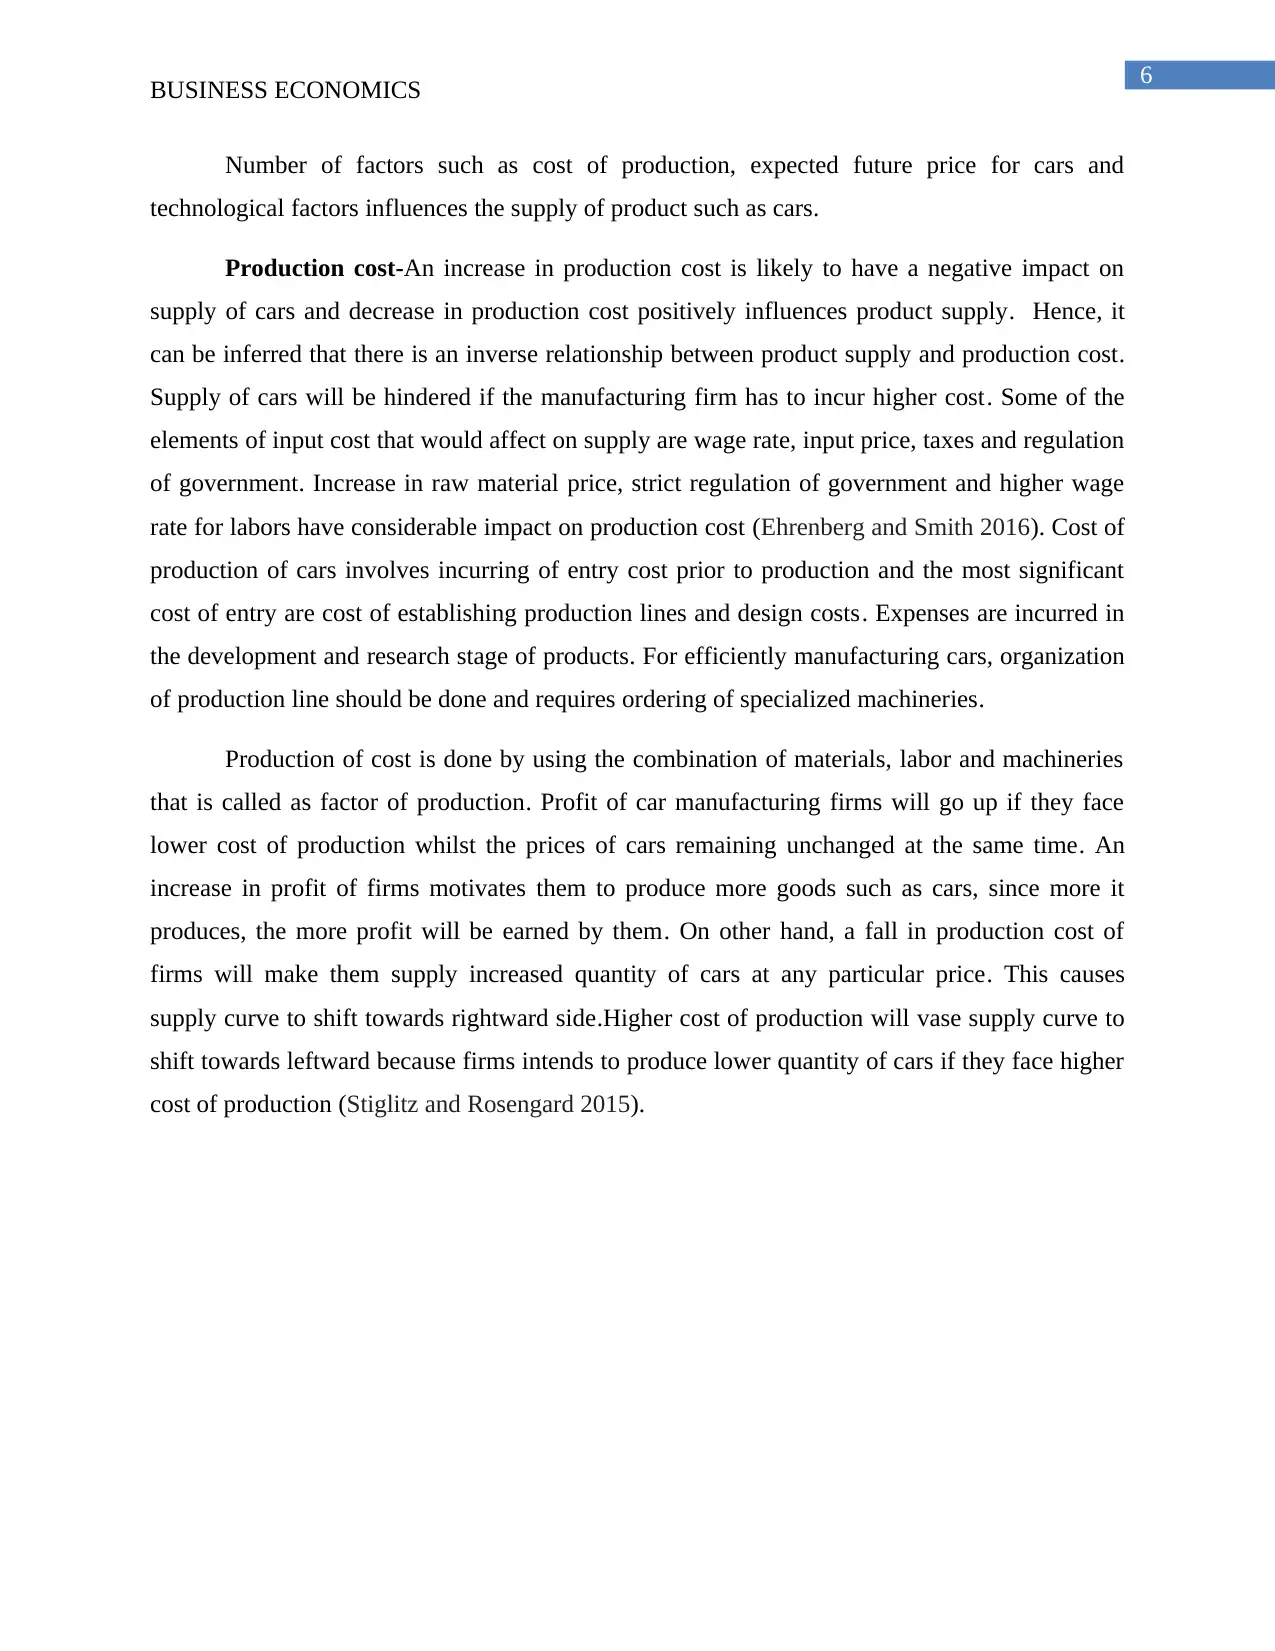
Number of factors such as cost of production, expected future price for cars and
technological factors influences the supply of product such as cars.
Production cost-An increase in production cost is likely to have a negative impact on
supply of cars and decrease in production cost positively influences product supply. Hence, it
can be inferred that there is an inverse relationship between product supply and production cost.
Supply of cars will be hindered if the manufacturing firm has to incur higher cost. Some of the
elements of input cost that would affect on supply are wage rate, input price, taxes and regulation
of government. Increase in raw material price, strict regulation of government and higher wage
rate for labors have considerable impact on production cost (Ehrenberg and Smith 2016). Cost of
production of cars involves incurring of entry cost prior to production and the most significant
cost of entry are cost of establishing production lines and design costs. Expenses are incurred in
the development and research stage of products. For efficiently manufacturing cars, organization
of production line should be done and requires ordering of specialized machineries.
Production of cost is done by using the combination of materials, labor and machineries
that is called as factor of production. Profit of car manufacturing firms will go up if they face
lower cost of production whilst the prices of cars remaining unchanged at the same time. An
increase in profit of firms motivates them to produce more goods such as cars, since more it
produces, the more profit will be earned by them. On other hand, a fall in production cost of
firms will make them supply increased quantity of cars at any particular price. This causes
supply curve to shift towards rightward side.Higher cost of production will vase supply curve to
shift towards leftward because firms intends to produce lower quantity of cars if they face higher
cost of production (Stiglitz and Rosengard 2015).
BUSINESS ECONOMICS
Number of factors such as cost of production, expected future price for cars and
technological factors influences the supply of product such as cars.
Production cost-An increase in production cost is likely to have a negative impact on
supply of cars and decrease in production cost positively influences product supply. Hence, it
can be inferred that there is an inverse relationship between product supply and production cost.
Supply of cars will be hindered if the manufacturing firm has to incur higher cost. Some of the
elements of input cost that would affect on supply are wage rate, input price, taxes and regulation
of government. Increase in raw material price, strict regulation of government and higher wage
rate for labors have considerable impact on production cost (Ehrenberg and Smith 2016). Cost of
production of cars involves incurring of entry cost prior to production and the most significant
cost of entry are cost of establishing production lines and design costs. Expenses are incurred in
the development and research stage of products. For efficiently manufacturing cars, organization
of production line should be done and requires ordering of specialized machineries.
Production of cost is done by using the combination of materials, labor and machineries
that is called as factor of production. Profit of car manufacturing firms will go up if they face
lower cost of production whilst the prices of cars remaining unchanged at the same time. An
increase in profit of firms motivates them to produce more goods such as cars, since more it
produces, the more profit will be earned by them. On other hand, a fall in production cost of
firms will make them supply increased quantity of cars at any particular price. This causes
supply curve to shift towards rightward side.Higher cost of production will vase supply curve to
shift towards leftward because firms intends to produce lower quantity of cars if they face higher
cost of production (Stiglitz and Rosengard 2015).
Paraphrase This Document
Need a fresh take? Get an instant paraphrase of this document with our AI Paraphraser
7
BUSINESS ECONOMICS
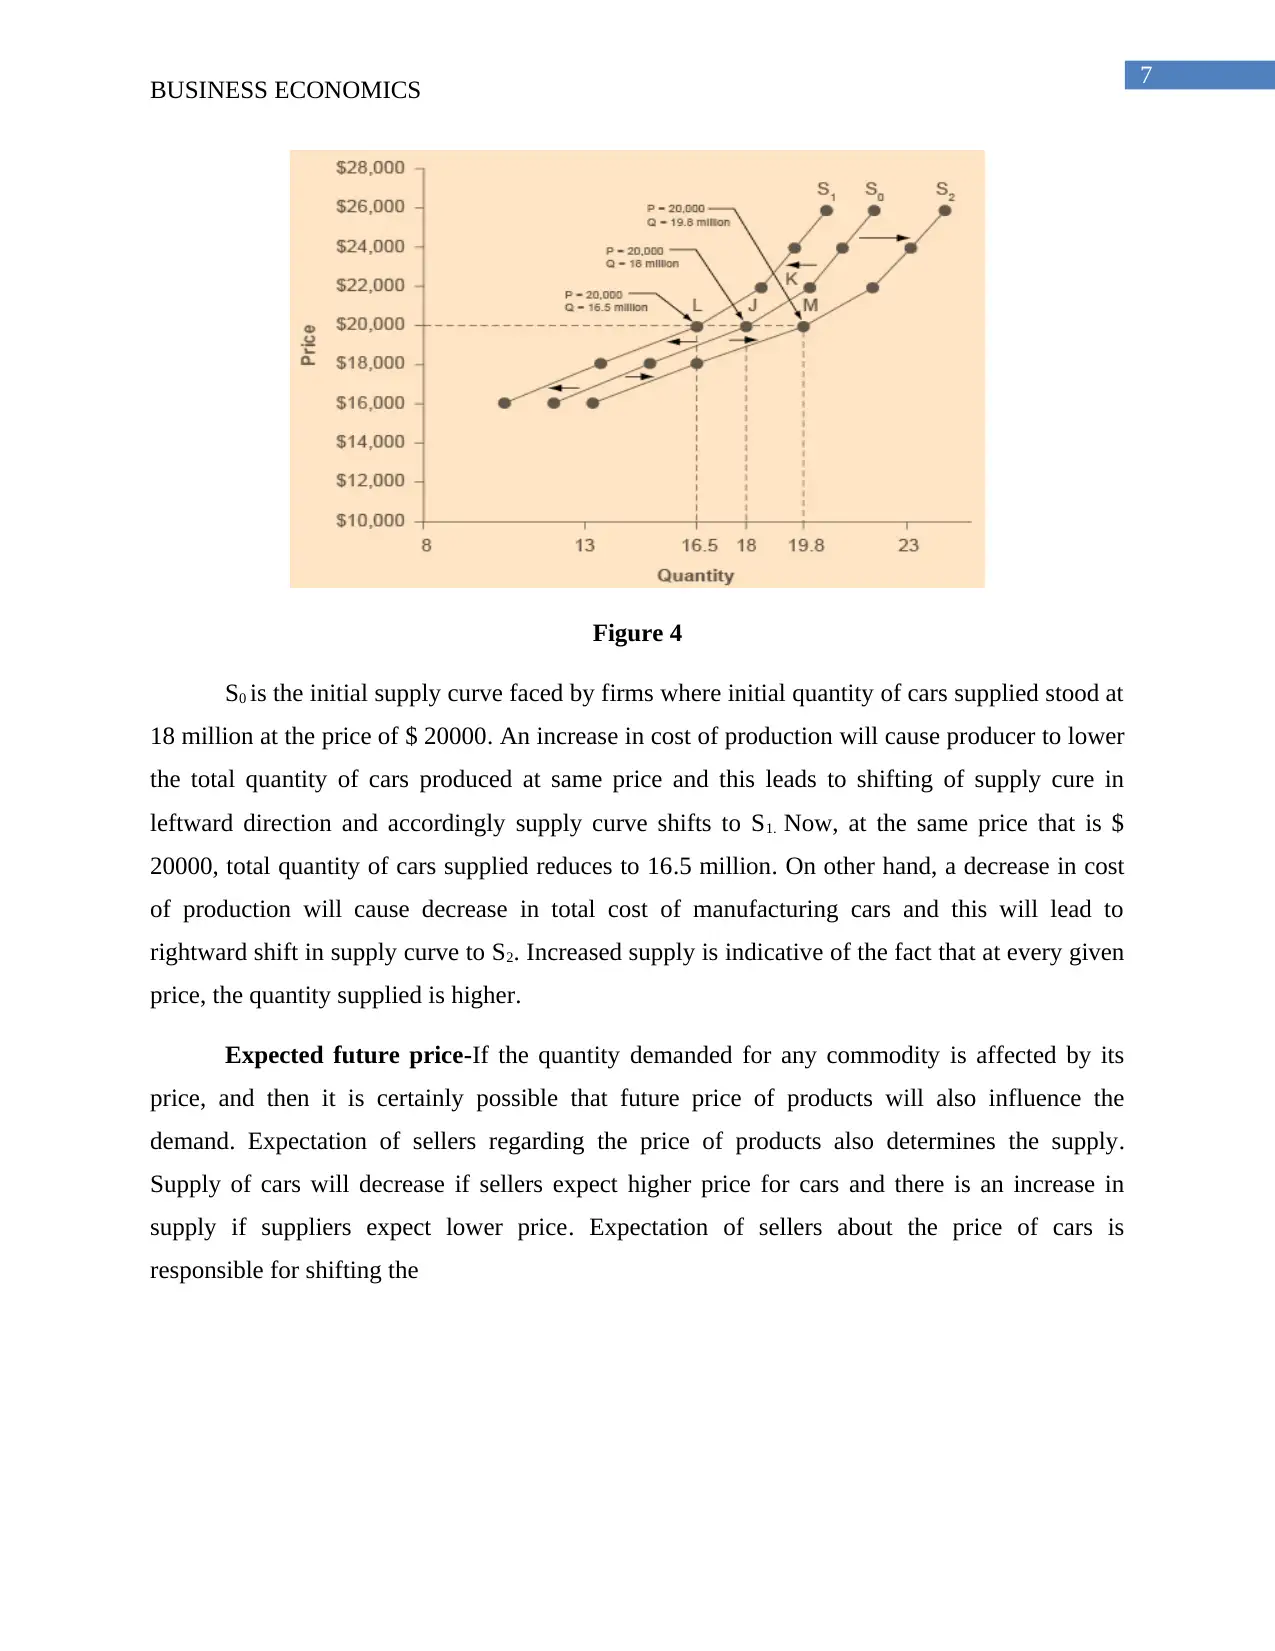
Figure 4
S0 is the initial supply curve faced by firms where initial quantity of cars supplied stood at
18 million at the price of $ 20000. An increase in cost of production will cause producer to lower
the total quantity of cars produced at same price and this leads to shifting of supply cure in
leftward direction and accordingly supply curve shifts to S1. Now, at the same price that is $
20000, total quantity of cars supplied reduces to 16.5 million. On other hand, a decrease in cost
of production will cause decrease in total cost of manufacturing cars and this will lead to
rightward shift in supply curve to S2. Increased supply is indicative of the fact that at every given
price, the quantity supplied is higher.
Expected future price-If the quantity demanded for any commodity is affected by its
price, and then it is certainly possible that future price of products will also influence the
demand. Expectation of sellers regarding the price of products also determines the supply.
Supply of cars will decrease if sellers expect higher price for cars and there is an increase in
supply if suppliers expect lower price. Expectation of sellers about the price of cars is
responsible for shifting the
BUSINESS ECONOMICS
Figure 4
S0 is the initial supply curve faced by firms where initial quantity of cars supplied stood at
18 million at the price of $ 20000. An increase in cost of production will cause producer to lower
the total quantity of cars produced at same price and this leads to shifting of supply cure in
leftward direction and accordingly supply curve shifts to S1. Now, at the same price that is $
20000, total quantity of cars supplied reduces to 16.5 million. On other hand, a decrease in cost
of production will cause decrease in total cost of manufacturing cars and this will lead to
rightward shift in supply curve to S2. Increased supply is indicative of the fact that at every given
price, the quantity supplied is higher.
Expected future price-If the quantity demanded for any commodity is affected by its
price, and then it is certainly possible that future price of products will also influence the
demand. Expectation of sellers regarding the price of products also determines the supply.
Supply of cars will decrease if sellers expect higher price for cars and there is an increase in
supply if suppliers expect lower price. Expectation of sellers about the price of cars is
responsible for shifting the
8
BUSINESS ECONOMICS
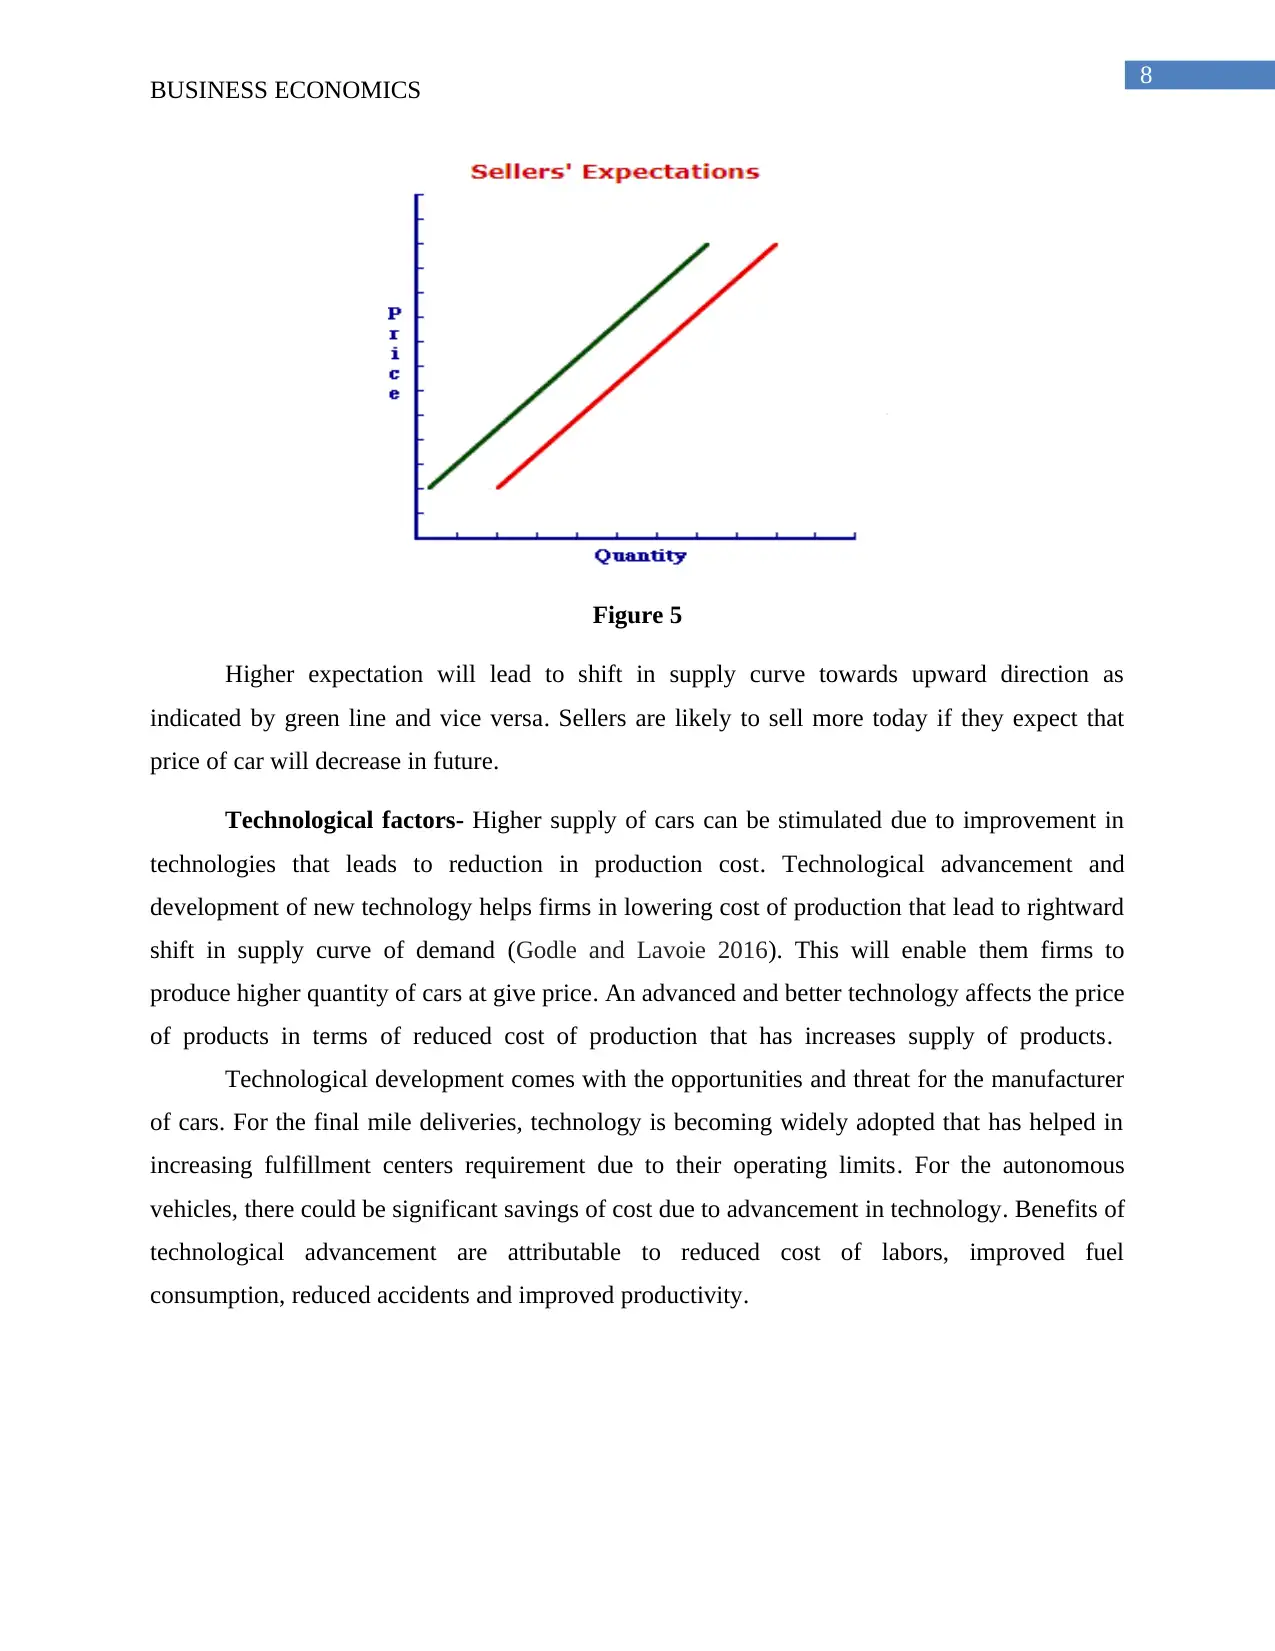
Figure 5
Higher expectation will lead to shift in supply curve towards upward direction as
indicated by green line and vice versa. Sellers are likely to sell more today if they expect that
price of car will decrease in future.
Technological factors- Higher supply of cars can be stimulated due to improvement in
technologies that leads to reduction in production cost. Technological advancement and
development of new technology helps firms in lowering cost of production that lead to rightward
shift in supply curve of demand (Godle and Lavoie 2016). This will enable them firms to
produce higher quantity of cars at give price. An advanced and better technology affects the price
of products in terms of reduced cost of production that has increases supply of products.
Technological development comes with the opportunities and threat for the manufacturer
of cars. For the final mile deliveries, technology is becoming widely adopted that has helped in
increasing fulfillment centers requirement due to their operating limits. For the autonomous
vehicles, there could be significant savings of cost due to advancement in technology. Benefits of
technological advancement are attributable to reduced cost of labors, improved fuel
consumption, reduced accidents and improved productivity.
BUSINESS ECONOMICS
Figure 5
Higher expectation will lead to shift in supply curve towards upward direction as
indicated by green line and vice versa. Sellers are likely to sell more today if they expect that
price of car will decrease in future.
Technological factors- Higher supply of cars can be stimulated due to improvement in
technologies that leads to reduction in production cost. Technological advancement and
development of new technology helps firms in lowering cost of production that lead to rightward
shift in supply curve of demand (Godle and Lavoie 2016). This will enable them firms to
produce higher quantity of cars at give price. An advanced and better technology affects the price
of products in terms of reduced cost of production that has increases supply of products.
Technological development comes with the opportunities and threat for the manufacturer
of cars. For the final mile deliveries, technology is becoming widely adopted that has helped in
increasing fulfillment centers requirement due to their operating limits. For the autonomous
vehicles, there could be significant savings of cost due to advancement in technology. Benefits of
technological advancement are attributable to reduced cost of labors, improved fuel
consumption, reduced accidents and improved productivity.
⊘ This is a preview!⊘
Do you want full access?
Subscribe today to unlock all pages.
Trusted by 1+ million students worldwide
9
BUSINESS ECONOMICS
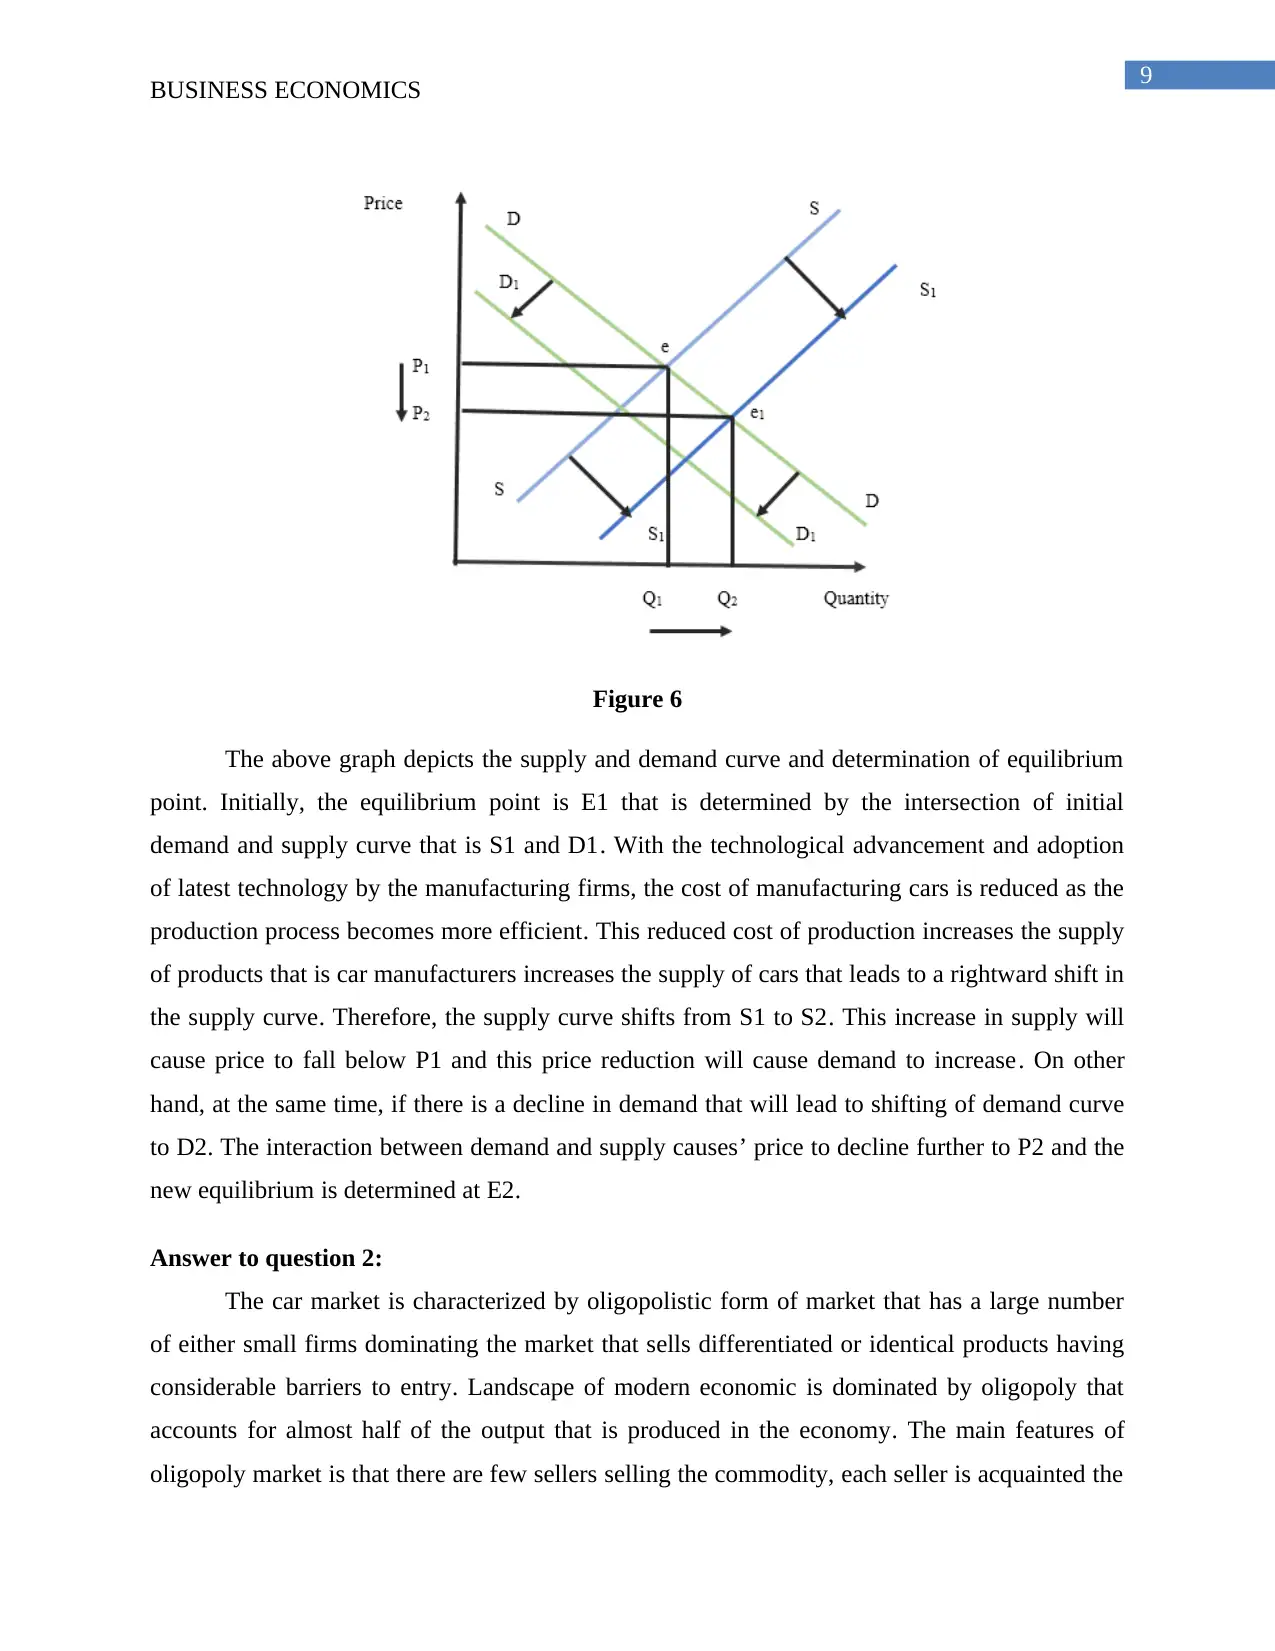
Figure 6
The above graph depicts the supply and demand curve and determination of equilibrium
point. Initially, the equilibrium point is E1 that is determined by the intersection of initial
demand and supply curve that is S1 and D1. With the technological advancement and adoption
of latest technology by the manufacturing firms, the cost of manufacturing cars is reduced as the
production process becomes more efficient. This reduced cost of production increases the supply
of products that is car manufacturers increases the supply of cars that leads to a rightward shift in
the supply curve. Therefore, the supply curve shifts from S1 to S2. This increase in supply will
cause price to fall below P1 and this price reduction will cause demand to increase. On other
hand, at the same time, if there is a decline in demand that will lead to shifting of demand curve
to D2. The interaction between demand and supply causes’ price to decline further to P2 and the
new equilibrium is determined at E2.
Answer to question 2:
The car market is characterized by oligopolistic form of market that has a large number
of either small firms dominating the market that sells differentiated or identical products having
considerable barriers to entry. Landscape of modern economic is dominated by oligopoly that
accounts for almost half of the output that is produced in the economy. The main features of
oligopoly market is that there are few sellers selling the commodity, each seller is acquainted the
BUSINESS ECONOMICS
Figure 6
The above graph depicts the supply and demand curve and determination of equilibrium
point. Initially, the equilibrium point is E1 that is determined by the intersection of initial
demand and supply curve that is S1 and D1. With the technological advancement and adoption
of latest technology by the manufacturing firms, the cost of manufacturing cars is reduced as the
production process becomes more efficient. This reduced cost of production increases the supply
of products that is car manufacturers increases the supply of cars that leads to a rightward shift in
the supply curve. Therefore, the supply curve shifts from S1 to S2. This increase in supply will
cause price to fall below P1 and this price reduction will cause demand to increase. On other
hand, at the same time, if there is a decline in demand that will lead to shifting of demand curve
to D2. The interaction between demand and supply causes’ price to decline further to P2 and the
new equilibrium is determined at E2.
Answer to question 2:
The car market is characterized by oligopolistic form of market that has a large number
of either small firms dominating the market that sells differentiated or identical products having
considerable barriers to entry. Landscape of modern economic is dominated by oligopoly that
accounts for almost half of the output that is produced in the economy. The main features of
oligopoly market is that there are few sellers selling the commodity, each seller is acquainted the
Paraphrase This Document
Need a fresh take? Get an instant paraphrase of this document with our AI Paraphraser
10
BUSINESS ECONOMICS
competitors individually in the market. Market control is attained and retained by firm in the
oligopoly market through barriers of entry (asia.nikkei.com 2018). Some of the common barriers
to entry in the car market are recognition of brand name, resource ownership, patents,
government franchise and decreasing average cost.
Market failure is caused by usage of cars and market and failure of market occurs when
the economic efficiency is not achieved by market operation. Market failure refers to a situation
when the best use of scare resources is not produced by free market. Externalities are one of the
causes of market failure and externalities referred to as the external benefits and costs that are
incurred on the third party that does not form the part of exchange of goods and services
(asia.nikkei.com 2018). Usage of cars tends to lead to failure of market that is generally demerit
goods. The reason is attributable to the fact that using cars emit gases that are responsible for
polluting the environment. This has the consequences in terms of imposition of costs on
healthcare that do not use the cars. Market failures are caused by externalities if the full social
benefits and social costs of consumption and production are not taken into account by the price
mechanisms.
Market failure has become an increasingly important topic that results due to
imperfections in mechanism of market when there is inefficient allocation of resources.
Productive efficiency and allocative efficiency are the two types of efficiency that is associated
with failure of market. Efficiency in production is achieved when the production is done at the
lowest level of costs. Allocative efficiency on other hand is efficiency that is associated with the
occurrence of resource distribution that consumers cannot be better off if the other consumers are
not worst off (Stiglitz and Rosengard 2015). The externalities that are associated with car market
are related to fuel combustion and emission of greenhouse gases and other are related to location,
extent and timing of travel. Use and production of automobiles creates than negative externalities
that are more than pollution. Several firms in the market are able to match the high demands of
car population by high supply of automobiles. Other than pollution created by cars, increased
usage of cars has increased urban flooding chances. This increase in urban flooding is associated
with higher demand for land that is required for related car structures and parking lots due to rise
in car usage. The consequence is occurrence of frequent flooding, as the earth around such areas
will not be able to soak majority of rainfalls.
11
BUSINESS ECONOMICS
Negative externalities in the car market are the costs that arise from economic
transactions that is negatively affecting the third parties and other groups. It is indicative of the
fact that when such commodities are produced, it has the certainty of adversely influencing the
third parties in terms of flooding and case pollution. With negative externalities in society,
supply of car in the market is at equilibrium for the car and firm industry. The optimum of car
that is demanded by customers is lower than the cost of constructing road and cars. This depicts
that although the firms are producing at efficiency level of optimum level, production is not done
at the optimum level of society. It has the consequence of making the system inefficient leading
it to market failure. Occurrence of market failure is the impact of under and over allocation of
resources. In this particular situation, market failure occurs because of flooding is caused by over
allocation of cars and roads that results in market failure (Valentin 2017).
The marginal social cost is greater than private marginal cost when there is existence of
negative production externalities.
⊘ This is a preview!⊘
Do you want full access?
Subscribe today to unlock all pages.
Trusted by 1+ million students worldwide
1 out of 31
Related Documents


Your All-in-One AI-Powered Toolkit for Academic Success.
+13062052269
info@desklib.com
Available 24*7 on WhatsApp / Email
![[object Object]](/_next/static/media/star-bottom.7253800d.svg)
Unlock your academic potential
Copyright © 2020–2026 A2Z Services. All Rights Reserved. Developed and managed by ZUCOL.