Business Economics Report: Apple iPhone Market and Economic Analysis
VerifiedAdded on 2023/01/18
|12
|3329
|40
Report
AI Summary
This report provides a comprehensive analysis of the business economics of the Apple iPhone, covering both microeconomic and macroeconomic aspects. Part A delves into microeconomic concepts such as price elasticity of demand, examining the determinants of demand for the iPhone and the potential revenue benefits of price reductions. It also explores market competition, specifically the monopolistic competition model in the gaming industry and Apple's re-branding strategies. Part B continues with microeconomic issues, analyzing the impact of data-roaming charges and market failures. Part C shifts to macroeconomic considerations, focusing on UK economic growth and recession periods. The report provides insights into market dynamics, pricing strategies, and the broader economic environment impacting Apple's business decisions, incorporating factors like competition, consumer behavior, and ethical responsibilities.

Business
Economics
Economics
Paraphrase This Document
Need a fresh take? Get an instant paraphrase of this document with our AI Paraphraser
Table of Contents
INTRODUCTION...........................................................................................................................3
PART A – MICROECONOMICS...................................................................................................3
1. Price Elasticity of Demand:.....................................................................................................3
2. Main determinants of the price elasticity of demand for the Apple iPhone:...........................3
3. Apple benefit in terms of revenue from reducing prices:........................................................4
4. Perfect market competition-model:..........................................................................................5
5. Apple’s re-branding strategy:..................................................................................................5
PART B – MICROECONOMICS...................................................................................................6
6. ..................................................................................................................................................6
7....................................................................................................................................................7
8....................................................................................................................................................7
9....................................................................................................................................................7
PART C – MACROECONOMICS.................................................................................................8
10..................................................................................................................................................8
10. (a):..........................................................................................................................................9
10. (b):........................................................................................................................................10
10. (c).........................................................................................................................................10
10. (d):........................................................................................................................................11
CONCLUSION..............................................................................................................................11
REFERENCES..............................................................................................................................12
INTRODUCTION
Business economics is specific area of economics that uses economic principles and
numerical techniques to examine enterprises and variables that contribute to the heterogeneity of
corporate structures including business connections with employees, capital and consumer
markets. Business economics is important component of mainstream economics and this is an
enhancement of actual business conditions of economic theories (Biondi and Zambon, 2013). It
is a computational mathematics in the context of business's decision-making method and
management future forecasting. This study covers various aspects of macroeconomic and
microeconomic like price-elasticity of demand, supply and demand etc.
PART A – MICROECONOMICS
1. Price Elasticity of Demand:
Price elasticity of demand refers to economical measurement of fluctuations in product's
demand or purchase with relation to fluctuation in product's price. In formula equation it is
shown as:
Price Elasticity of Demand = % Change in Quantity Demanded / % Change in Price
Economists utilize price-elasticity to explain how supplies or demands changes due to price
fluctuations to recognize real economy performance. If product's requested quantity experiences
a substantial shift in reaction to price movements, it is called "elastic," i.e. quantity extended far
beyond its preceding level. If bought quantity has a slight shift in reaction to its value, it is called
"inelastic;" or quantities has not extended dramatically from its preceding level. The principle of
demand elasticity is very important in deciding prices of different production variables.
Production variables are compensated as per demand elasticity. if a determinant's demand is
inelastic, its value will be strong as well as its price would be lower when it is elastic. Once a
distributor or supplier recognizes the Market Elasticity of Demand for their product, when they
have to adjust price of product, this can enable them assess their increase in Net revenue. Overall
revenue is number of items that are purchased multiplied by the price at which they are sold.
2. Main determinants of the price elasticity of demand for the Apple iPhone:
Relationships between price and demand of a product depends on different factors. These
factors impacts product's demand directly and indirectly. Consideration of these factors is crucial
to determine the overall impact on price's elasticity of product's demand. Their impacts on
⊘ This is a preview!⊘
Do you want full access?
Subscribe today to unlock all pages.
Trusted by 1+ million students worldwide
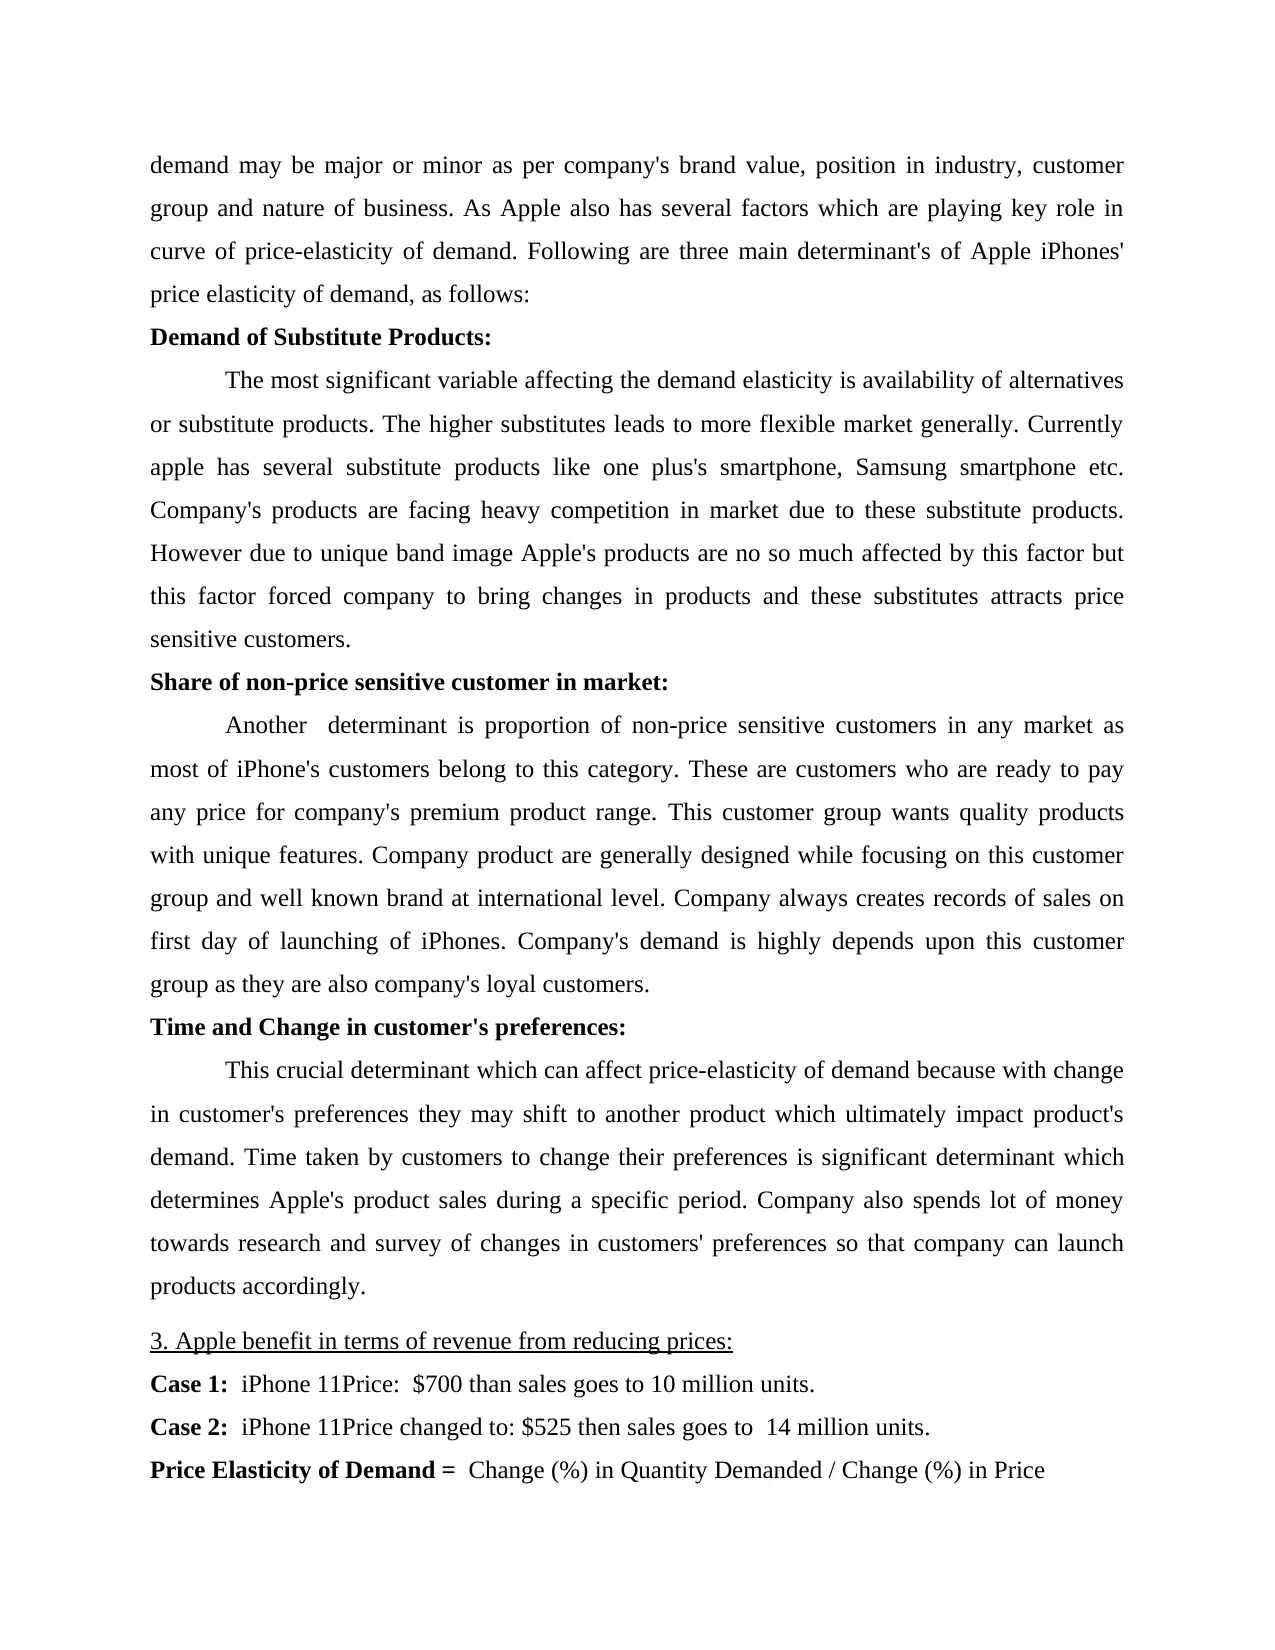
demand may be major or minor as per company's brand value, position in industry, customer
group and nature of business. As Apple also has several factors which are playing key role in
curve of price-elasticity of demand. Following are three main determinant's of Apple iPhones'
price elasticity of demand, as follows:
Demand of Substitute Products:
The most significant variable affecting the demand elasticity is availability of alternatives
or substitute products. The higher substitutes leads to more flexible market generally. Currently
apple has several substitute products like one plus's smartphone, Samsung smartphone etc.
Company's products are facing heavy competition in market due to these substitute products.
However due to unique band image Apple's products are no so much affected by this factor but
this factor forced company to bring changes in products and these substitutes attracts price
sensitive customers.
Share of non-price sensitive customer in market:
Another determinant is proportion of non-price sensitive customers in any market as
most of iPhone's customers belong to this category. These are customers who are ready to pay
any price for company's premium product range. This customer group wants quality products
with unique features. Company product are generally designed while focusing on this customer
group and well known brand at international level. Company always creates records of sales on
first day of launching of iPhones. Company's demand is highly depends upon this customer
group as they are also company's loyal customers.
Time and Change in customer's preferences:
This crucial determinant which can affect price-elasticity of demand because with change
in customer's preferences they may shift to another product which ultimately impact product's
demand. Time taken by customers to change their preferences is significant determinant which
determines Apple's product sales during a specific period. Company also spends lot of money
towards research and survey of changes in customers' preferences so that company can launch
products accordingly.
3. Apple benefit in terms of revenue from reducing prices:
Case 1: iPhone 11Price: $700 than sales goes to 10 million units.
Case 2: iPhone 11Price changed to: $525 then sales goes to 14 million units.
Price Elasticity of Demand = Change (%) in Quantity Demanded / Change (%) in Price
Paraphrase This Document
Need a fresh take? Get an instant paraphrase of this document with our AI Paraphraser
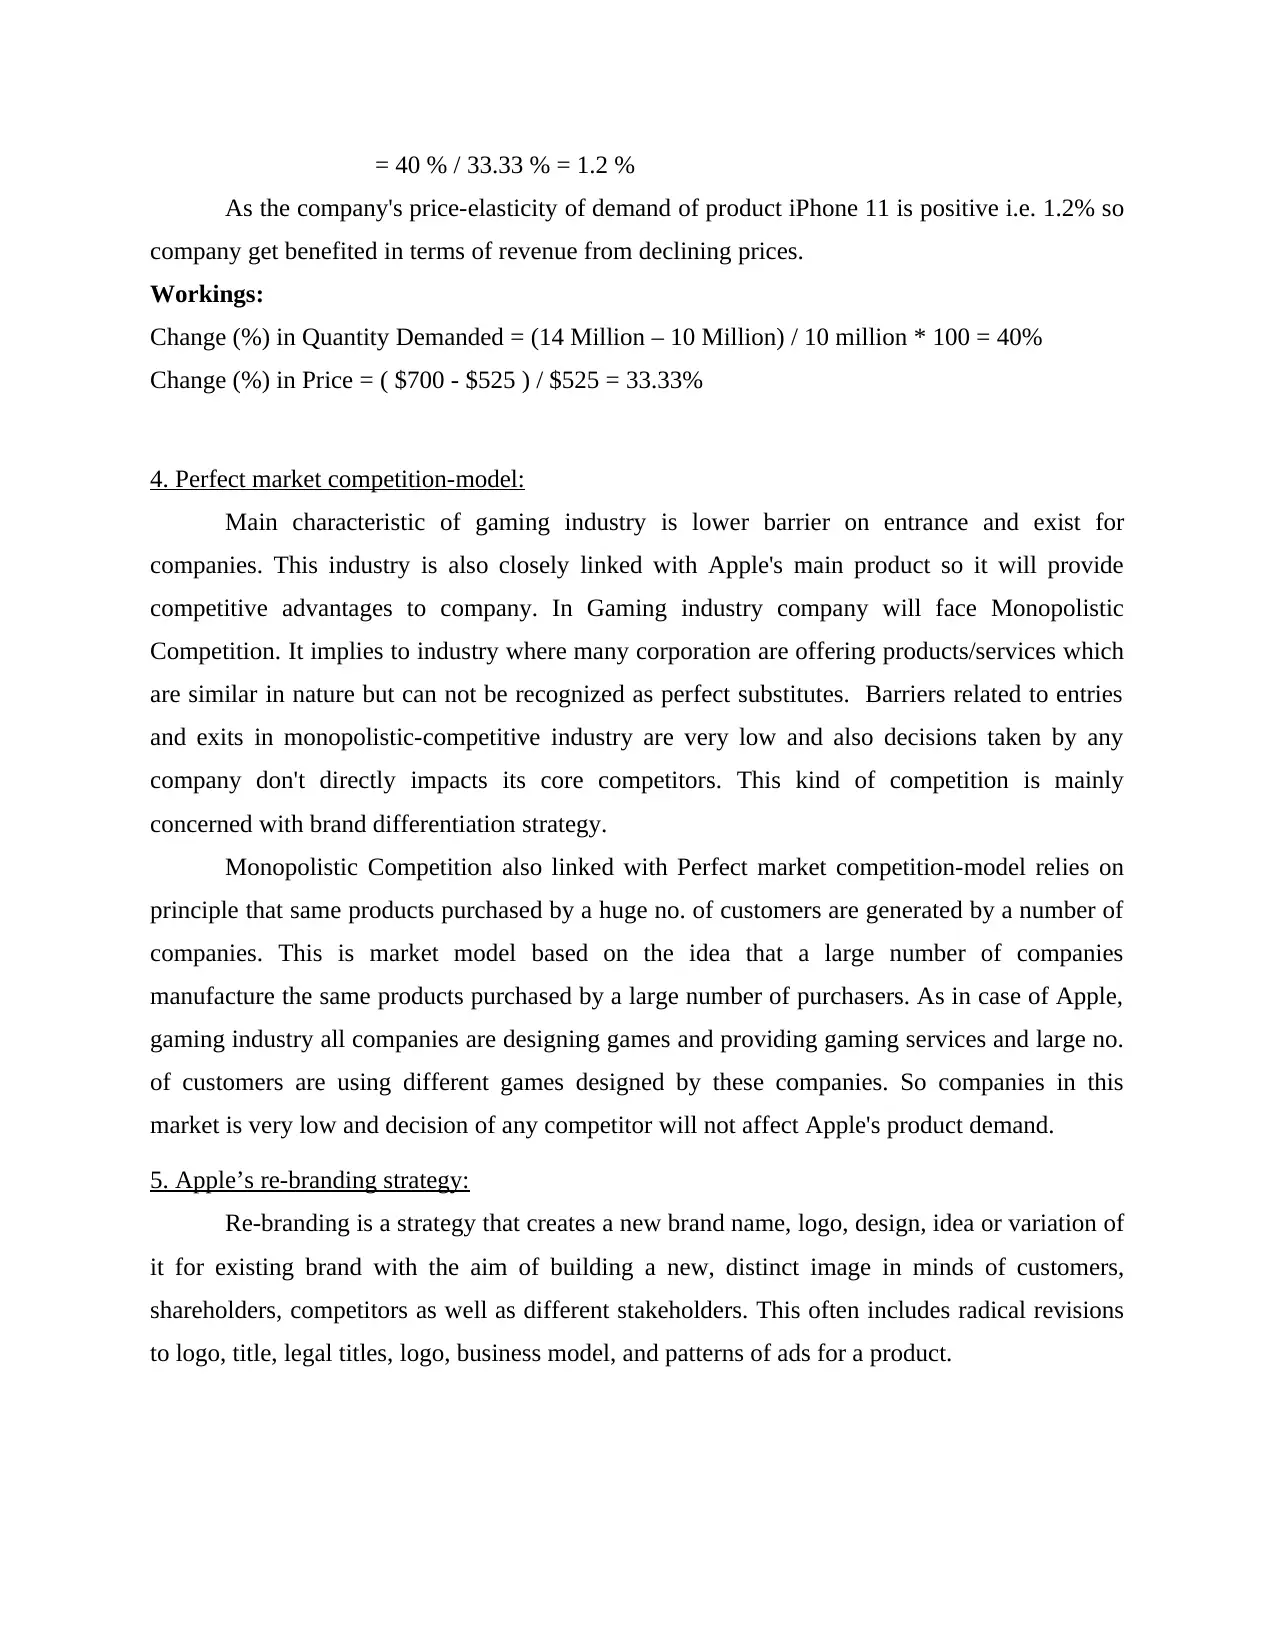
= 40 % / 33.33 % = 1.2 %
As the company's price-elasticity of demand of product iPhone 11 is positive i.e. 1.2% so
company get benefited in terms of revenue from declining prices.
Workings:
Change (%) in Quantity Demanded = (14 Million – 10 Million) / 10 million * 100 = 40%
Change (%) in Price = ( $700 - $525 ) / $525 = 33.33%
4. Perfect market competition-model:
Main characteristic of gaming industry is lower barrier on entrance and exist for
companies. This industry is also closely linked with Apple's main product so it will provide
competitive advantages to company. In Gaming industry company will face Monopolistic
Competition. It implies to industry where many corporation are offering products/services which
are similar in nature but can not be recognized as perfect substitutes. Barriers related to entries
and exits in monopolistic-competitive industry are very low and also decisions taken by any
company don't directly impacts its core competitors. This kind of competition is mainly
concerned with brand differentiation strategy.
Monopolistic Competition also linked with Perfect market competition-model relies on
principle that same products purchased by a huge no. of customers are generated by a number of
companies. This is market model based on the idea that a large number of companies
manufacture the same products purchased by a large number of purchasers. As in case of Apple,
gaming industry all companies are designing games and providing gaming services and large no.
of customers are using different games designed by these companies. So companies in this
market is very low and decision of any competitor will not affect Apple's product demand.
5. Apple’s re-branding strategy:
Re-branding is a strategy that creates a new brand name, logo, design, idea or variation of
it for existing brand with the aim of building a new, distinct image in minds of customers,
shareholders, competitors as well as different stakeholders. This often includes radical revisions
to logo, title, legal titles, logo, business model, and patterns of ads for a product.
PART B – MICROECONOMICS
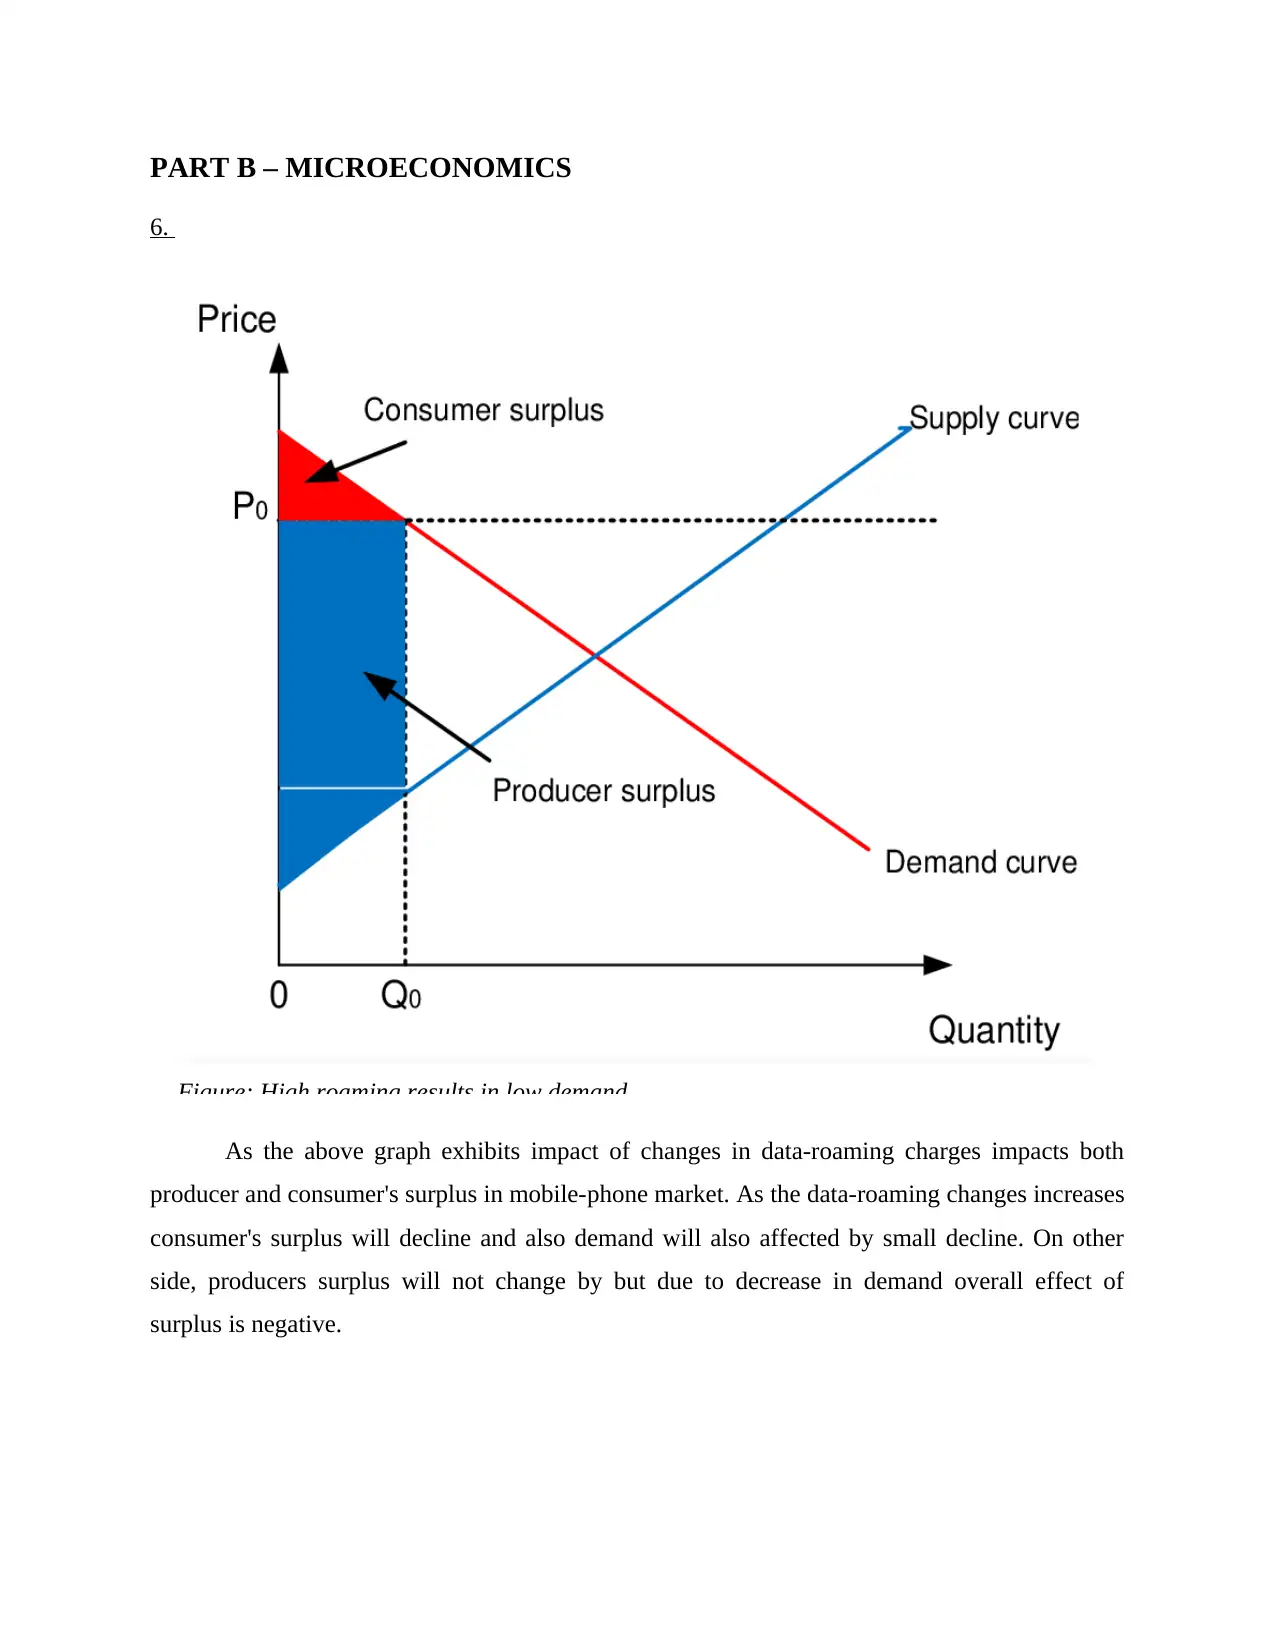
6.
As the above graph exhibits impact of changes in data-roaming charges impacts both
producer and consumer's surplus in mobile-phone market. As the data-roaming changes increases
consumer's surplus will decline and also demand will also affected by small decline. On other
side, producers surplus will not change by but due to decrease in demand overall effect of
surplus is negative.
Figure: High roaming results in low demand
⊘ This is a preview!⊘
Do you want full access?
Subscribe today to unlock all pages.
Trusted by 1+ million students worldwide
7.
European Union believed that step of data roaming charges was an illustration of market
failure. At least around 147 million EU residents currently are "roaming," i.e. using their cell
phones when exploring another European nation. Consumer groups assume that very large cross-
section of customers, including medium and small-sized companies (SMEs), will accept the
advantages of cheaper roaming charges. Average retail rates are around four times greater for
calls being made while roaming than that of the comparable prices for national phone calls. Such
value disparities could not be justified by operators ' cost variations. Mobile phone market is
developing rapidly with increasing technological developments and also numbers of users and
operators have been increased. But even with such a rapid growth in industry, increase in data
roaming charges indicates towards market failure. Because with growth in users, companies
should minimize rates of data but for covering the loss they are increasing data-roaming charges.
8.
The current regulation maintains price cap on charges applied by one operator to the next
for handling of roaming calls on wholesale market. The regulation also notes that mark-up used
to calculate retail prices that customers are currently paid for placing or receiving a phone call
during roaming can not surpass 30%. Of course, providers are allowed to negotiate under
wholesale cap and retail mark-up limit, paying each other as well for calls, increasing the retail
mark-up or distinguishing packages of products they sell as per customer demand. The proposed
regulation will also boost price visibility, that has been major roaming issue This allows mobile
service operators to offer their roaming consumers with customized data about retail roaming
fees – on demand and freely available. Since EU Mobile Roaming Regulations are internal
market regulation applicable to European economic region, this can be anticipated to be applied
in not too far future to Iceland, Liechtenstein and Norway as well.
9.
Social and ethical responsibility with regards to data roaming charges: Provides of
mobile-phone services should follow social and ethical responsibilities and put them on priority,
but in fact they generally avoid them. Most of the services provider are efficiently providing
solutions through their help line centers. Also most of the users are continuously facing the
Paraphrase This Document
Need a fresh take? Get an instant paraphrase of this document with our AI Paraphraser
problem of call drop and excessive deduction of balance. Further they are not directly supporting
the ban of unethical contents and other controversial things on internet. Companies which are
engaged in providing mobile phone-services are also neg-ligating the fact about how much
extent a content on internet affecting social groups, communities and other organizations.
Towards increased data roaming-chargers their attitude is not so much appreciable as they are
maintaining same margin even with enhanced data-roaming charges.
PART C – MACROECONOMICS
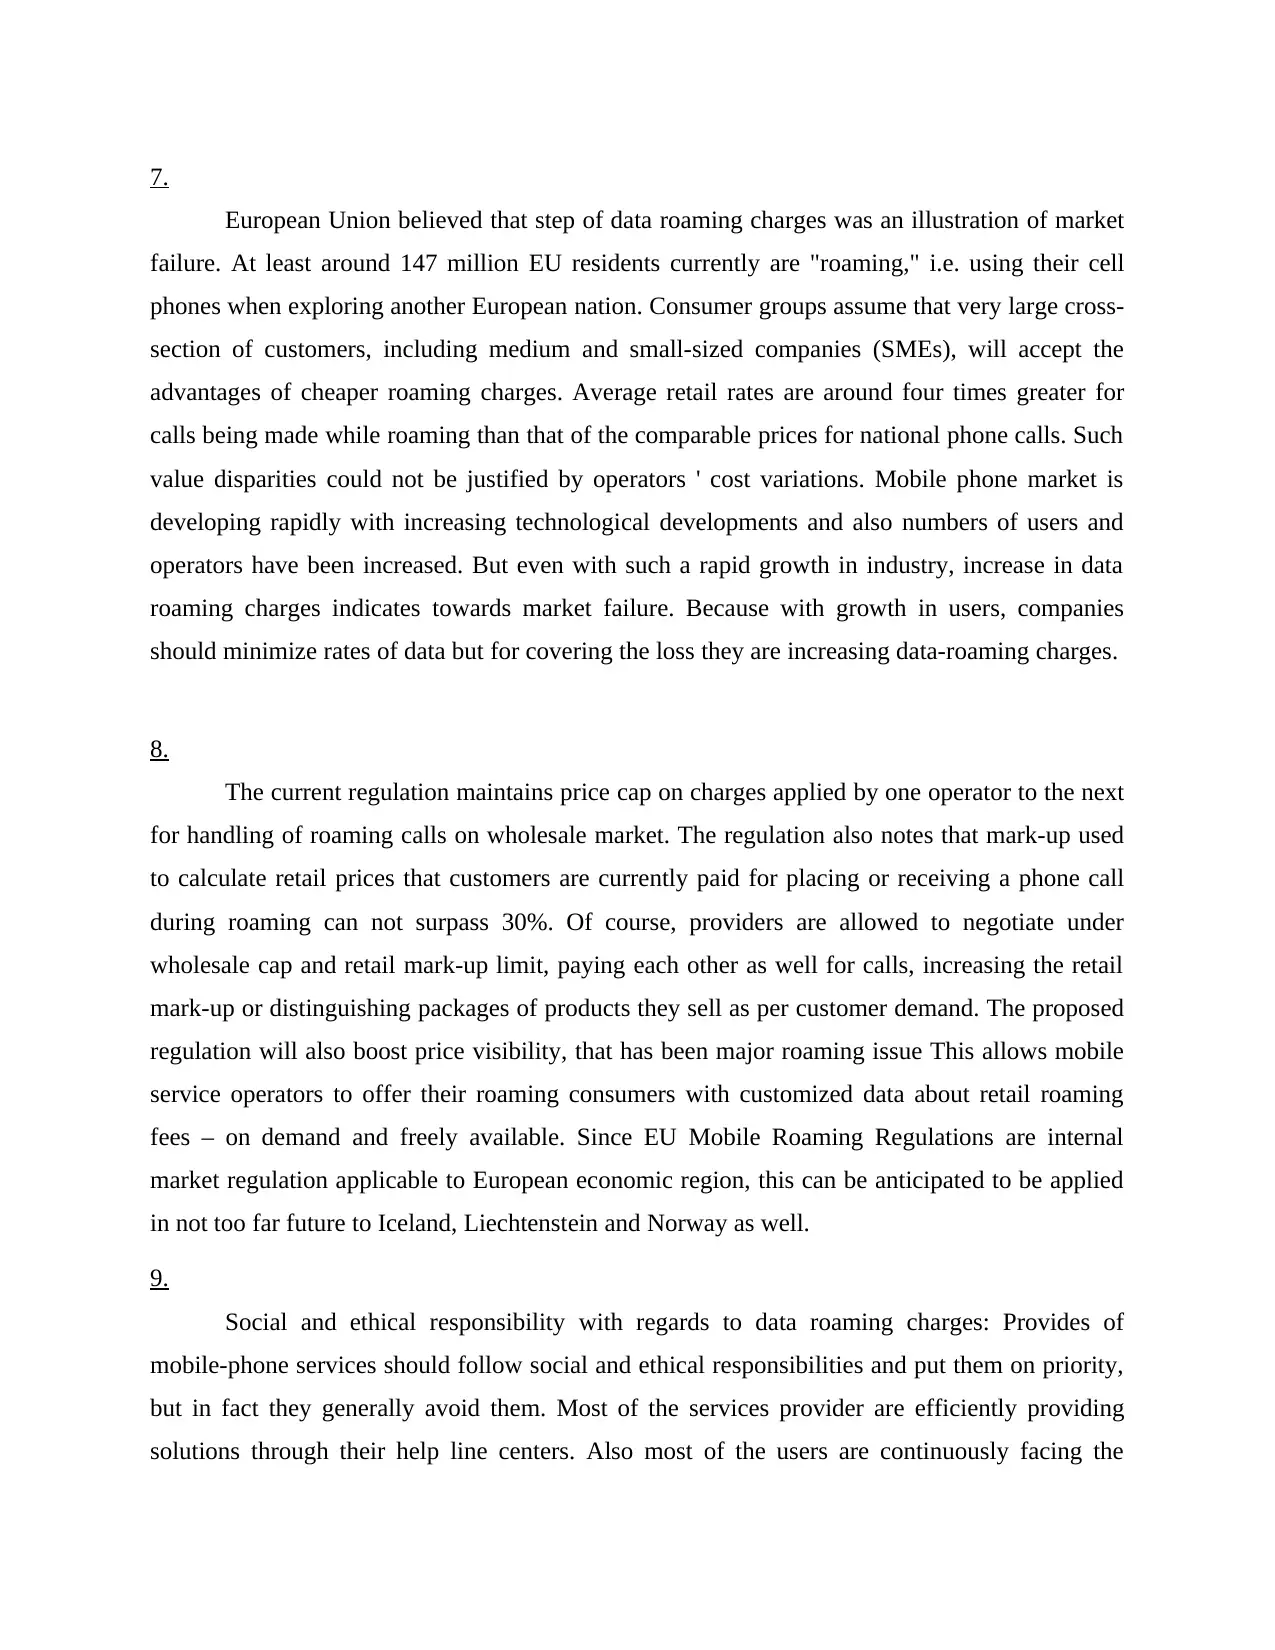
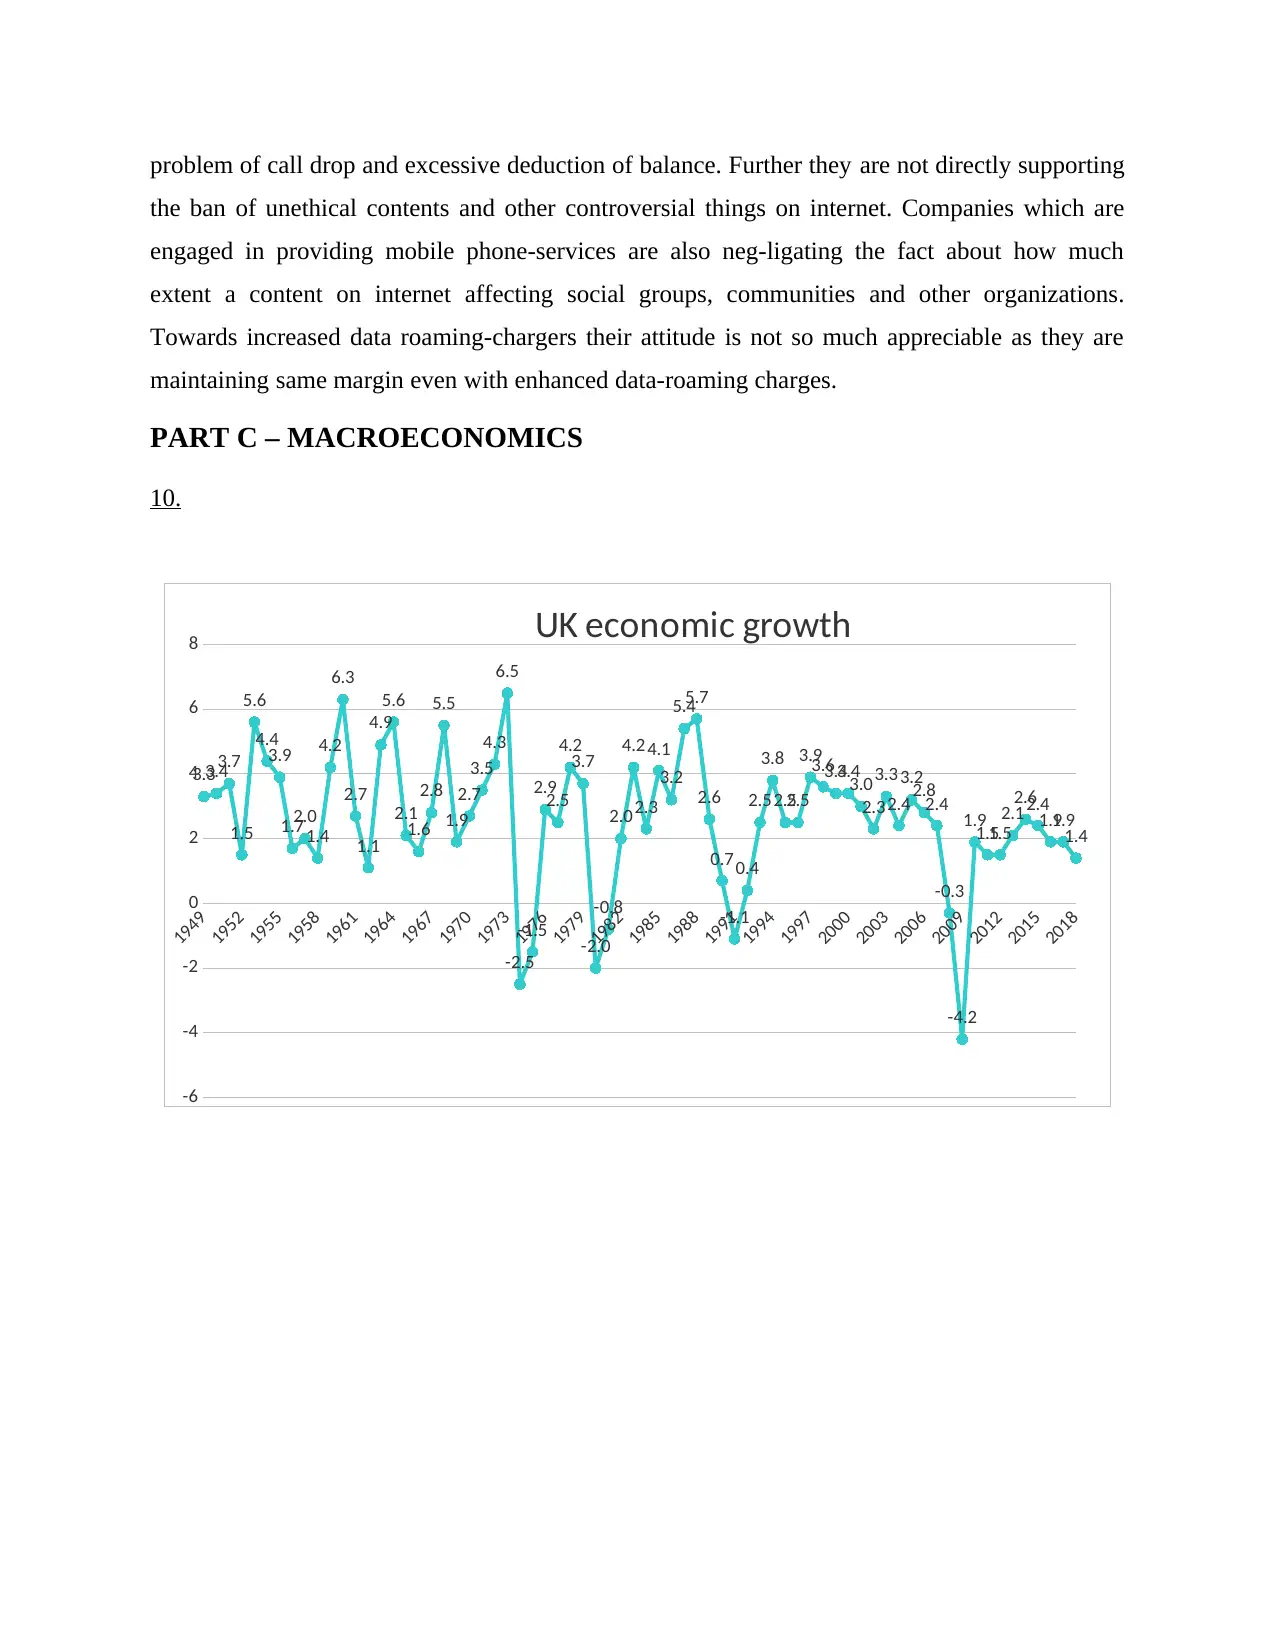
10.
1949
1952
1955
1958
1961
1964
1967
1970
1973
1976
1979
1982
1985
1988
1991
1994
1997
2000
2003
2006
2009
2012
2015
2018
-6
-4
-2
0
2
4
6
8
3.33.4
3.7
1.5
5.6
4.4
3.9
1.7
2.0
1.4
4.2
6.3
2.7
1.1
4.9
5.6
2.1
1.6
2.8
5.5
1.9
2.7
3.5
4.3
6.5
-2.5
-1.5
2.9
2.5
4.2
3.7
-2.0
-0.8
2.0
4.2
2.3
4.1
3.2
5.4
5.7
2.6
0.7
-1.1
0.4
2.5
3.8
2.52.5
3.9
3.63.43.4
3.0
2.3
3.3
2.4
3.2
2.8
2.4
-0.3
-4.2
1.9
1.51.5
2.1
2.62.4
1.91.9
1.4
UK economic growth
the ban of unethical contents and other controversial things on internet. Companies which are
engaged in providing mobile phone-services are also neg-ligating the fact about how much
extent a content on internet affecting social groups, communities and other organizations.
Towards increased data roaming-chargers their attitude is not so much appreciable as they are
maintaining same margin even with enhanced data-roaming charges.
PART C – MACROECONOMICS
10.
1949
1952
1955
1958
1961
1964
1967
1970
1973
1976
1979
1982
1985
1988
1991
1994
1997
2000
2003
2006
2009
2012
2015
2018
-6
-4
-2
0
2
4
6
8
3.33.4
3.7
1.5
5.6
4.4
3.9
1.7
2.0
1.4
4.2
6.3
2.7
1.1
4.9
5.6
2.1
1.6
2.8
5.5
1.9
2.7
3.5
4.3
6.5
-2.5
-1.5
2.9
2.5
4.2
3.7
-2.0
-0.8
2.0
4.2
2.3
4.1
3.2
5.4
5.7
2.6
0.7
-1.1
0.4
2.5
3.8
2.52.5
3.9
3.63.43.4
3.0
2.3
3.3
2.4
3.2
2.8
2.4
-0.3
-4.2
1.9
1.51.5
2.1
2.62.4
1.91.9
1.4
UK economic growth
10. (a):
Recession periods: Great Recession relates to 2008-2013 economic recession. The recession
started after global credit crisis in 2007/08, resulting in a sustained period of minimal / sluggish
growth, increasing inflation, and deficit spending. The great recession, in general, exposed issues
within Eurozone which suffered double-dip recession with massive unemployment. The key
factor of major recession was credit crunch (2007-08) in which the international financial
structure was underfunded, contributing to a fall in credibility and a decrease in bank credit. U.S.
lenders have made a huge rise in sub-prime mortgages in 2000-2007. Such loans were quite
volatile, and there were a lot of ' irrational exuberance ' and housing prices for values would
continue to rise. US bankers lost a lot of money, but later banks around world discovered that the
' free ' packages of mortgages they purchased were in reality useless. Many banks across the
globe have seen their resources decline dramatically in liquidity and valuation.
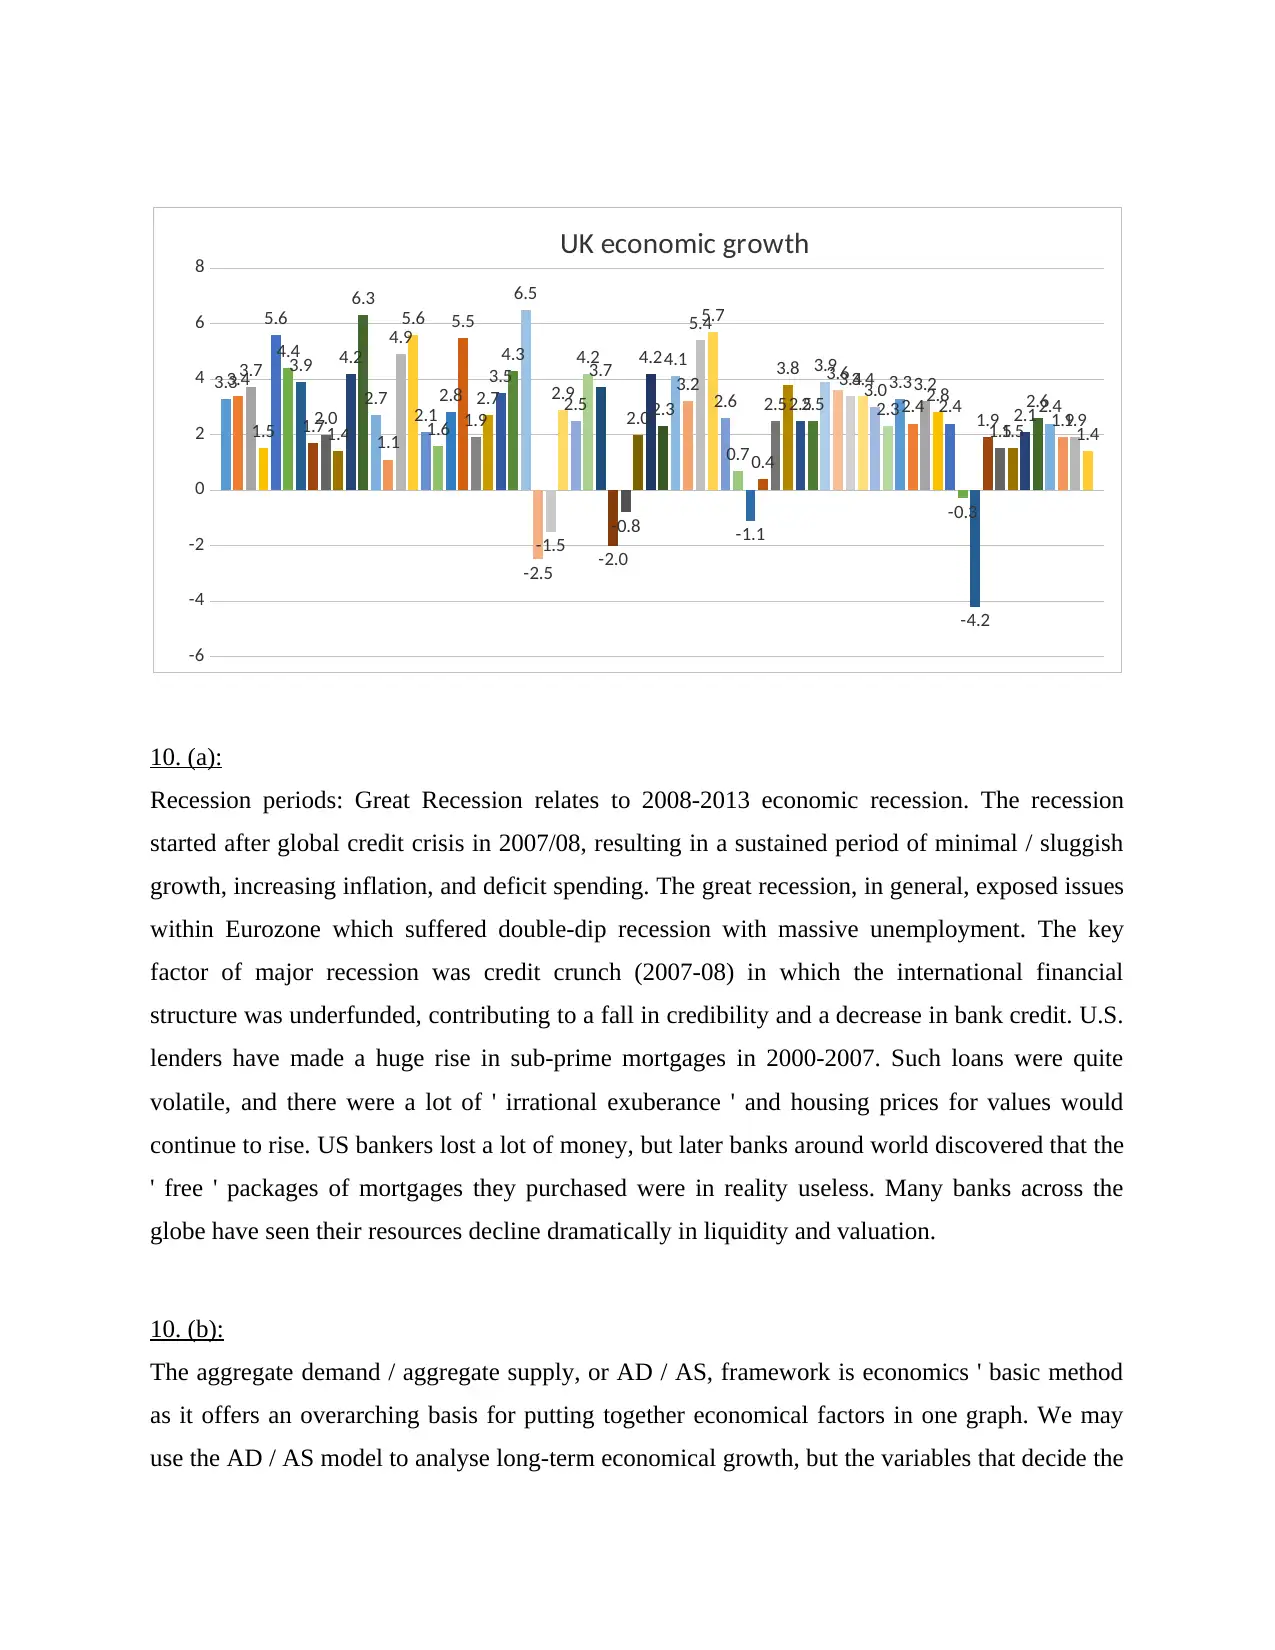
10. (b):
The aggregate demand / aggregate supply, or AD / AS, framework is economics ' basic method
as it offers an overarching basis for putting together economical factors in one graph. We may
use the AD / AS model to analyse long-term economical growth, but the variables that decide the
-6
-4
-2
0
2
4
6
8
3.33.43.7
1.5
5.6
4.4
3.9
1.72.0
1.4
4.2
6.3
2.7
1.1
4.9
5.6
2.1
1.6
2.8
5.5
1.9
2.7
3.5
4.3
6.5
-2.5
-1.5
2.9
2.5
4.2
3.7
-2.0
-0.8
2.0
4.2
2.3
4.1
3.2
5.45.7
2.6
0.7
-1.1
0.4
2.5
3.8
2.52.5
3.93.63.43.4
3.0
2.3
3.3
2.4
3.2
2.8
2.4
-0.3
-4.2
1.9
1.51.5
2.1
2.62.4
1.91.9
1.4
UK economic growth
Recession periods: Great Recession relates to 2008-2013 economic recession. The recession
started after global credit crisis in 2007/08, resulting in a sustained period of minimal / sluggish
growth, increasing inflation, and deficit spending. The great recession, in general, exposed issues
within Eurozone which suffered double-dip recession with massive unemployment. The key
factor of major recession was credit crunch (2007-08) in which the international financial
structure was underfunded, contributing to a fall in credibility and a decrease in bank credit. U.S.
lenders have made a huge rise in sub-prime mortgages in 2000-2007. Such loans were quite
volatile, and there were a lot of ' irrational exuberance ' and housing prices for values would
continue to rise. US bankers lost a lot of money, but later banks around world discovered that the
' free ' packages of mortgages they purchased were in reality useless. Many banks across the
globe have seen their resources decline dramatically in liquidity and valuation.
10. (b):
The aggregate demand / aggregate supply, or AD / AS, framework is economics ' basic method
as it offers an overarching basis for putting together economical factors in one graph. We may
use the AD / AS model to analyse long-term economical growth, but the variables that decide the
-6
-4
-2
0
2
4
6
8
3.33.43.7
1.5
5.6
4.4
3.9
1.72.0
1.4
4.2
6.3
2.7
1.1
4.9
5.6
2.1
1.6
2.8
5.5
1.9
2.7
3.5
4.3
6.5
-2.5
-1.5
2.9
2.5
4.2
3.7
-2.0
-0.8
2.0
4.2
2.3
4.1
3.2
5.45.7
2.6
0.7
-1.1
0.4
2.5
3.8
2.52.5
3.93.63.43.4
3.0
2.3
3.3
2.4
3.2
2.8
2.4
-0.3
-4.2
1.9
1.51.5
2.1
2.62.4
1.91.9
1.4
UK economic growth
⊘ This is a preview!⊘
Do you want full access?
Subscribe today to unlock all pages.
Trusted by 1+ million students worldwide
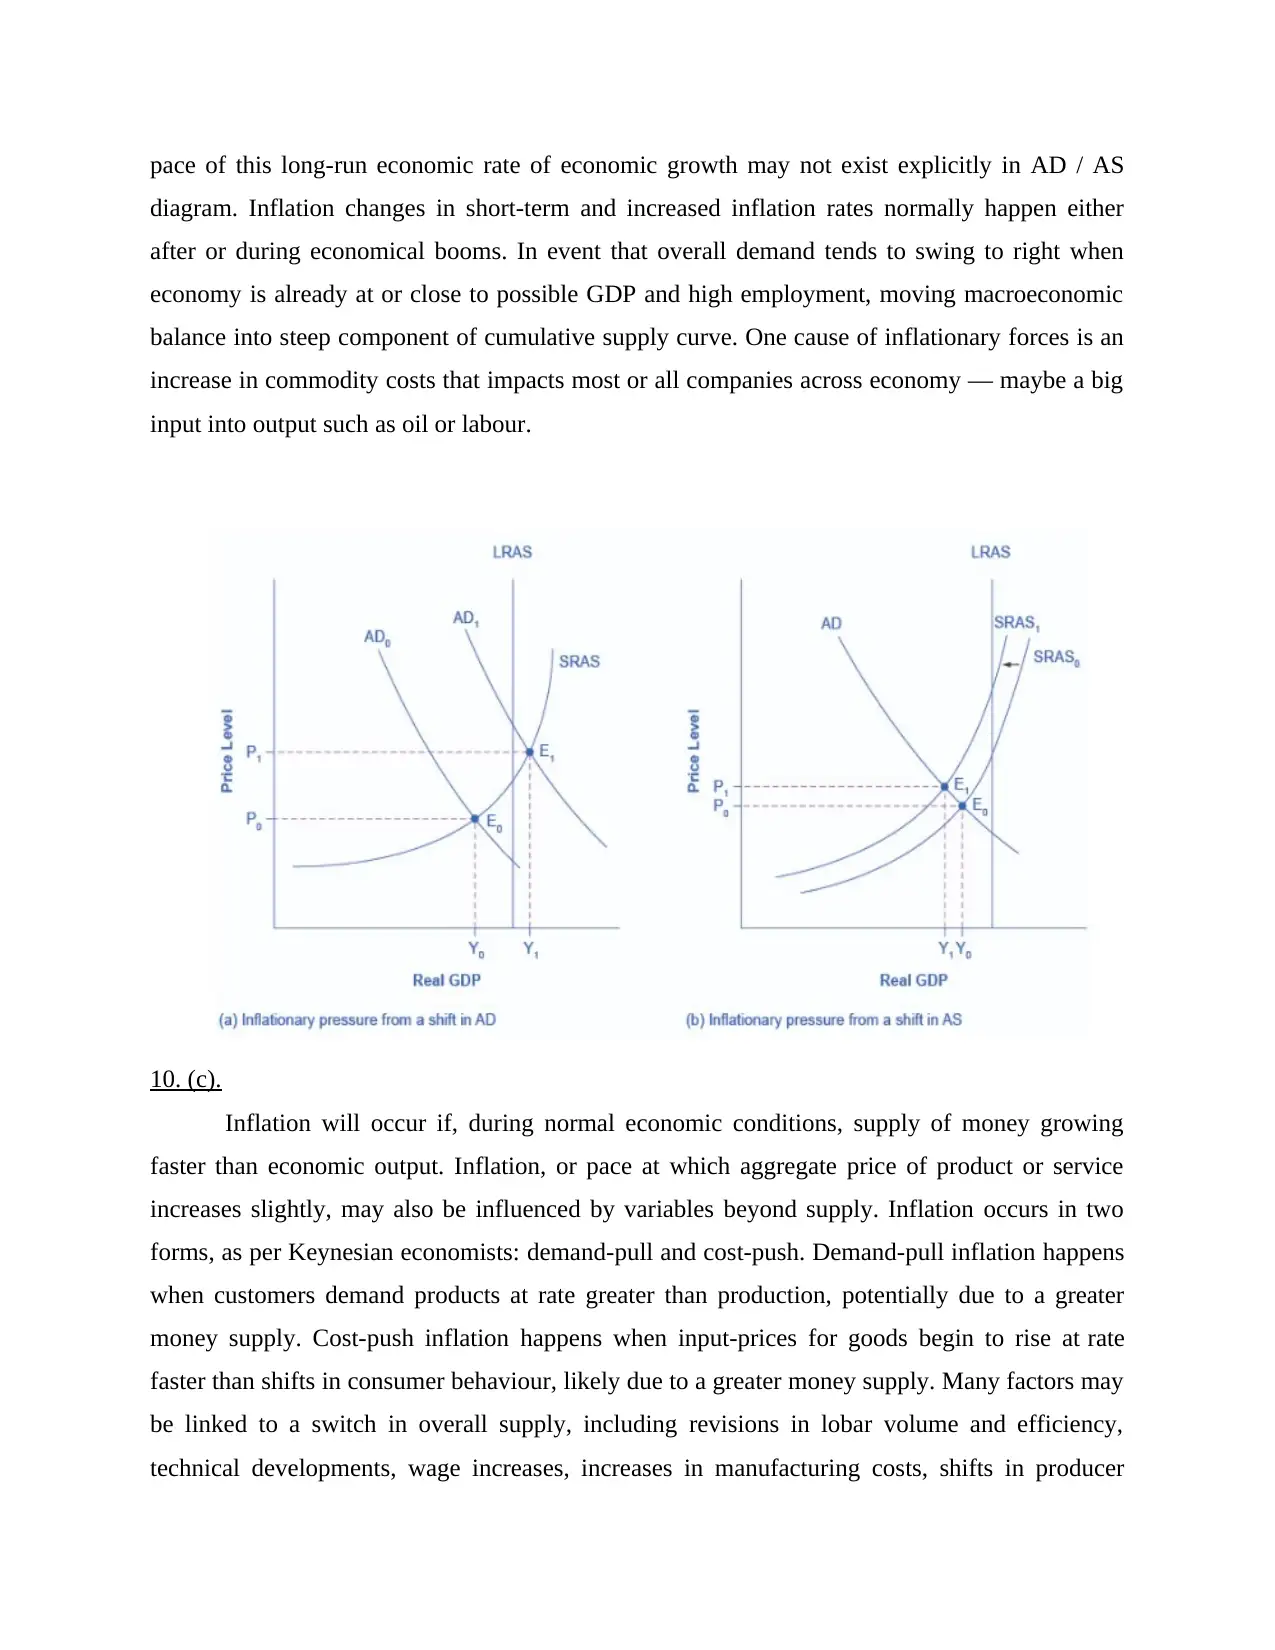
pace of this long-run economic rate of economic growth may not exist explicitly in AD / AS
diagram. Inflation changes in short-term and increased inflation rates normally happen either
after or during economical booms. In event that overall demand tends to swing to right when
economy is already at or close to possible GDP and high employment, moving macroeconomic
balance into steep component of cumulative supply curve. One cause of inflationary forces is an
increase in commodity costs that impacts most or all companies across economy — maybe a big
input into output such as oil or labour.
10. (c).
Inflation will occur if, during normal economic conditions, supply of money growing
faster than economic output. Inflation, or pace at which aggregate price of product or service
increases slightly, may also be influenced by variables beyond supply. Inflation occurs in two
forms, as per Keynesian economists: demand-pull and cost-push. Demand-pull inflation happens
when customers demand products at rate greater than production, potentially due to a greater
money supply. Cost-push inflation happens when input-prices for goods begin to rise at rate
faster than shifts in consumer behaviour, likely due to a greater money supply. Many factors may
be linked to a switch in overall supply, including revisions in lobar volume and efficiency,
technical developments, wage increases, increases in manufacturing costs, shifts in producer
Paraphrase This Document
Need a fresh take? Get an instant paraphrase of this document with our AI Paraphraser
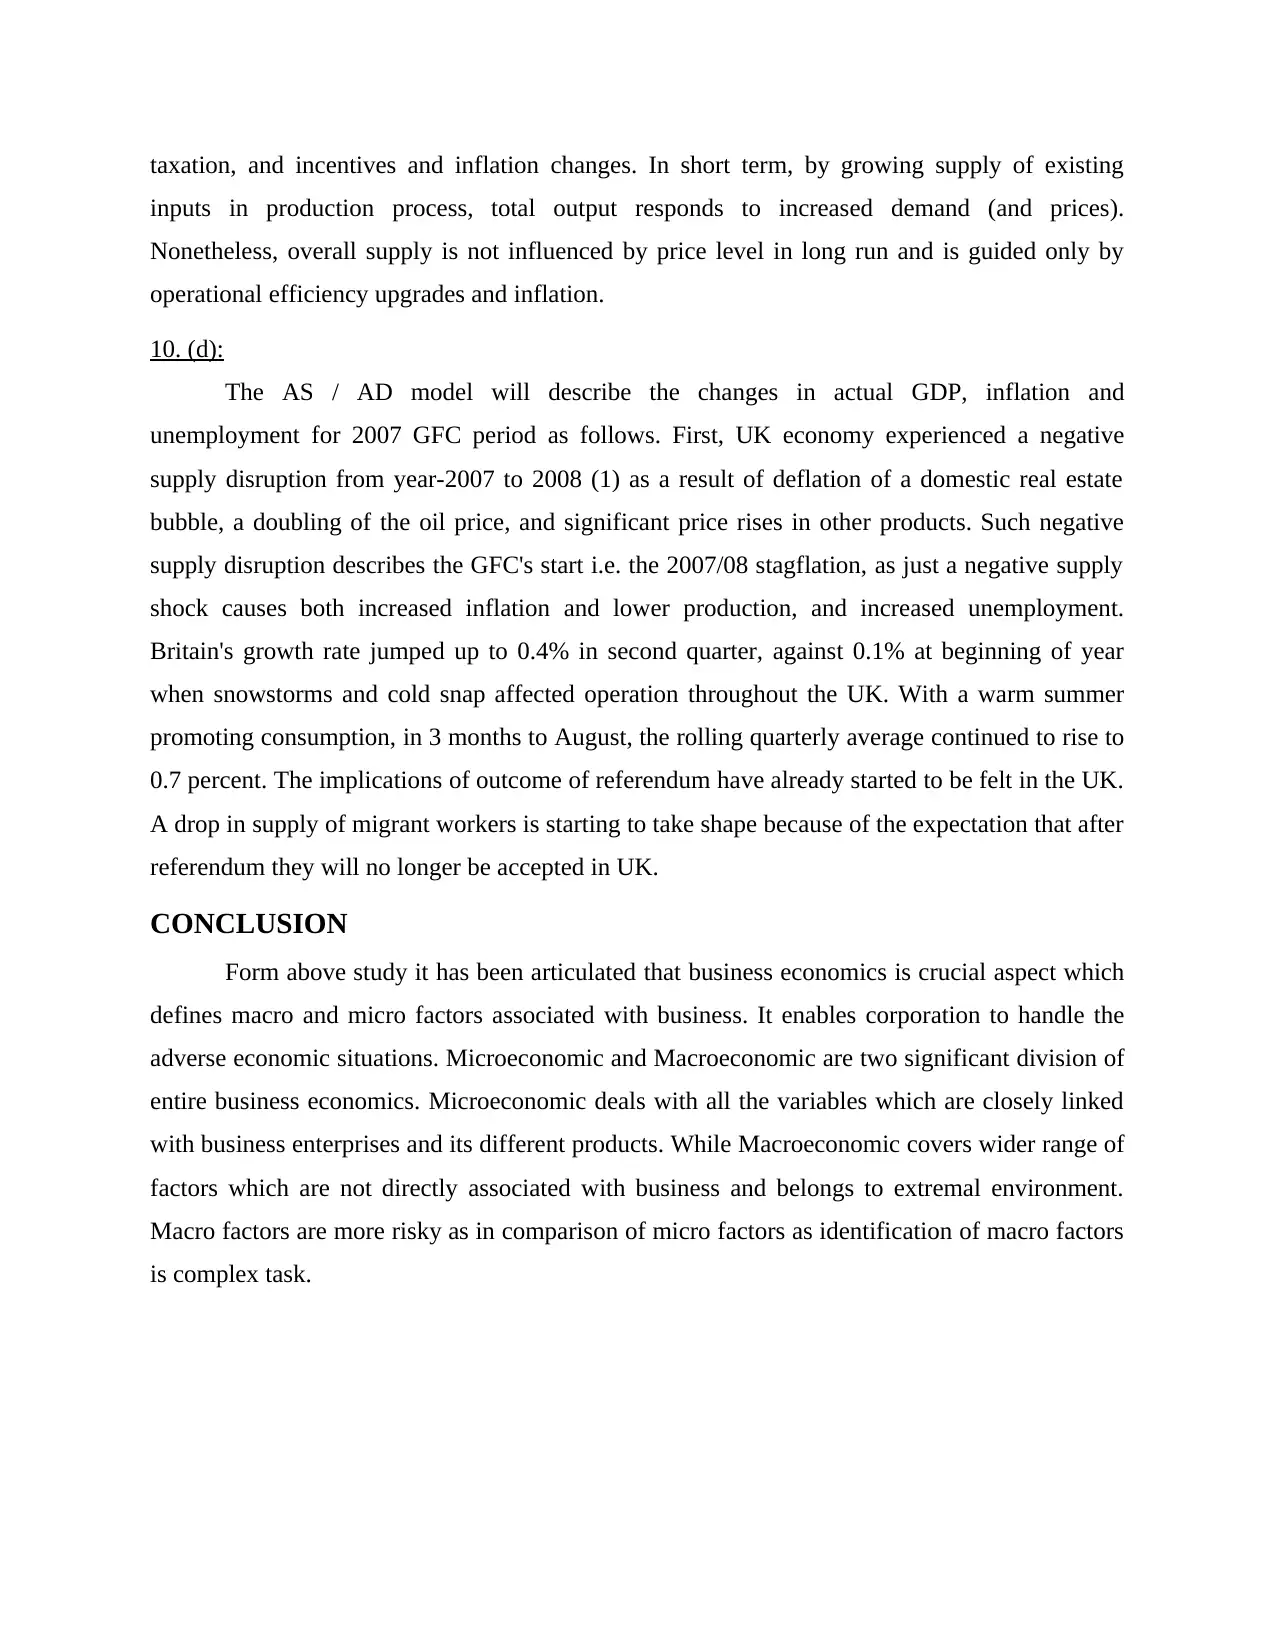
taxation, and incentives and inflation changes. In short term, by growing supply of existing
inputs in production process, total output responds to increased demand (and prices).
Nonetheless, overall supply is not influenced by price level in long run and is guided only by
operational efficiency upgrades and inflation.
10. (d):
The AS / AD model will describe the changes in actual GDP, inflation and
unemployment for 2007 GFC period as follows. First, UK economy experienced a negative
supply disruption from year-2007 to 2008 (1) as a result of deflation of a domestic real estate
bubble, a doubling of the oil price, and significant price rises in other products. Such negative
supply disruption describes the GFC's start i.e. the 2007/08 stagflation, as just a negative supply
shock causes both increased inflation and lower production, and increased unemployment.
Britain's growth rate jumped up to 0.4% in second quarter, against 0.1% at beginning of year
when snowstorms and cold snap affected operation throughout the UK. With a warm summer
promoting consumption, in 3 months to August, the rolling quarterly average continued to rise to
0.7 percent. The implications of outcome of referendum have already started to be felt in the UK.
A drop in supply of migrant workers is starting to take shape because of the expectation that after
referendum they will no longer be accepted in UK.
CONCLUSION
Form above study it has been articulated that business economics is crucial aspect which
defines macro and micro factors associated with business. It enables corporation to handle the
adverse economic situations. Microeconomic and Macroeconomic are two significant division of
entire business economics. Microeconomic deals with all the variables which are closely linked
with business enterprises and its different products. While Macroeconomic covers wider range of
factors which are not directly associated with business and belongs to extremal environment.
Macro factors are more risky as in comparison of micro factors as identification of macro factors
is complex task.
REFERENCES
Books and Journals:
Biondi, Y. and Zambon, S. eds., 2013. Accounting and business economics: Insights from
national traditions. Routledge.
Vasant, P., 2013. Meta-heuristics optimization algorithms in engineering, business, economics,
and finance. Information Science Reference.
Herrera-Soler, H. and White, M. eds., 2012. Metaphor and mills: Figurative language in
business and economics (Vol. 19). Walter de Gruyter.
Barnett, R.A., Ziegler, M.R. and Byleen, K.E., 2015. College mathematics for business,
economics, life sciences, and social sciences.
Gillespie, A., 2013. Business economics. Oxford University Press.
Jönsson, S., 2013. Accounting and business economics traditions in Sweden: A pragmatic view.
In Accounting and Business Economics (pp. 203-219). Routledge.
Castillo-Vergara, M., Alvarez-Marin, A. and Placencio-Hidalgo, D., 2018. A bibliometric
analysis of creativity in the field of business economics. Journal of Business
Research, 85, pp.1-9.
Blair, R.D. and Sokol, D.D. eds., 2015. The Oxford handbook of international antitrust
economics (Vol. 2). Oxford University Press, USA.
Newbold, P., Carlson, W.L. and Thorne, B., 2013. Statistics for business and economics. Boston,
MA: Pearson.
Hamelin, A., 2013. Influence of family ownership on small business growth. Evidence from
French SMEs. Small Business Economics, 41(3), pp.563-579.
Wilson, F. and Post, J.E., 2013. Business models for people, planet (& profits): exploring the
phenomena of social business, a market-based approach to social value creation. Small
Business Economics, 40(3), pp.715-737.
Online
International Mobile Roaming Charges, 2019. [Online]. Available through <
<https://ec.europa.eu/commission/presscorner/detail/en/MEMO_06_276>
⊘ This is a preview!⊘
Do you want full access?
Subscribe today to unlock all pages.
Trusted by 1+ million students worldwide
1 out of 12
Related Documents


Your All-in-One AI-Powered Toolkit for Academic Success.
+13062052269
info@desklib.com
Available 24*7 on WhatsApp / Email
![[object Object]](/_next/static/media/star-bottom.7253800d.svg)
Unlock your academic potential
Copyright © 2020–2026 A2Z Services. All Rights Reserved. Developed and managed by ZUCOL.