Business Economics Assignment: Market Efficiency and Analysis
VerifiedAdded on 2021/05/30
|11
|1981
|107
Homework Assignment
AI Summary
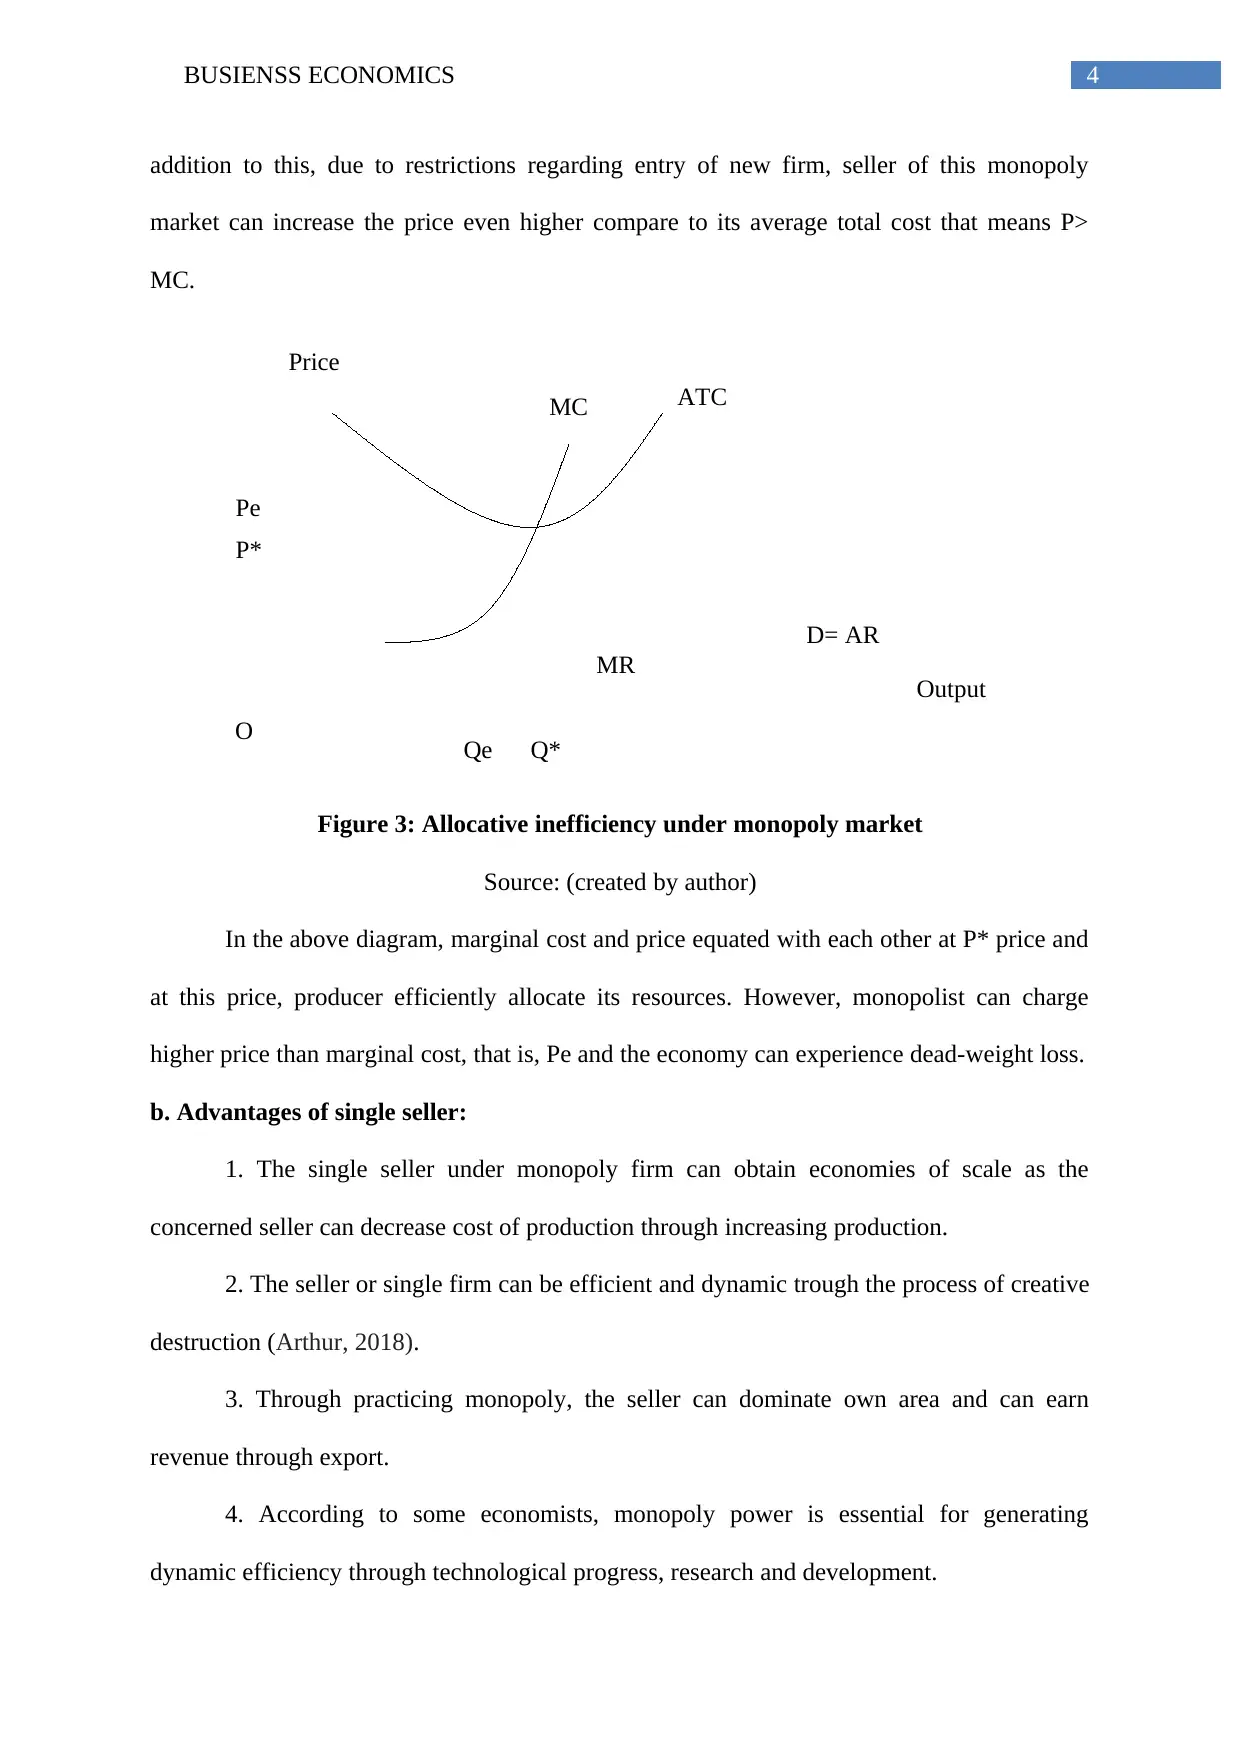
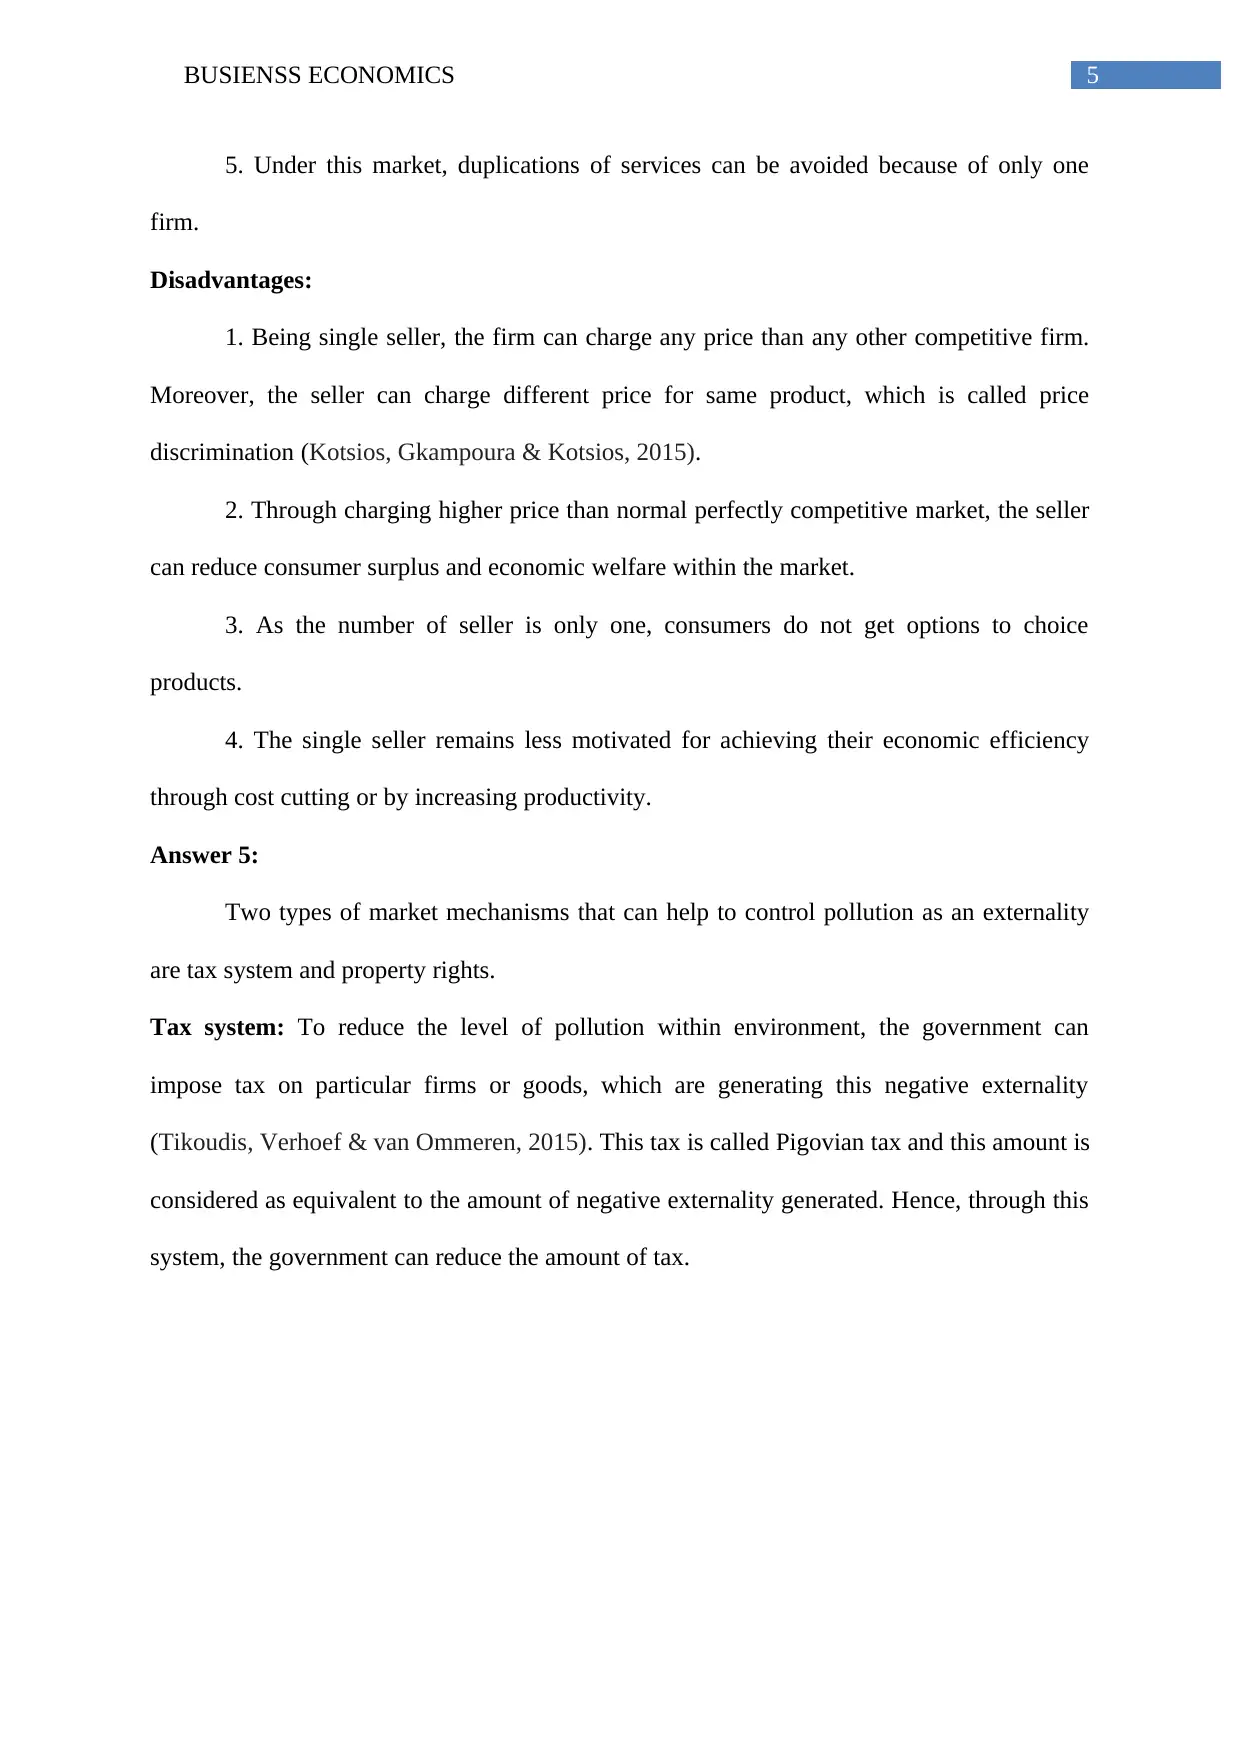
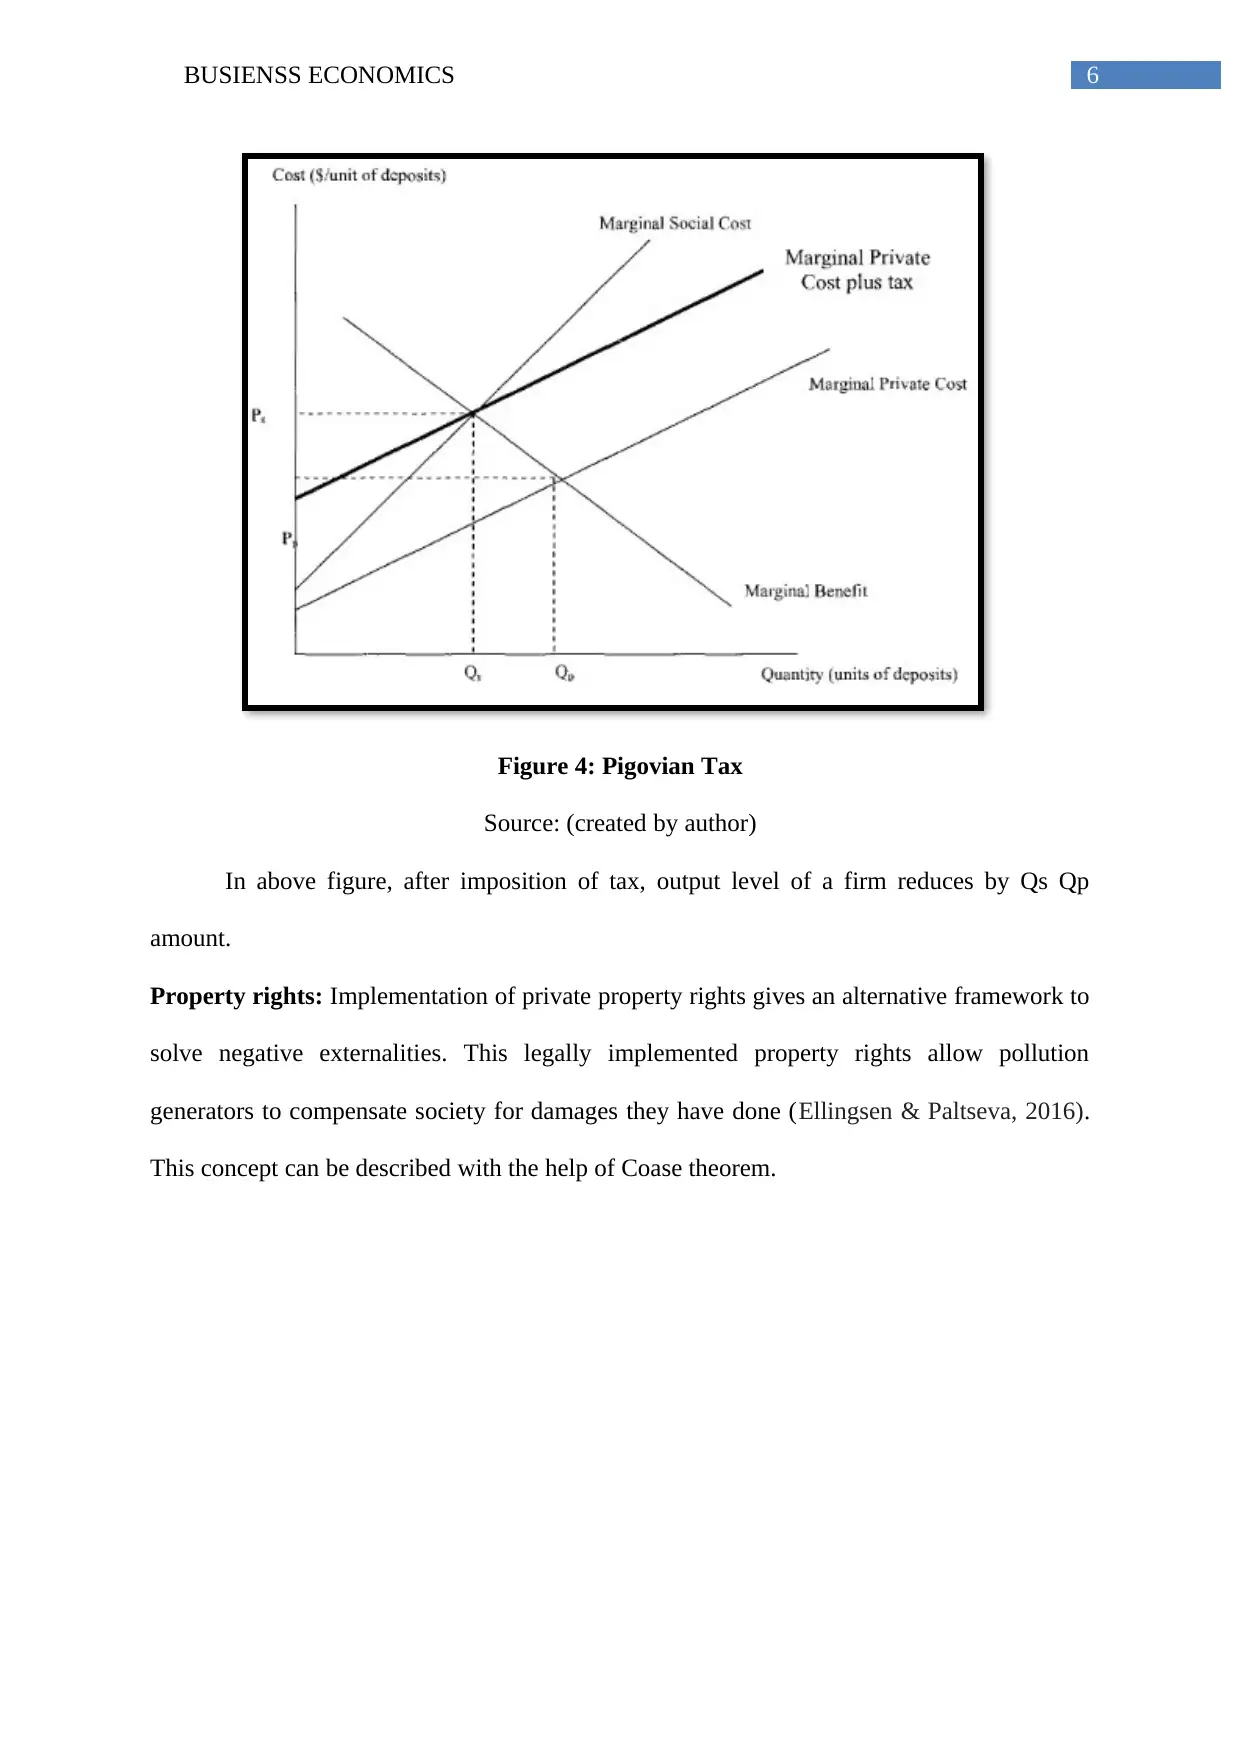
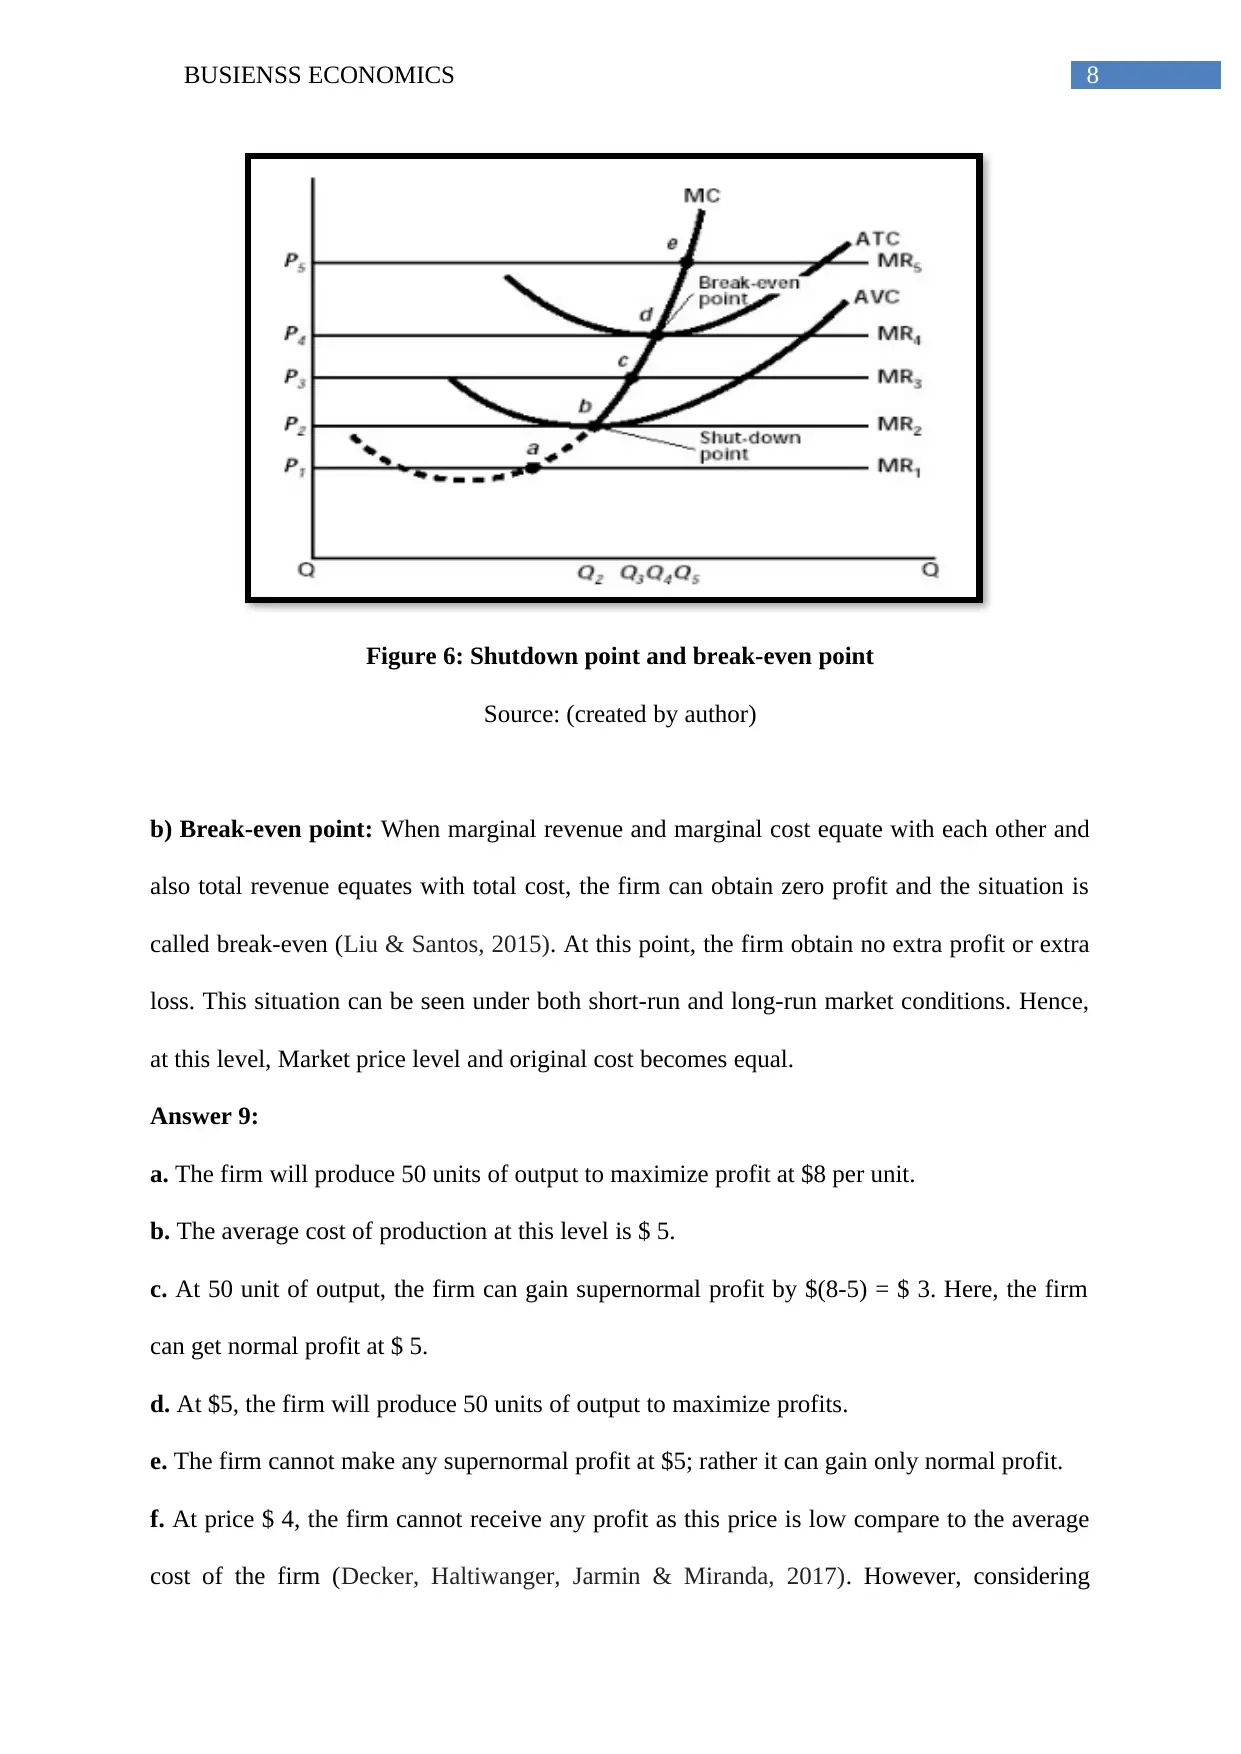
This business economics assignment analyzes various market structures, including perfect competition and monopoly, assessing their allocative efficiency and inefficiencies. It explains how firms achieve allocative efficiency in perfect competition and why monopolistically competitive firms and monopolies fail to do so. The assignment explores the advantages and disadvantages of monopolies, the role of market mechanisms like tax systems (Pigovian tax) and property rights in controlling pollution as an externality. It also covers short-run and long-run production decisions, including shutdown points, break-even points, and profit maximization. Furthermore, the assignment examines how firms determine optimal output levels and profitability based on cost and revenue analysis. The document incorporates figures and diagrams to illustrate key concepts and provides references to academic sources.

Running head: BUSIENSS ECONOMICS
Business Economics
Name of the university
Name of the student
Author Note
Business Economics
Name of the university
Name of the student
Author Note
Paraphrase This Document
Need a fresh take? Get an instant paraphrase of this document with our AI Paraphraser

1BUSIENSS ECONOMICS
Table of Contents
Answer 1:...................................................................................................................................2
Answer 3:...................................................................................................................................4
Answer 5:...................................................................................................................................5
Answer 6:...................................................................................................................................7
Answer 9:...................................................................................................................................8
References:...............................................................................................................................10

2BUSIENSS ECONOMICS
Firm IndustryPrice Price
O
Output Output
P0P0
AC
MC
D
S
Qf Qe
Answer 1:
a. The market structure, which is used to benchmark allocative efficiency, is perfect
competition. The chief reason is that when a market holds conditions of perfect competition,
then it can obtain equilibrium at current price when quantity supplied for each good or
service equates with the quantity demanded (Decker, Haltiwanger, Jarmin & Miranda, 2017).
This equilibrium can be referred as a Pareto optimum, which means, no one can be better off
through exchange without making another one worse off. Hence, the allocative efficiency
occurs at an output level when the price and marginal cost (MC) of production equates with
each other, that is, P = MC.
Figure 1: Allocative efficiency under perfect competition
Source: (created by author)
According to figure 1, the firm is producing at an allocative efficient when output is
Qf. This is because at this output level, price and marginal cost are equal. Hence, industry
under this perfectly competitive market get allocative efficiency at the same price level, when
demand or utility of consumer and supply or marginal cost of industry equate with each other.
⊘ This is a preview!⊘
Do you want full access?
Subscribe today to unlock all pages.

Trusted by 1+ million students worldwide

3BUSIENSS ECONOMICS
Price
ATC
MC
Output
O Qe
Pe
D= AR
MR
Pf
b. Monopolistically competitive firms cannot achieve allocative efficiency because they can
increase their price for goods above their marginal cost related to production, this means,
P>MC (Jaef & Roberto, 2018). Consequently, this market structure attains allocative
inefficiency as the market power of a monopolistically competitive market can reduce the
amount of consumer surplus through increasing price. Moreover, suppliers produce their
output below the capacity level.
Figure 2: Allocative inefficiency under monopolistically competitive market
Source: (created by author)
In the above figure, firm cannot achieve product efficiency because price (Pm) is
greater than minimum average total cost (ATC) curve, that is, P > ATC. Moreover, price is
also high compare to its marginal cost (MC), that is, Pm > MC. On the other side, efficient
allocation can be achieved at Pf price.
Answer 3:
a. Within a market, a single seller enjoys the monopoly power to charge any price higher than
its marginal cost. In other words, the seller can produce relatively low level of output or
charging higher amount of price than its marginal cost (Holmes, Hsu & Lee, 2014). In
Paraphrase This Document
Need a fresh take? Get an instant paraphrase of this document with our AI Paraphraser

4BUSIENSS ECONOMICS
Price
ATCMC
Output
O Qe
Pe
P*
Q*
D= AR
MR
addition to this, due to restrictions regarding entry of new firm, seller of this monopoly
market can increase the price even higher compare to its average total cost that means P>
MC.
Figure 3: Allocative inefficiency under monopoly market
Source: (created by author)
In the above diagram, marginal cost and price equated with each other at P* price and
at this price, producer efficiently allocate its resources. However, monopolist can charge
higher price than marginal cost, that is, Pe and the economy can experience dead-weight loss.
b. Advantages of single seller:
1. The single seller under monopoly firm can obtain economies of scale as the
concerned seller can decrease cost of production through increasing production.
2. The seller or single firm can be efficient and dynamic trough the process of creative
destruction (Arthur, 2018).
3. Through practicing monopoly, the seller can dominate own area and can earn
revenue through export.
4. According to some economists, monopoly power is essential for generating
dynamic efficiency through technological progress, research and development.

5BUSIENSS ECONOMICS
5. Under this market, duplications of services can be avoided because of only one
firm.
Disadvantages:
1. Being single seller, the firm can charge any price than any other competitive firm.
Moreover, the seller can charge different price for same product, which is called price
discrimination (Kotsios, Gkampoura & Kotsios, 2015).
2. Through charging higher price than normal perfectly competitive market, the seller
can reduce consumer surplus and economic welfare within the market.
3. As the number of seller is only one, consumers do not get options to choice
products.
4. The single seller remains less motivated for achieving their economic efficiency
through cost cutting or by increasing productivity.
Answer 5:
Two types of market mechanisms that can help to control pollution as an externality
are tax system and property rights.
Tax system: To reduce the level of pollution within environment, the government can
impose tax on particular firms or goods, which are generating this negative externality
(Tikoudis, Verhoef & van Ommeren, 2015). This tax is called Pigovian tax and this amount is
considered as equivalent to the amount of negative externality generated. Hence, through this
system, the government can reduce the amount of tax.
⊘ This is a preview!⊘
Do you want full access?
Subscribe today to unlock all pages.

Trusted by 1+ million students worldwide

6BUSIENSS ECONOMICS
Figure 4: Pigovian Tax
Source: (created by author)
In above figure, after imposition of tax, output level of a firm reduces by Qs Qp
amount.
Property rights: Implementation of private property rights gives an alternative framework to
solve negative externalities. This legally implemented property rights allow pollution
generators to compensate society for damages they have done (Ellingsen & Paltseva, 2016).
This concept can be described with the help of Coase theorem.
Paraphrase This Document
Need a fresh take? Get an instant paraphrase of this document with our AI Paraphraser

7BUSIENSS ECONOMICS
PMC
SMCPrice per year
MR
Pollution per year
O Q*Q1
Figure 5: Property rights
Source: (created by author)
In the above figure, the firm accepts to pay compensation to the society which in turn
has increase the marginal social cost (MSC) of the above its marginal private cost (MPC).
Thus, the amount of production has decreased by Q1 Q* unit.
Answer 6:
a) In the short-run, the firm can operate its production as long as its price is greater than
the average variable cost (AVC). The chief reason is that, under this situation, short run fixed
costs are sunk cost and it is not decided to shutdown. Hence, above the AVC curve, the firm
can bear its fixed cost (Manesh & Karimani, 2017). However, in the long run, the firm does
not have any fixed cost as everything costs have become average variable costs and
consequently, the firm can consider both costs to determine value against their revenue.
Hence, instead of bearing costs, firm ma exit from the market.

8BUSIENSS ECONOMICS
Figure 6: Shutdown point and break-even point
Source: (created by author)
b) Break-even point: When marginal revenue and marginal cost equate with each other and
also total revenue equates with total cost, the firm can obtain zero profit and the situation is
called break-even (Liu & Santos, 2015). At this point, the firm obtain no extra profit or extra
loss. This situation can be seen under both short-run and long-run market conditions. Hence,
at this level, Market price level and original cost becomes equal.
Answer 9:
a. The firm will produce 50 units of output to maximize profit at $8 per unit.
b. The average cost of production at this level is $ 5.
c. At 50 unit of output, the firm can gain supernormal profit by $(8-5) = $ 3. Here, the firm
can get normal profit at $ 5.
d. At $5, the firm will produce 50 units of output to maximize profits.
e. The firm cannot make any supernormal profit at $5; rather it can gain only normal profit.
f. At price $ 4, the firm cannot receive any profit as this price is low compare to the average
cost of the firm (Decker, Haltiwanger, Jarmin & Miranda, 2017). However, considering
⊘ This is a preview!⊘
Do you want full access?
Subscribe today to unlock all pages.

Trusted by 1+ million students worldwide

9BUSIENSS ECONOMICS
marginal cost curve as supply curve in the short-run, the firm can produce 40 units at this
price level.
g. The profit value of the firm is $ (4 – 5) = $ -1 at this level.
h. the firm will shut-down its production under short-run when it will reach at the minimum
point of its average variable cost, that is, $ 3.50.
i. In long run, a producer will not shut down its firm. Instead of this, the person can leave the
industry if it cannot bear losses for long period. Hence, this concept of short-run is not
applicable in long run.
Paraphrase This Document
Need a fresh take? Get an instant paraphrase of this document with our AI Paraphraser

10BUSIENSS ECONOMICS
References:
Arthur, W. B. (2018). Self-reinforcing mechanisms in economics. In The economy as an
evolving complex system(pp. 9-31). CRC Press.
Decker, R. A., Haltiwanger, J., Jarmin, R. S., & Miranda, J. (2017). Declining dynamism,
allocative efficiency, and the productivity slowdown. American Economic
Review, 107(5), 322-26.
Ellingsen, T., & Paltseva, E. (2016). Confining the Coase theorem: contracting, ownership,
and free-riding. The Review of Economic Studies, 83(2), 547-586.
Holmes, T. J., Hsu, W. T., & Lee, S. (2014). Allocative efficiency, mark-ups, and the welfare
gains from trade. Journal of International Economics, 94(2), 195-206.
Jaef, F., & Roberto, N. (2018). Entry and Exit, Multiproduct Firms, and Allocative
Distortions. American Economic Journal: Macroeconomics, 10(2), 86-112.
Kotsios, P., Gkampoura, A., & Kotsios, V. (2015). The effect of research & development
investments on new firm entry. Research in World Economy, 6(1), 112.
Liu, J., & Santos, G. (2015). Decarbonizing the road transport sector: Break-even point and
consequent potential consumers' behavior for the US case. International Journal of
Sustainable Transportation, 9(3), 159-175.
Manesh, M. S., & Karimani, F. (2017). Differences between Monopoly and Perfect
Competition in Providing Public Transportation (Case Study: Lane No. 10 and 96 of
Mashhad Bus System). Int J Econ Manag Sci, 6(416), 2.
Tikoudis, I., Verhoef, E. T., & van Ommeren, J. N. (2015). On revenue recycling and the
welfare effects of second-best congestion pricing in a monocentric city. Journal of
Urban Economics, 89, 32-47.
1 out of 11
Related Documents

Your All-in-One AI-Powered Toolkit for Academic Success.
+13062052269
info@desklib.com
Available 24*7 on WhatsApp / Email
Unlock your academic potential
Copyright © 2020–2025 A2Z Services. All Rights Reserved. Developed and managed by ZUCOL.