University Business Economics ECO504: Assessment Task 3 Analysis
VerifiedAdded on 2019/11/08
|11
|1944
|287
Homework Assignment
AI Summary
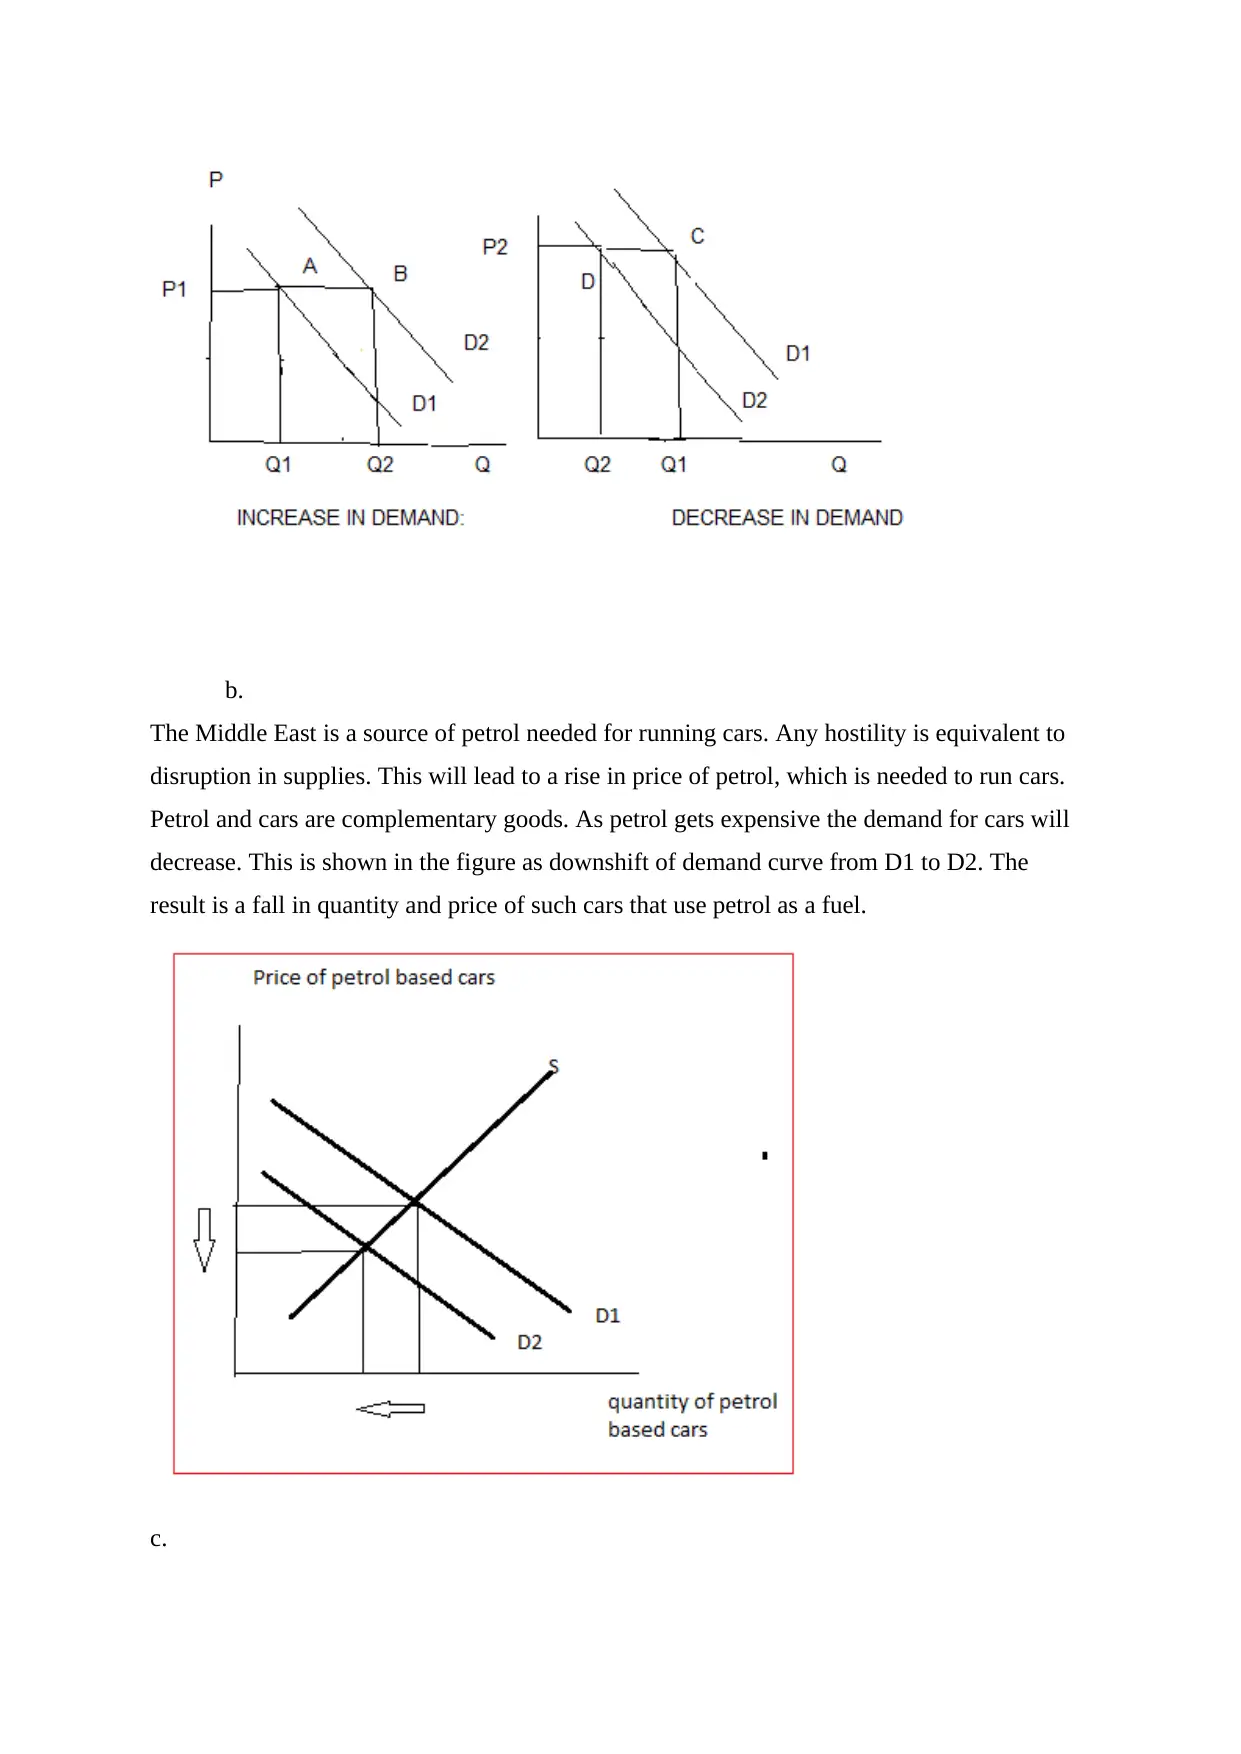
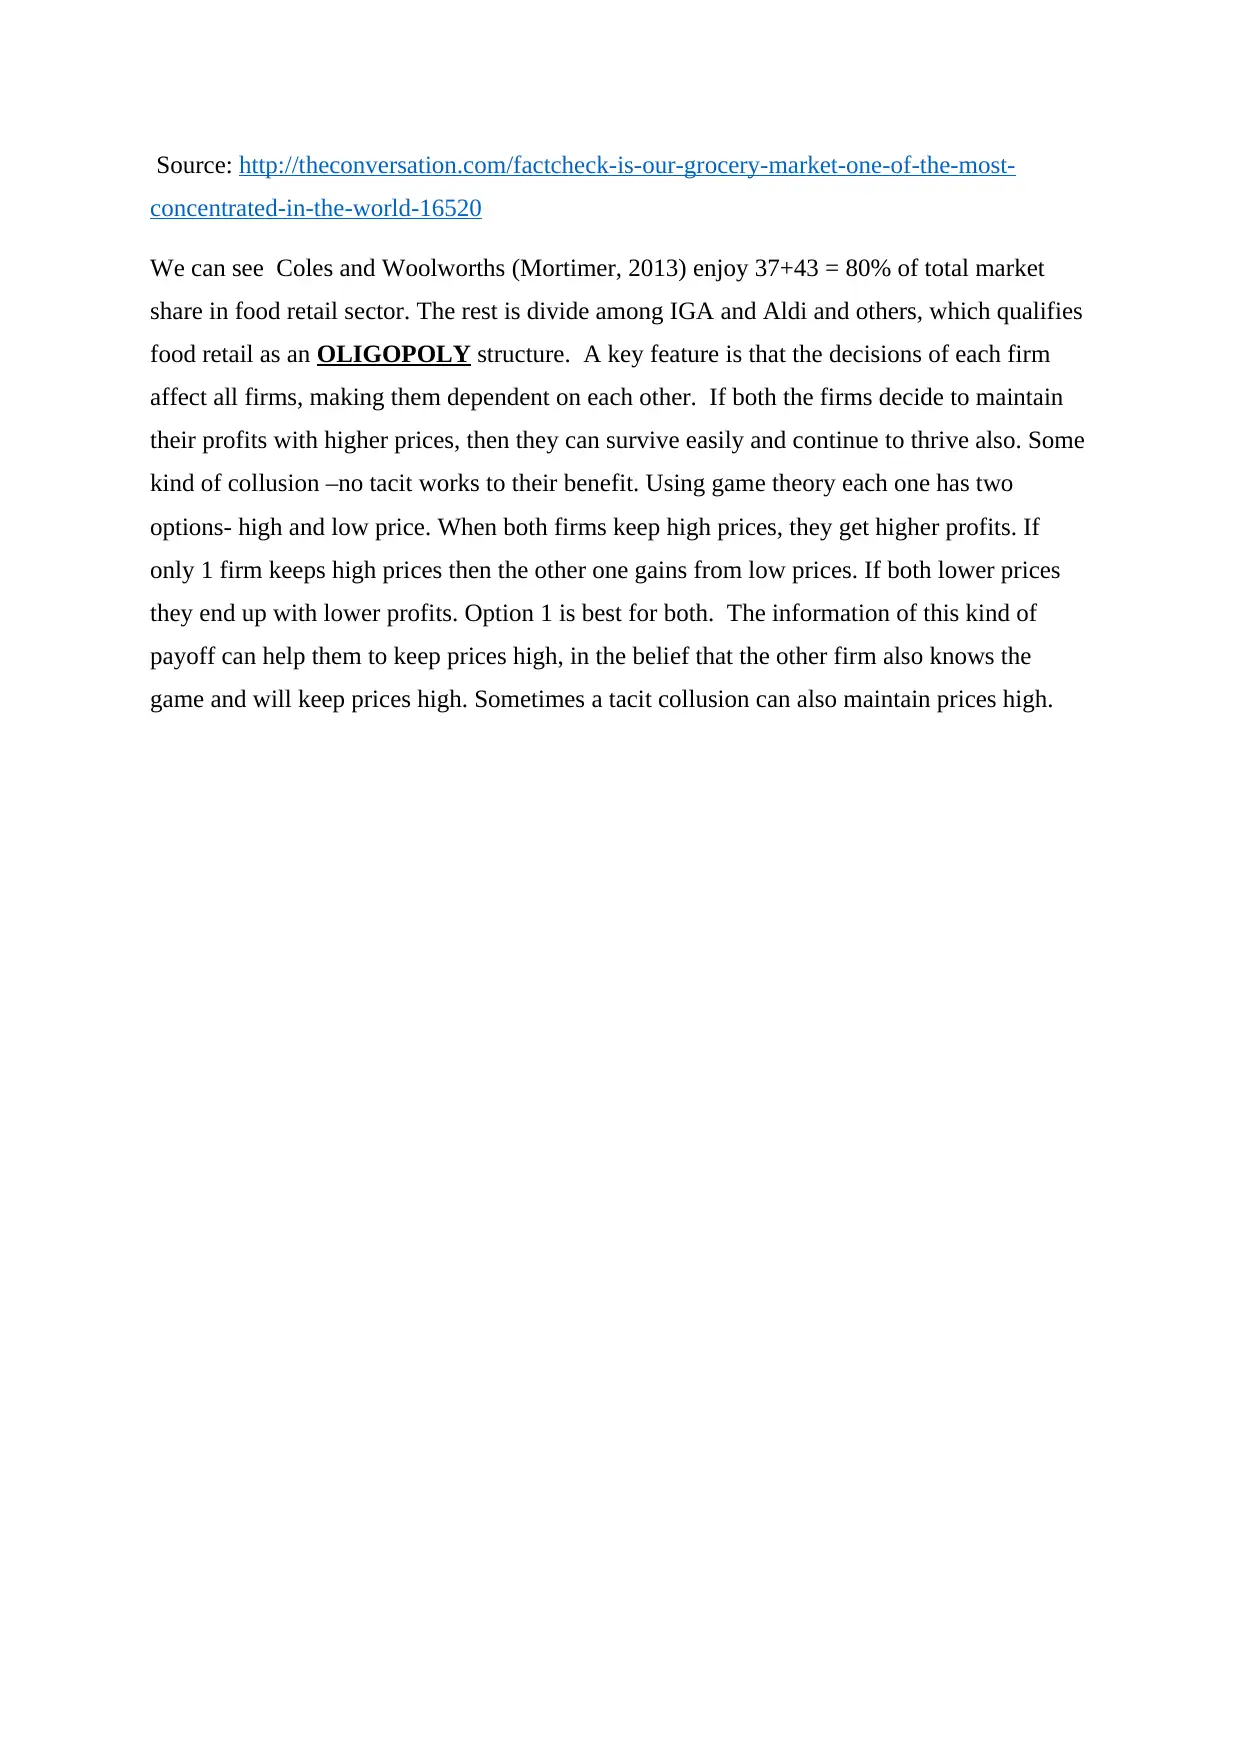
This assignment solution for ECO504 Business Economics covers various microeconomic concepts. It begins by explaining shifts along and of the demand curve, using examples like changes in petrol prices affecting car demand. It then analyzes the impact of unit sales taxes, including tax incidence and elasticity. The solution explores profit types (normal and abnormal), the shape of the ATC curve, and economic costs. Price elasticity of demand is discussed, comparing necessities and luxury goods. It further explains marginal cost curves, their upward slope, and the case of Netflix's marginal cost. The assignment also examines the impact of robotic technology on Australian higher education, considering supply, demand, costs, and fixed costs. Finally, it explains the success of supermarkets like Woolworths and Coles using the concept of oligopoly and game theory. References are provided at the end.

Student name:
Unit Code: ECO504
Unit Title: Business Economics
Assessment Title: Assessment Task 3
Type of Assessment: Written
Due date: 13TH Sep
Unit Code: ECO504
Unit Title: Business Economics
Assessment Title: Assessment Task 3
Type of Assessment: Written
Due date: 13TH Sep
Paraphrase This Document
Need a fresh take? Get an instant paraphrase of this document with our AI Paraphraser

Q1.
a.
SHIFTS ALONG THE DEMAND CURVE: this is caused by changes in price ofa
good. It is shown as a shift from one point on the demand curve to another point.
Assume that price falls, so that we move from A to B, which is also called an increase
in quantity of X demanded. A rise in price causes an opposite movement from C to D,
or a decrease in quantity demanded.
SHIFTS OF DEMAND CURVE: These are caused by all factors that affect demand
except own price of the good. For example if income of a consumer rises, then she
will demand more X with no change in price. This is shown by a right shift OF the
demand curve, and we move from A to B. the difference is that A and B lie on
different demand curves. The change in demand is called expansion of demand. A
similar shift to the left can happen due to income fall. The movement from C to D is
a contraction in demand.

b.
The Middle East is a source of petrol needed for running cars. Any hostility is equivalent to
disruption in supplies. This will lead to a rise in price of petrol, which is needed to run cars.
Petrol and cars are complementary goods. As petrol gets expensive the demand for cars will
decrease. This is shown in the figure as downshift of demand curve from D1 to D2. The
result is a fall in quantity and price of such cars that use petrol as a fuel.
c.
⊘ This is a preview!⊘
Do you want full access?
Subscribe today to unlock all pages.

Trusted by 1+ million students worldwide

A battery car will not use petrol, and is a substitute for petrol based cars. As the price of
petrol cars falls the demand for battery cars will also fall. This is shown as downwards shift
of demand curve. The price and quantity of battery cars are both lower now.
Q2.
a. A unit sales tax is a tax applied per unit. It affects the variable cost of the good
b. The relation is based on the incidence of tax, in terms of who bears the final cost of
tax between seller and buyer. Higher is price elasticity of demand lower is the tax incidence
on the buyer/consumer. So any tax imposition must be careful in terms of the final bearer of
the tax.
c. We expect price to rise and quantity to fall. A tax is shown as a left shift of the supply
curve to (S with tax). The extent of changes in quantity depend on demand elasticity. Higher
is elasticity greater is fall in quantity (blue arrow), lower elasticity leads to lesser change in
quantity.( red arrow) the price change is same = tax in both cases.
Paraphrase This Document
Need a fresh take? Get an instant paraphrase of this document with our AI Paraphraser

Q3.
a. Normal and excess/abnormal profits are difficult to quantify yet play important
roles in microeconomics. Explain.
Normal and abnormal profits differ in the implicit costs
profits = Revenues – costs
Costs can be explicit or implicit. If we include both we have normal profits.
Abnormal profits consider only explicit costs. The problem is that implicit costs
are tough to measure as there is no equivalent for them in the market.
Abnormal
b. An upward sloping ATC in short run comes from the shape of TP curve. variable
proportions. The is seen below if we assume no fixed costs and 1 input only- labour.(L)
Total costs= TC=w*L
ATC = TC /Q = w*L/Q
MC=w/AP where AP = average product= Q/L
If AP falls then ATC will rise.
c.
The economic cost is the cost of foregone alternatives. If a professional washes
her car she loses out on her income that she could have earned working in the
office. Assume it takes 30 minute to wash a car and her professional charges are
$100 per hour. The economic cost will be $50.

Q4.
a. Price elasticity of demand depends on many factors, the nature of the good among
them. Water by its nature is a necessity making its demand expectedly inelastic. Also it has
no substitutes which make it difficult for consumers to change demand. Movie tickets area
normal or luxury good with many substitutes – TV, video streaming or simply having a
picnic as time out. We can expect its demand to be more elastic.
b. The competition depends on the nature of the market in which firms operate. The
bottled water industry may face an inelastic demand (as an industry) but competition within
its own firms can alter the degree of elasticity that each firm faces. If there is high
competition then each firm faces an elastic demand. The same applies to movie tickets.
Q5.
a. Explain how marginal cost curves are derived from total cost curves.
Marginal cost of the nth unit is the difference between total cost of nth and (n-1)th unit
of output. Since fixed costs do not change with output marginal costs are also defined
as difference between total variable cost of nth and (n-1)th unit of output.
b. Explain why marginal cost curves might slope upwards.
An upward sloping MC comes due to law of variable proportions. This law causes
marginal product to fall after a certain number of units have been produced. The
inverse relation is seen below if we assume no fixed costs and 1 input only- labour.(L)
Total costs= TC=w*L
MC=dTC/dq = w*(dL/dQ)
MC=w/MP
If MP falls then MC will rise. MP falls due to law of variable proportions.
c.
The shape of marginal cost curve (Cookson, 2011) is taken as horizontal, which
means that an additional unit of services does not cost anything to Netflix. This is due
to the nature of its offerings/services. Once it buys the content it has no cost to incur if
a new subscriber joins it. according to reports (Thierer, 2011)’ he marginal cost of
providing an extra gigabyte of data—enough to deliver one episode of “30 Rock”
from Netflix—is less than one cent, and falling’. Clearly MC is almost zero, and
horizontal.
⊘ This is a preview!⊘
Do you want full access?
Subscribe today to unlock all pages.

Trusted by 1+ million students worldwide

Q6.
How will the successful application of robotic technology in Australian higher education
impact:
a. Supply of education; as robots become teachers we expect supply of teachers to rise.
This shifts the supply curve upwards to S1.
b. Demand for education: The demand will be affected based on the perceptions among
consumers about being taught by robots as compared to humans. If consumers
perceive robots to be better then demand will rise for education through robots. This
is seen as a downwards shift of the demand curve(D1). If consumers perceive robots
to be worse than teachers then demand will fall- left shift of curve occurs.(D2)
Paraphrase This Document
Need a fresh take? Get an instant paraphrase of this document with our AI Paraphraser

c. Marginal cost of education: if we assume that robots are cheaper than humans then
MC can be expected to fall. A fall in costs will raise supply so that supply curve shifts
down to S2.
d. Fixed costs of education: there is no definite answer to this. Suppose new schools are
built that use robots then the expenditures on school are a fixed cost. Higher costs
will lead to lower supply in long run which shifts supply curve up.

But if robots are adjusted with human teachers in existing schools then there is no
change in fixed costs. (assuming no expansion in infrastructure occurs). There will be
no change then in supply.
Q7.
Supermarkets such as Woolworths and Coles have a widespread presence across Australia.
How best do you explain the success of supermarkets using the concepts learnt in this unit?
change in fixed costs. (assuming no expansion in infrastructure occurs). There will be
no change then in supply.
Q7.
Supermarkets such as Woolworths and Coles have a widespread presence across Australia.
How best do you explain the success of supermarkets using the concepts learnt in this unit?
⊘ This is a preview!⊘
Do you want full access?
Subscribe today to unlock all pages.

Trusted by 1+ million students worldwide

Source: http://theconversation.com/factcheck-is-our-grocery-market-one-of-the-most-
concentrated-in-the-world-16520
We can see Coles and Woolworths (Mortimer, 2013) enjoy 37+43 = 80% of total market
share in food retail sector. The rest is divide among IGA and Aldi and others, which qualifies
food retail as an OLIGOPOLY structure. A key feature is that the decisions of each firm
affect all firms, making them dependent on each other. If both the firms decide to maintain
their profits with higher prices, then they can survive easily and continue to thrive also. Some
kind of collusion –no tacit works to their benefit. Using game theory each one has two
options- high and low price. When both firms keep high prices, they get higher profits. If
only 1 firm keeps high prices then the other one gains from low prices. If both lower prices
they end up with lower profits. Option 1 is best for both. The information of this kind of
payoff can help them to keep prices high, in the belief that the other firm also knows the
game and will keep prices high. Sometimes a tacit collusion can also maintain prices high.
Paraphrase This Document
Need a fresh take? Get an instant paraphrase of this document with our AI Paraphraser

REFERNCES
Cookson, T. (2011, July 25). Netflix EconomicsII. Retrieved Sep 7, 2017, from Thisyoungeconomist.com:
http://blog.thisyoungeconomist.com/2011/07/netflix-economics-ii-difference-between.html
Economic profit and Accounting profit. (n.d.). Retrieved Sep 3, 2017, from Oregonstate.edu:
http://oregonstate.edu/instruct/econ201/osman/Lec10/tsld018.htm
Elasticity. (n.d.). Retrieved Aug 30, 2017, from Econ.ohio-state.edu:
http://www.econ.ohio-state.edu/jpeck/H200/EconH200L5.pdf
Impact of Shifts in demand and supply. (n.d.). Retrieved SEP 3, 2017, from Econport.org:
http://www.econport.org/content/handbook/Equilibrium/Impact-.html
Microeconomics. (n.d.). Retrieved SEP 2, 2017, from CSun.edu:
http://www.csun.edu/sites/default/files/micro3.pdf
Mortimer, G. (2013, Aug 13). Factcheck: Is our grocerymarket concetrated? Retrieved Sep 6, 2017, from
Theconversation.com: http://theconversation.com/factcheck-is-our-grocery-market-one-of-the-
most-concentrated-in-the-world-16520
MR=MC rule. (n.d.). Retrieved Sep 2, 2017, from Courseera.org: https://www.coursera.org/learn/principles-
of-microeconomics/lecture/zKD8R/pricing-and-production-rules-p-mr-mc-the-shutdown-rule
Oligopoly. (n.d.). Retrieved Sep 8, 2017, from econ.ohio-state.edu:
http://www.econ.ohio-state.edu/jpeck/H200/EconH200L13.pdf
Price elasticity of demand. (n.d.). Retrieved SEp 8, 2017, from economicsonline.co.uk:
http://www.economicsonline.co.uk/Competitive_markets/Price_elasticity_of_demand.html
Shifts in demand and supply. (n.d.). Retrieved Aug 30, 2017, from Cnx.org:
https://cnx.org/contents/ETAPPz5d@5/Shifts-in-Demand-and-Supply-fo
Supply and Demand. (n.d.). Retrieved Sep 5, 2017, from ssc.wisc.edu:
http://www.ssc.wisc.edu/~scholz/Teaching_101/Lecture3.pdf
Thierer, A. (2011, July 8). Netflix galls prey to MC fallacy . Retrieved sep 8, 2017, from techliberation.com:
https://techliberation.com/2011/07/08/netflix-falls-prey-to-marginal-cost-fallacy-pleads-for-a-
broadband-free-ride/Adam Theirer
1 out of 11
Related Documents
Your All-in-One AI-Powered Toolkit for Academic Success.
+13062052269
info@desklib.com
Available 24*7 on WhatsApp / Email
Unlock your academic potential
Copyright © 2020–2025 A2Z Services. All Rights Reserved. Developed and managed by ZUCOL.


