University Business Economics Assignment: BUECO5903, Sem 2

Verified

Added on  2022/12/27

|15
|2219
|51
Homework Assignment
AI Summary
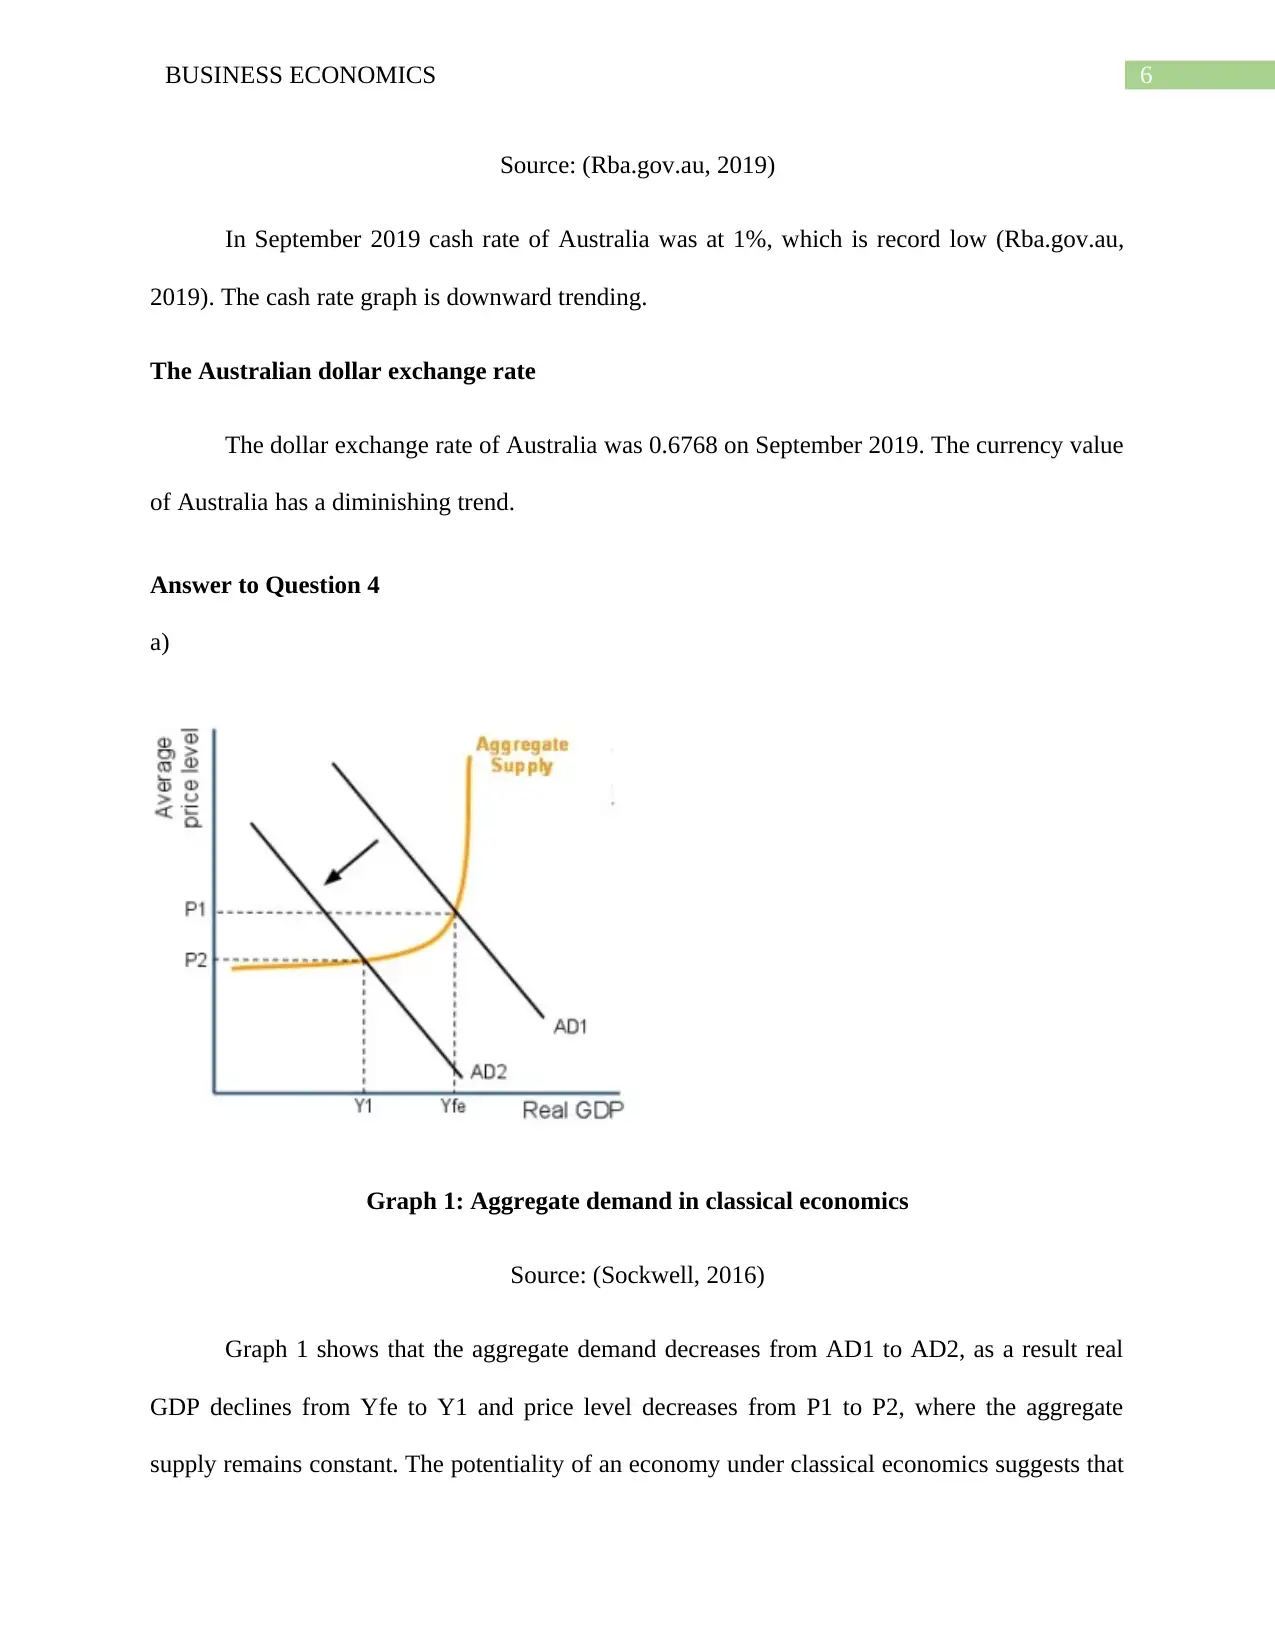
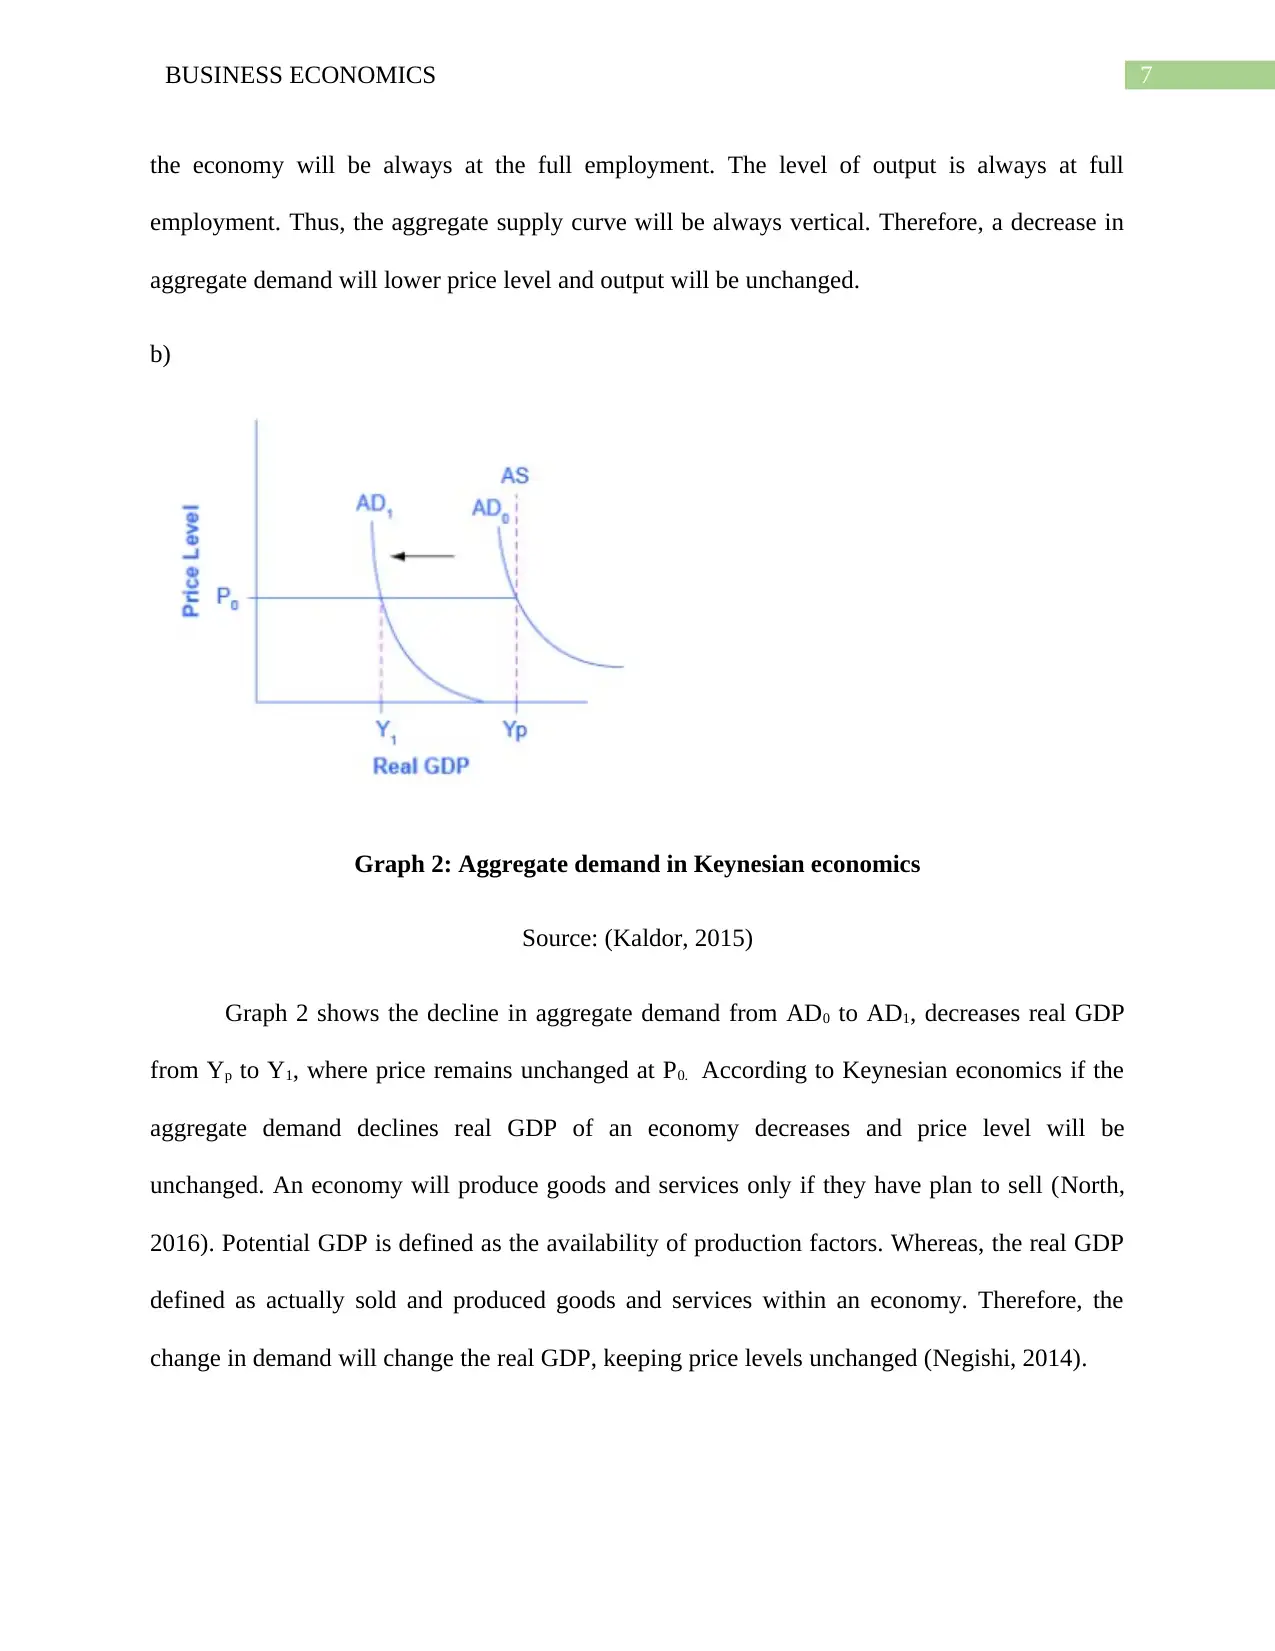
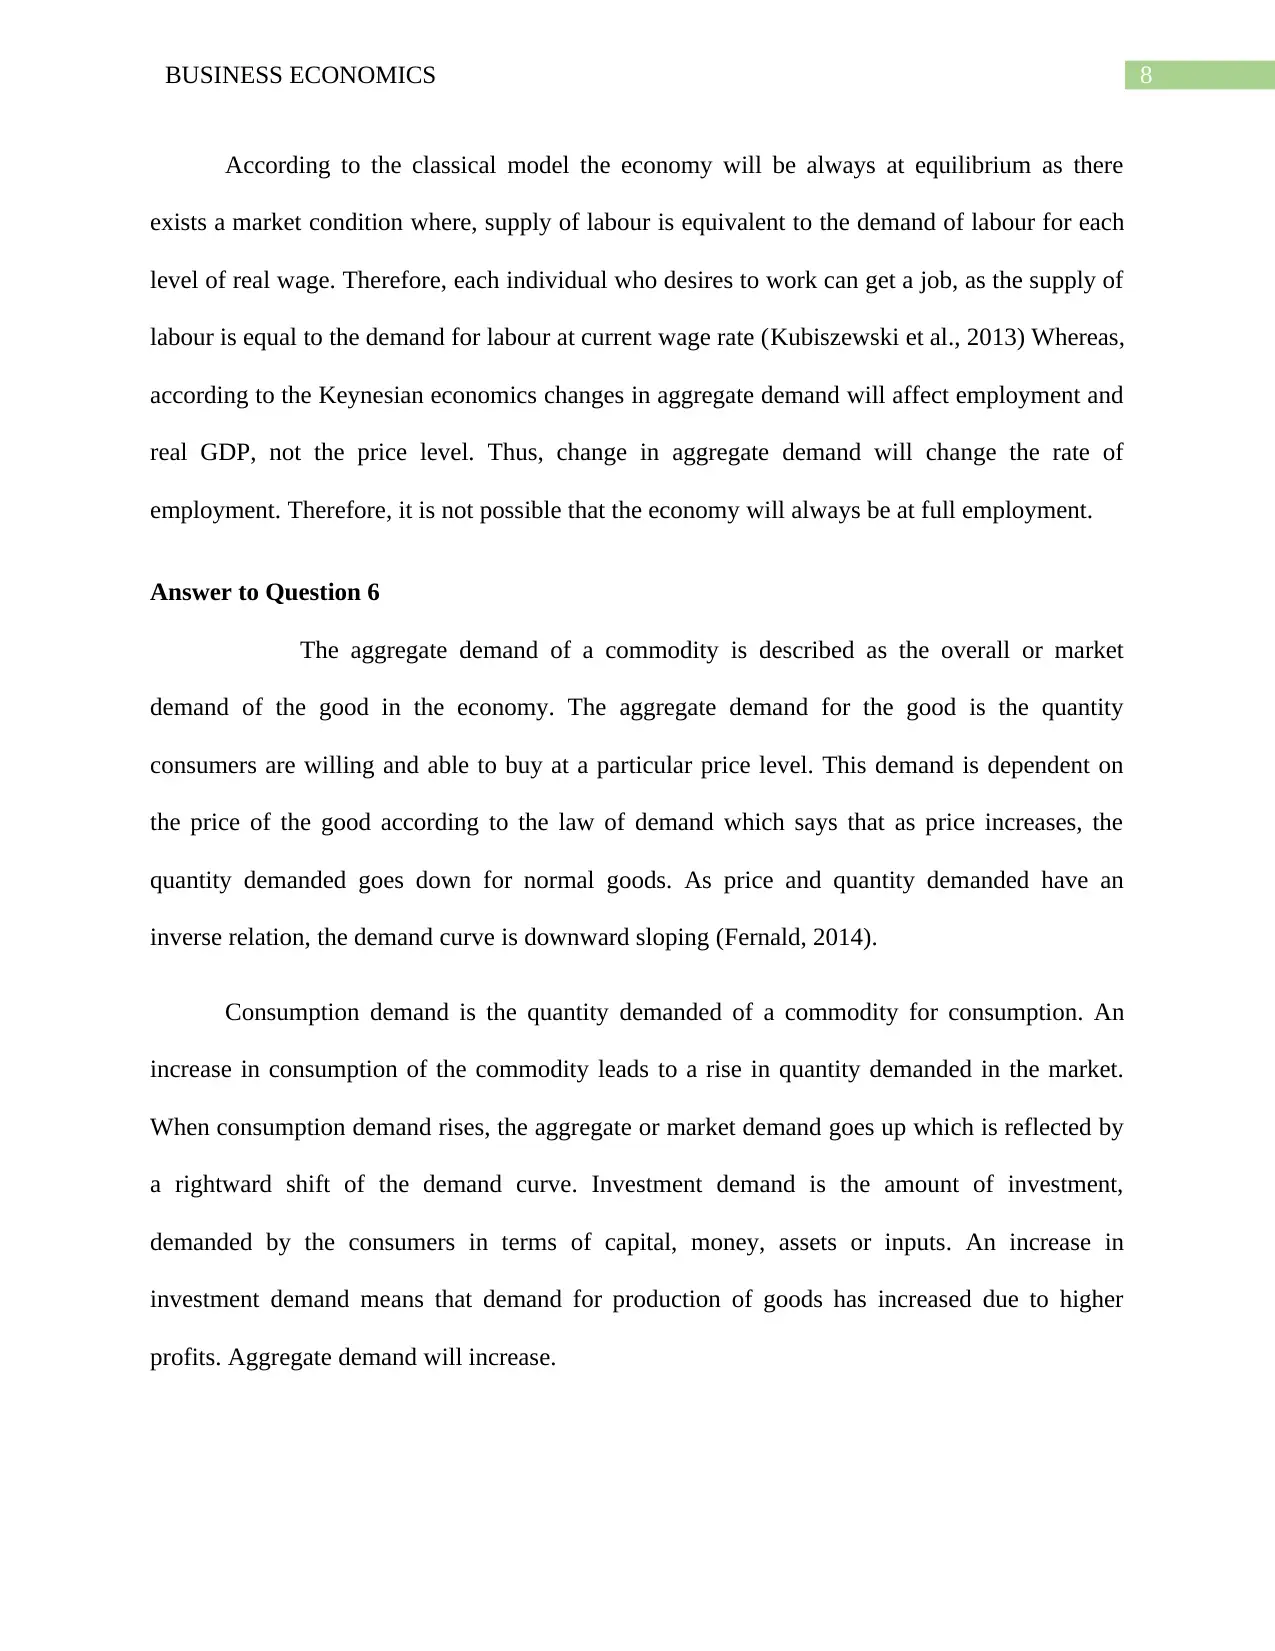
This assignment solution addresses key concepts in business economics, providing answers to several questions from a macroeconomics assignment. It covers topics such as absolute and comparative advantage, inflation and unemployment rates, economic growth, and the impact of exchange rates. The solution analyzes Australian economic data, including inflation, unemployment, and GDP. It also explores the effects of aggregate demand in both classical and Keynesian economics, including graphical representations. Furthermore, the assignment delves into factors affecting aggregate demand, such as consumption, investment, and net exports, and discusses the impact of fiscal policy on recession.
Document Page
Running head: BUSINESS ECONOMICS
Business Economics
Name of the Student
Name of the University
Author note
tabler-icon-diamond-filled.svg

Paraphrase This Document

Need a fresh take? Get an instant paraphrase of this document with our AI Paraphraser
Document Page
1BUSINESS ECONOMICS
Table of Contents
Answer to Question 2a.....................................................................................................................2
Answer to Question 3......................................................................................................................3
Answer to Question 4......................................................................................................................6
Answer to Question 6......................................................................................................................8
Answer to Question 8....................................................................................................................10
References......................................................................................................................................13
Document Page
2BUSINESS ECONOMICS
Answer to Question 2a
When a business or country produces a particular product at a faster rate and a greater
quality for a higher profit than any other business or country, then it is called absolute advantage.
The marginal cost of that product will be relatively low and manufactured in an effective and
efficient manner. When a business or country involves in production of multiple goods with
scarce resources and takes into consideration the lower opportunity cost other than marginal cost,
it is called comparative advantage.
The ratio of prices of export to prices of import is defined as terms of trade. It represents
the amount of import products a country traded for per unit of export products. A particular rate
at which a currency is exchanged with another currency, is known as an exchange rate (Bohi,
2017). There is an impact of exchange rate on the terms of trade of a country. As the change in
currency value will influence the prices of its imports.
The economy is affected by many external shocks, which includes supply-side shock and
demand-side shock. Demand-side shock involves unexpected tax cuts or increase, increase in
unemployment rate, financial crisis and economic downturn. Whereas, supply-side shock
involves political turmoil, unexpected change in technology of production, natural disasters and
sharp increase in price of some commodities.
When the quantity of exports of a country is higher than its quantity of imports, it is
called trade surplus (Haffert & Mehrtens, 2015). There are positive as well as negative effects of
trade surplus. A trade surplus may generate economic growth and more employment and may
increase interest rate and prices of a country. When the amount of income is greater than the
Document Page
3BUSINESS ECONOMICS
expenditures of a country, then it is known as budget surplus. This is an indication that the
budget is efficiently proposed and managed by the existing government.
Answer to Question 3
Inflation rate
Figure 1: Inflation rate of Australia
Source: (Rba.gov.au, 2019)
In June 2019 the annual rate of inflation in Australia was 1.6% (Rba.gov.au, 2019).
Though, the inflation trend of Australian economy is downward slopping.
tabler-icon-diamond-filled.svg

Paraphrase This Document

Need a fresh take? Get an instant paraphrase of this document with our AI Paraphraser
Document Page
4BUSINESS ECONOMICS
Unemployment rate
Figure 2: Unemployment rate of Australia
Source: (Abs.gov.au, 2019)
In August 2019 the rate of unemployment of Australia was 5.3% (Abs.gov.au, 2019). It
increased from the last month unemployment rate of 5.2%. The trend of rate of unemplyment in
Australia is downwad slopping.
Economic growth rate
Document Page
5BUSINESS ECONOMICS
Figure 3: GDP rate of Australia
Source: (Abs.gov.au, 2019)
In June 2019 nominal GDP of Australia was 347.6 USD billion. Whereas, annual GDP
growth rate of Australia was 0.5% in June 2019 (Abs.gov.au, 2019). It is also trending
downward.
The cash rate
Figure 4: Cash rate of Australia
Document Page
6BUSINESS ECONOMICS
Source: (Rba.gov.au, 2019)
In September 2019 cash rate of Australia was at 1%, which is record low (Rba.gov.au,
2019). The cash rate graph is downward trending.
The Australian dollar exchange rate
The dollar exchange rate of Australia was 0.6768 on September 2019. The currency value
of Australia has a diminishing trend.
Answer to Question 4
a)
Graph 1: Aggregate demand in classical economics
Source: (Sockwell, 2016)
Graph 1 shows that the aggregate demand decreases from AD1 to AD2, as a result real
GDP declines from Yfe to Y1 and price level decreases from P1 to P2, where the aggregate
supply remains constant. The potentiality of an economy under classical economics suggests that
tabler-icon-diamond-filled.svg

Paraphrase This Document

Need a fresh take? Get an instant paraphrase of this document with our AI Paraphraser
Document Page
7BUSINESS ECONOMICS
the economy will be always at the full employment. The level of output is always at full
employment. Thus, the aggregate supply curve will be always vertical. Therefore, a decrease in
aggregate demand will lower price level and output will be unchanged.
b)
Graph 2: Aggregate demand in Keynesian economics
Source: (Kaldor, 2015)
Graph 2 shows the decline in aggregate demand from AD0 to AD1, decreases real GDP
from Yp to Y1, where price remains unchanged at P0. According to Keynesian economics if the
aggregate demand declines real GDP of an economy decreases and price level will be
unchanged. An economy will produce goods and services only if they have plan to sell (North,
2016). Potential GDP is defined as the availability of production factors. Whereas, the real GDP
defined as actually sold and produced goods and services within an economy. Therefore, the
change in demand will change the real GDP, keeping price levels unchanged (Negishi, 2014).
Document Page
8BUSINESS ECONOMICS
According to the classical model the economy will be always at equilibrium as there
exists a market condition where, supply of labour is equivalent to the demand of labour for each
level of real wage. Therefore, each individual who desires to work can get a job, as the supply of
labour is equal to the demand for labour at current wage rate (Kubiszewski et al., 2013) Whereas,
according to the Keynesian economics changes in aggregate demand will affect employment and
real GDP, not the price level. Thus, change in aggregate demand will change the rate of
employment. Therefore, it is not possible that the economy will always be at full employment.
Answer to Question 6
The aggregate demand of a commodity is described as the overall or market
demand of the good in the economy. The aggregate demand for the good is the quantity
consumers are willing and able to buy at a particular price level. This demand is dependent on
the price of the good according to the law of demand which says that as price increases, the
quantity demanded goes down for normal goods. As price and quantity demanded have an
inverse relation, the demand curve is downward sloping (Fernald, 2014).
Consumption demand is the quantity demanded of a commodity for consumption. An
increase in consumption of the commodity leads to a rise in quantity demanded in the market.
When consumption demand rises, the aggregate or market demand goes up which is reflected by
a rightward shift of the demand curve. Investment demand is the amount of investment,
demanded by the consumers in terms of capital, money, assets or inputs. An increase in
investment demand means that demand for production of goods has increased due to higher
profits. Aggregate demand will increase.
Document Page
9BUSINESS ECONOMICS
Net export is the value of exports after subtracting the amount of imports. A negative
value of net export determines that the country is importing more goods than they are exporting.
This means that demand for domestic goods has fallen. A positive value of net export establishes
the fact that demand for the commodity has increased outside the economy as well, leading to
rise in aggregate demand and rightward shift of demand curve (Caballero, Farhi & Gourinchas,
2016).
Graph 3: Rise in aggregate demand due to rise in net export, consumer demand and
investment
Source: As created by the author
In all the above cases, a rise in consumption demand, net export and investment demand will
lead to a rise in demand. Demand shifts from D1 to D2 with price and quantity goes up from
P1to P2 and Q1 to Q2 respectively.
tabler-icon-diamond-filled.svg

Paraphrase This Document

Need a fresh take? Get an instant paraphrase of this document with our AI Paraphraser
Document Page
10BUSINESS ECONOMICS
Graph 4: Effect of investment demand on aggregate supply curve
Source: As created by author
Only in case of investment demand, the effect is related to the supply side. Rise in
investment demand means that aggregate supply of goods will go up, making the supply curve to
shift rightward along with demand curve. Supply rises to S2 from S1, leading price to go down
to P2 and quantity increases to Q2.
Answer to Question 8
Quarterly movements in a country’s GDP is beneficial to determine the economic
health of the country and is used to analyze the economic developments quarterly. The money
value of goods and services in an economy is measured by GDP (Gross Domestic Product).
Thus, quarterly calculation helps to keep track of how the economy is performing on a monthly
basis (Kubiszewski et al., 2013). They have a significant role in calculating and monitoring the
monetary and fiscal policies and predict the trends of the future.
Document Page
11BUSINESS ECONOMICS
When an economy faces two successive quarters of negative economic growth, it is
termed as recession (Bordo & Levin, 2017). During recessions, the economy is not in a state of
well-being where businesses does not prosper and economic growth slows down. The central
bank opts for an expansionary fiscal policy to bring the economy out of recession by raising the
government expenditure or lowering the tax. Both of these policies will raise the aggregate
demand for goods due to an increase in money supply and results in eliminating recession.
Graph 5: Expansionary fiscal policy
Source: (Koo, 2013)
Before recession, the economy was producing at the level E1 with the aggregate demand
being AD0 and the short run aggregate supply curve is SRAS0 at the equilibrium price and output
as P0 and Y0 respectively. After the introduction of fiscal policy by the government, the overall
spending goes up, leading to a rise in the aggregate demand which shifts the demand curve to the
chevron_up_icon
1 out of 15
circle_padding
hide_on_mobile
zoom_out_icon
[object Object]