Analyzing Key Economic Variables in the Australian Economy: A Report
VerifiedAdded on 2021/06/17
|15
|3443
|319
Report
AI Summary
This report provides an analysis of the Australian economy by examining key economic variables and their relationships. It explores the connection between real GDP growth and inflation, as well as the relationship between GDP growth and the unemployment rate, using data from 1990 to 2016. The report also identifies evidence of business cycles within the Australian economy and investigates the relationship between net exports and real exchange rates, comparing Australia to the USA. Furthermore, it examines the relationship between the Australian cash rate and the federal cash rate, and concludes with a macroeconomic outlook for Australia, drawing on the analysis to predict potential future economic trends. The report utilizes data from the World Bank to support its findings, offering a comprehensive overview of the Australian economic landscape.
Running head: BUSINESS ECONOMICS
Business Economics
Name of the Student:
Name of the University:
Author’s Note:
Business Economics
Name of the Student:
Name of the University:
Author’s Note:
Paraphrase This Document
Need a fresh take? Get an instant paraphrase of this document with our AI Paraphraser
BUSINESS ECONOMICS 1
Table of Contents
Introduction......................................................................................................................................2
Examining the Relationship between Australia’s Real GDP and Inflation Rate.............................2
Examining the relationship between Australia’s Real GDP Growth Rate and Rate of
Unemployment................................................................................................................................4
Evidence of the existence of business cycle....................................................................................5
Examining the relationship between the Net Exports and Real Exchange Rates between USA and
Australia...........................................................................................................................................6
Relationship between the Australian Cash rate and Federal Cash Rate..........................................9
The Macroeconomic Outlook of Australia....................................................................................10
Reference List................................................................................................................................12
BUSINESS ECONOMICS 2
Introduction
The assignment will enlighten a few key economic variables which can be held
responsible for representing the economic condition of the Australian economy. These variables
are examined and discussed with the help of the real time data available in the website of World
Bank. On an added notion, the assignment will also examine if there is a relationship between
these specific variables or not. Furthermore a conclusion will be drawn on the basis of the above
analysis and it would predict whether the Australian economy will face an inflation or a
recession in the upcoming years.
Examining the Relationship between Australia’s Real GDP and Inflation Rate
The GDP or gross domestic product is defined as the final monetary value of all the
goods and services produced within the boundary of the nation for a stipulated time period. The
gross domestic product amalgamates the private and public consumption expenditures, paid in
construction costs, private inventories and the foreign balance of trade (Kuttner and Shim, 2016).
Henceforth, it is quite evident that GDP can be regarded as the measure of overall economic
activity of a nation. At the same point of the GDP effectively portrays the economic well-being
and standard of living of the people of the country as well. Gross Domestic Product can also be
divided into two categories which are namely nominal GDP and real GDP. Nominal GDP is
simply the value of goods and services produced within the boundaries of the nation for a
specific time period while on the other hand, the real GDP is the same value adjusted against the
prevailing rate of inflation (Rees et al., 2016). In this context it is necessary to mention that the
term inflation signifies a sustained rise in the general price level of the goods and services.
Hence the rate of inflation can be characterized as the rate at which the level of inflation changes
over the passage of time.
⊘ This is a preview!⊘
Do you want full access?
Subscribe today to unlock all pages.
Trusted by 1+ million students worldwide
BUSINESS ECONOMICS 3
1990
1991
1992
1993
1994
1995
1996
1997
1998
1999
2000
2001
2002
2003
2004
2005
2006
2007
2008
2009
2010
2011
2012
2013
2014
2015
2016
-15.00
-10.00
-5.00
0.00
5.00
10.00
15.00
20.00
25.00
30.00
35.00
Real GDP Growth Rate and Inflation
Rate
GDP Growth Rate Inflation Rate
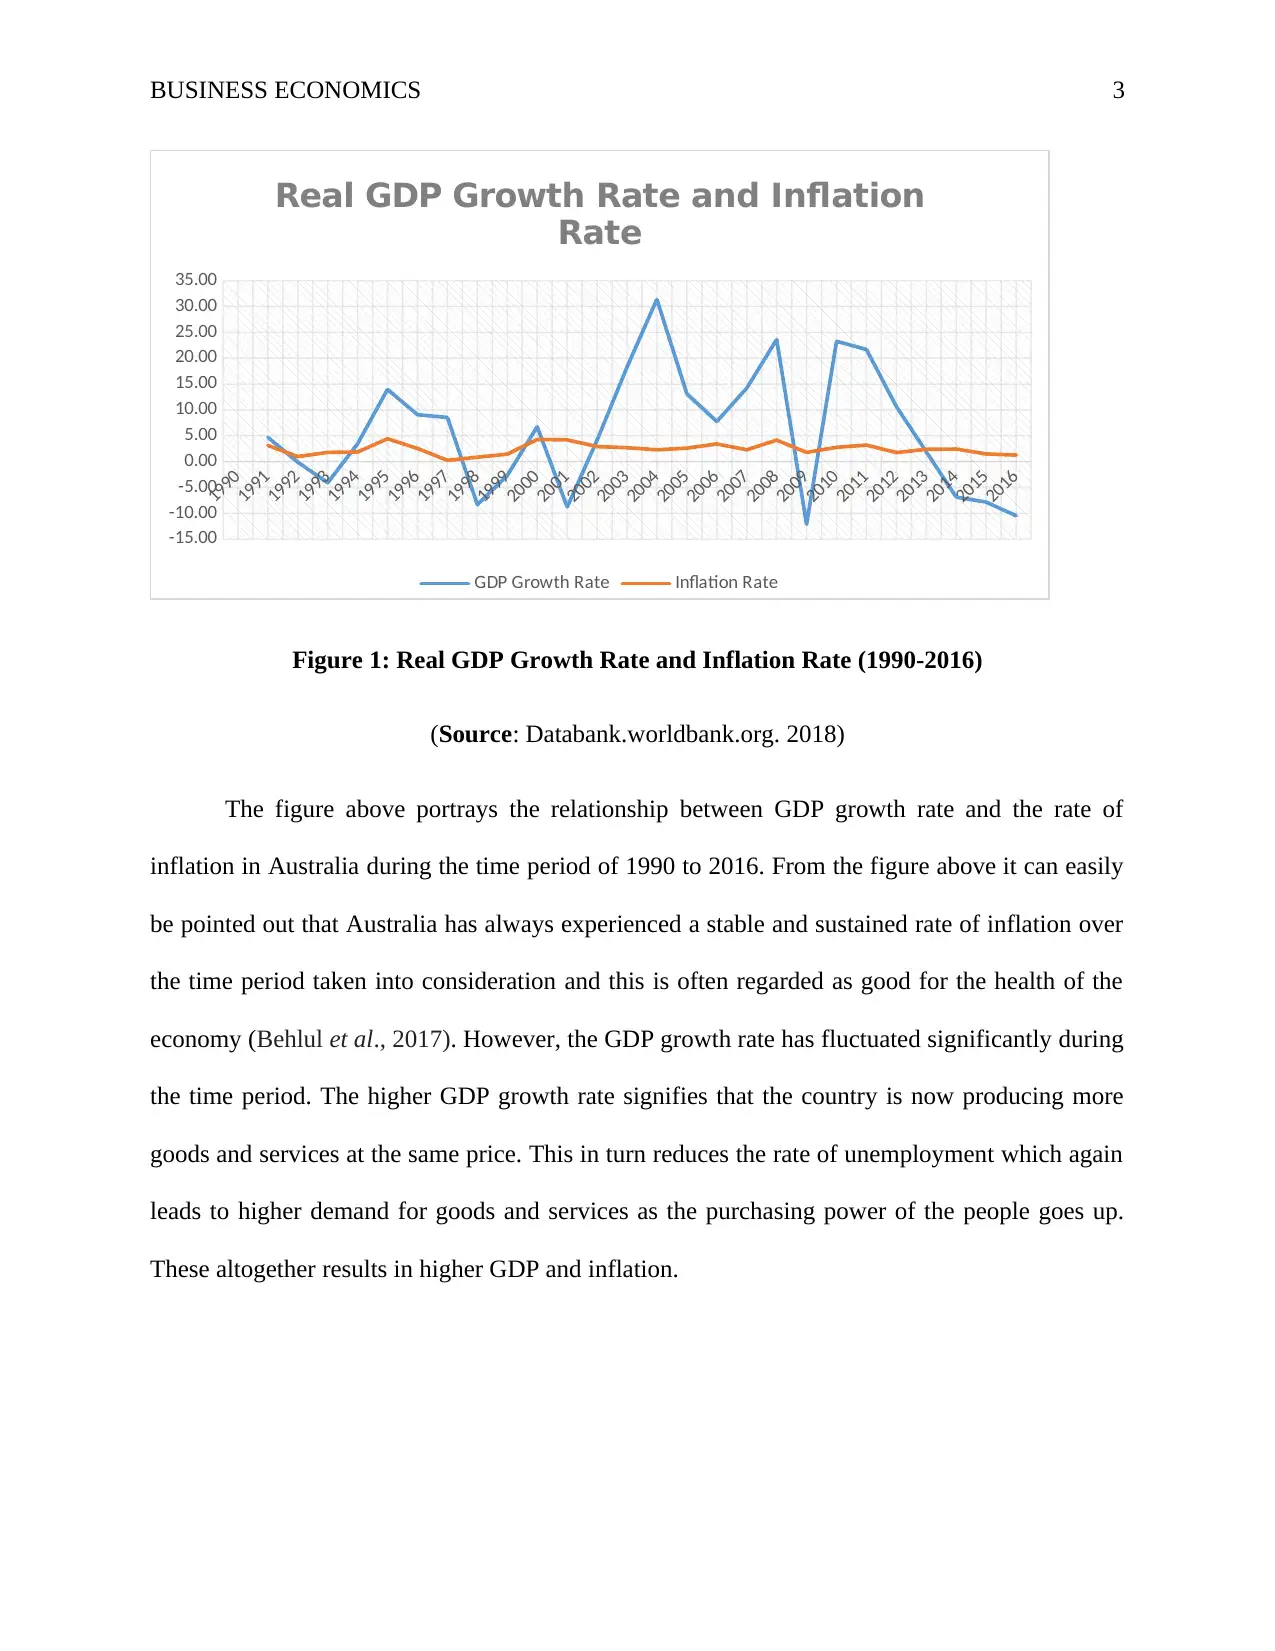
Figure 1: Real GDP Growth Rate and Inflation Rate (1990-2016)
(Source: Databank.worldbank.org. 2018)
The figure above portrays the relationship between GDP growth rate and the rate of
inflation in Australia during the time period of 1990 to 2016. From the figure above it can easily
be pointed out that Australia has always experienced a stable and sustained rate of inflation over
the time period taken into consideration and this is often regarded as good for the health of the
economy (Behlul et al., 2017). However, the GDP growth rate has fluctuated significantly during
the time period. The higher GDP growth rate signifies that the country is now producing more
goods and services at the same price. This in turn reduces the rate of unemployment which again
leads to higher demand for goods and services as the purchasing power of the people goes up.
These altogether results in higher GDP and inflation.
1990
1991
1992
1993
1994
1995
1996
1997
1998
1999
2000
2001
2002
2003
2004
2005
2006
2007
2008
2009
2010
2011
2012
2013
2014
2015
2016
-15.00
-10.00
-5.00
0.00
5.00
10.00
15.00
20.00
25.00
30.00
35.00
Real GDP Growth Rate and Inflation
Rate
GDP Growth Rate Inflation Rate
Figure 1: Real GDP Growth Rate and Inflation Rate (1990-2016)
(Source: Databank.worldbank.org. 2018)
The figure above portrays the relationship between GDP growth rate and the rate of
inflation in Australia during the time period of 1990 to 2016. From the figure above it can easily
be pointed out that Australia has always experienced a stable and sustained rate of inflation over
the time period taken into consideration and this is often regarded as good for the health of the
economy (Behlul et al., 2017). However, the GDP growth rate has fluctuated significantly during
the time period. The higher GDP growth rate signifies that the country is now producing more
goods and services at the same price. This in turn reduces the rate of unemployment which again
leads to higher demand for goods and services as the purchasing power of the people goes up.
These altogether results in higher GDP and inflation.
Paraphrase This Document
Need a fresh take? Get an instant paraphrase of this document with our AI Paraphraser
BUSINESS ECONOMICS 4
Examining the relationship between Australia’s Real GDP Growth Rate and Rate of
Unemployment
1990
1991
1992
1993
1994
1995
1996
1997
1998
1999
2000
2001
2002
2003
2004
2005
2006
2007
2008
2009
2010
2011
2012
2013
2014
2015
2016
-15
-10
-5
0
5
10
15
20
25
30
35
Real GDP Growth Rate and
Unemployment
GDP Growth Rate Unemployment Rate
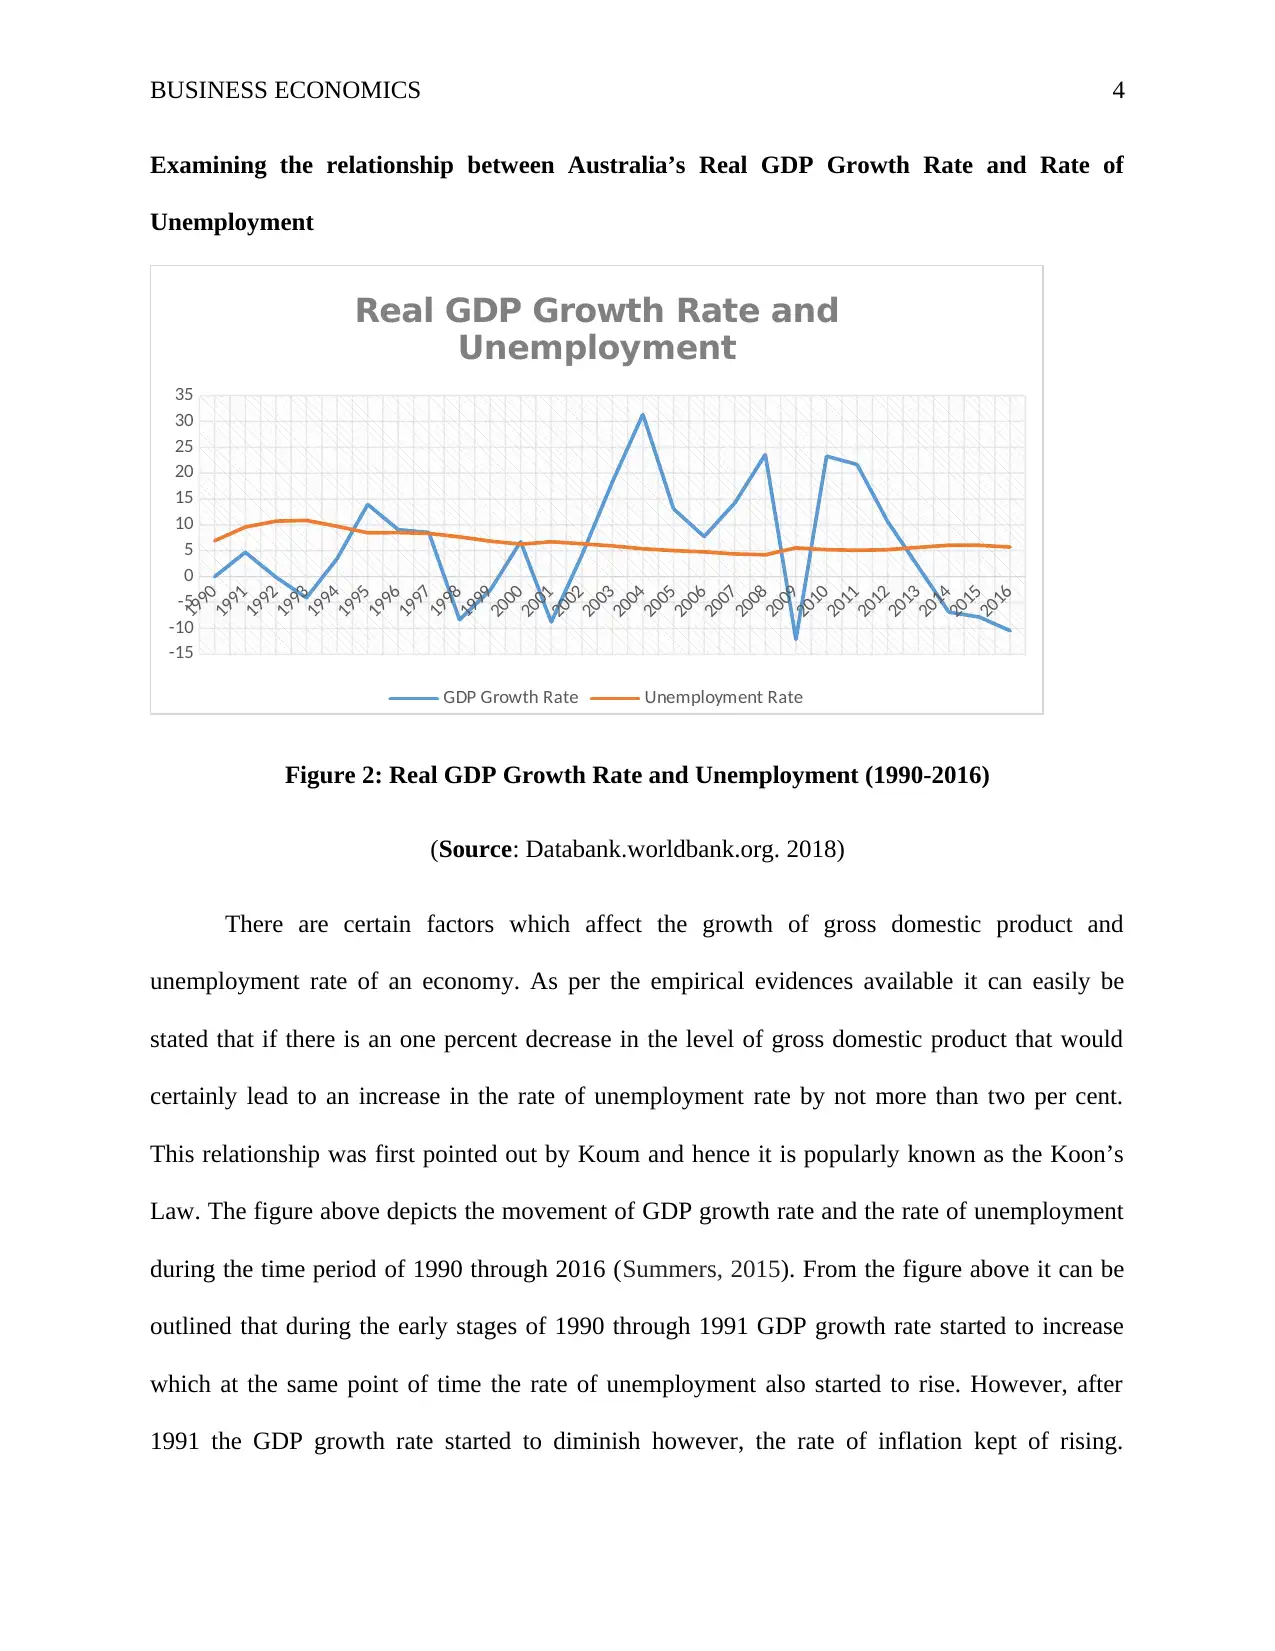
Figure 2: Real GDP Growth Rate and Unemployment (1990-2016)
(Source: Databank.worldbank.org. 2018)
There are certain factors which affect the growth of gross domestic product and
unemployment rate of an economy. As per the empirical evidences available it can easily be
stated that if there is an one percent decrease in the level of gross domestic product that would
certainly lead to an increase in the rate of unemployment rate by not more than two per cent.
This relationship was first pointed out by Koum and hence it is popularly known as the Koon’s
Law. The figure above depicts the movement of GDP growth rate and the rate of unemployment
during the time period of 1990 through 2016 (Summers, 2015). From the figure above it can be
outlined that during the early stages of 1990 through 1991 GDP growth rate started to increase
which at the same point of time the rate of unemployment also started to rise. However, after
1991 the GDP growth rate started to diminish however, the rate of inflation kept of rising.
Examining the relationship between Australia’s Real GDP Growth Rate and Rate of
Unemployment
1990
1991
1992
1993
1994
1995
1996
1997
1998
1999
2000
2001
2002
2003
2004
2005
2006
2007
2008
2009
2010
2011
2012
2013
2014
2015
2016
-15
-10
-5
0
5
10
15
20
25
30
35
Real GDP Growth Rate and
Unemployment
GDP Growth Rate Unemployment Rate
Figure 2: Real GDP Growth Rate and Unemployment (1990-2016)
(Source: Databank.worldbank.org. 2018)
There are certain factors which affect the growth of gross domestic product and
unemployment rate of an economy. As per the empirical evidences available it can easily be
stated that if there is an one percent decrease in the level of gross domestic product that would
certainly lead to an increase in the rate of unemployment rate by not more than two per cent.
This relationship was first pointed out by Koum and hence it is popularly known as the Koon’s
Law. The figure above depicts the movement of GDP growth rate and the rate of unemployment
during the time period of 1990 through 2016 (Summers, 2015). From the figure above it can be
outlined that during the early stages of 1990 through 1991 GDP growth rate started to increase
which at the same point of time the rate of unemployment also started to rise. However, after
1991 the GDP growth rate started to diminish however, the rate of inflation kept of rising.
BUSINESS ECONOMICS 5
Although the GDP growth rate increased again during the time periods 2001 to 2004, 2006 to
2008 and again during 2009 to 2010. However, during these time points the unemployment rate
remained almost the same although during the period of global financial crisis for the time period
while the GDP growth rate started to decline the unemployment rate portrayed a slight increase
(Manalo et al., 2015). Therefore, it can be stated that the movements of these two variables
across the selected time period have depicted significant deviation from the historical evidences.
Economists have argued that there will be a decrease in the rate of unemployment right after the
recovery from the recession as the Okun’s law suggested that an increase in the GDP growth rate
would lead to a decrease in the rate of unemployment (Downes et al., 2014). However, in reality
this was not the scenario the GDP growth rate increased substantially but the unemployment rate
remained almost the same.
Evidence of the existence of business cycle
1990
1992
1994
1996
1998
2000
2002
2004
2006
2008
2010
2012
2014
2016
-30.00
-25.00
-20.00
-15.00
-10.00
-5.00
0.00
5.00
10.00
15.00
20.00
Exchange Rate and Net Exports
Exchange Rate Net Exports
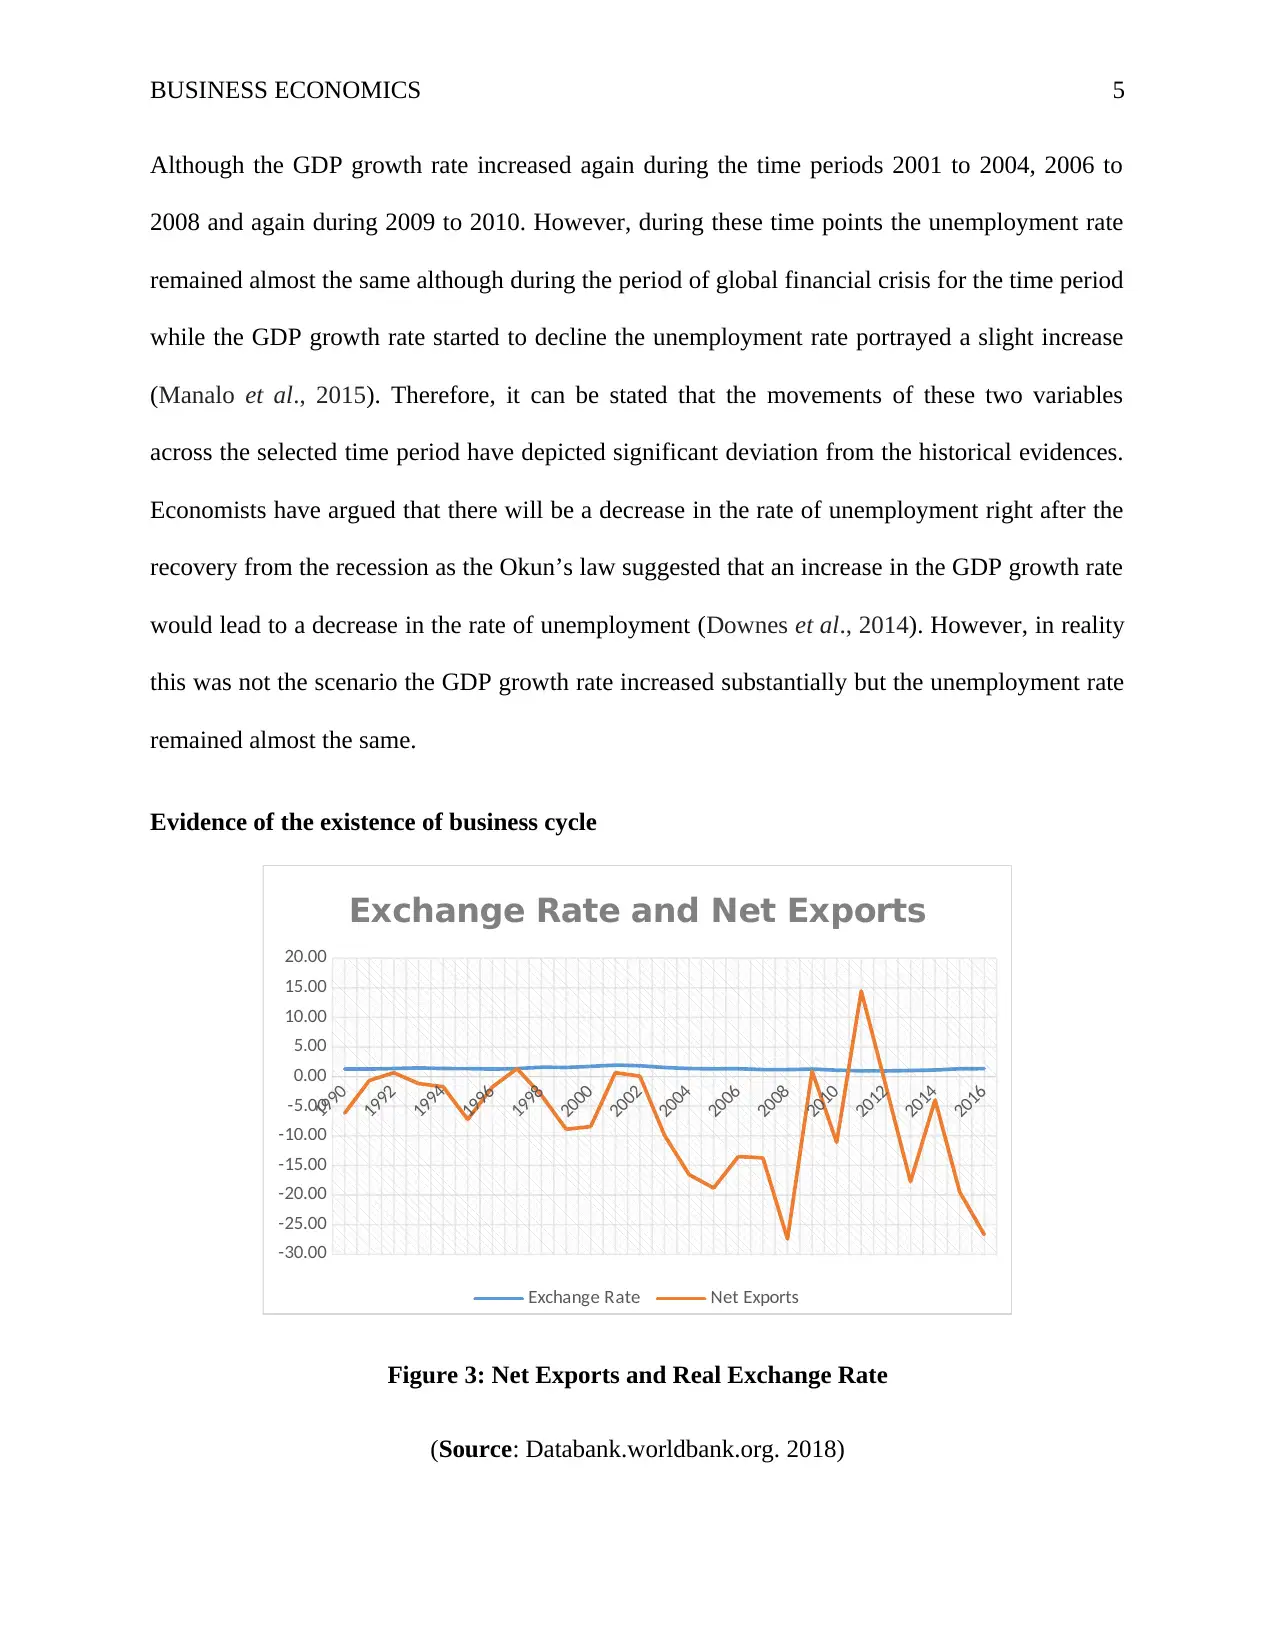
Figure 3: Net Exports and Real Exchange Rate
(Source: Databank.worldbank.org. 2018)
Although the GDP growth rate increased again during the time periods 2001 to 2004, 2006 to
2008 and again during 2009 to 2010. However, during these time points the unemployment rate
remained almost the same although during the period of global financial crisis for the time period
while the GDP growth rate started to decline the unemployment rate portrayed a slight increase
(Manalo et al., 2015). Therefore, it can be stated that the movements of these two variables
across the selected time period have depicted significant deviation from the historical evidences.
Economists have argued that there will be a decrease in the rate of unemployment right after the
recovery from the recession as the Okun’s law suggested that an increase in the GDP growth rate
would lead to a decrease in the rate of unemployment (Downes et al., 2014). However, in reality
this was not the scenario the GDP growth rate increased substantially but the unemployment rate
remained almost the same.
Evidence of the existence of business cycle
1990
1992
1994
1996
1998
2000
2002
2004
2006
2008
2010
2012
2014
2016
-30.00
-25.00
-20.00
-15.00
-10.00
-5.00
0.00
5.00
10.00
15.00
20.00
Exchange Rate and Net Exports
Exchange Rate Net Exports
Figure 3: Net Exports and Real Exchange Rate
(Source: Databank.worldbank.org. 2018)
⊘ This is a preview!⊘
Do you want full access?
Subscribe today to unlock all pages.
Trusted by 1+ million students worldwide
BUSINESS ECONOMICS 6
The business cycle is characterized as the periodic and natural rise or fall of the economic
growth rate of a nation. The business cycle is considered as one of the most important tool which
is extensively used for analyzing and predictive purposes of an economy. In a standard business
cycle there are mainly four distinct stages which are expansion, peak, contraction and trough. In
relation to the current scenario it can be stated that there is clear evidence of the existence of
business cycle (Rey, 2015). For instance during the time period 2001 through 2004 and 2006
through 2008 the GDP growth rate of the Australian economy depicted significant rise which can
be regarded as the expansion phase of the business cycle. Although the emergence of global
financial crisis the GDP growth rate started to decline from the peak of 2008 and this period after
2008 can be regarded as the phase of contraction. During the year 2009 the economy again
started to recover from the trough (Goodman et al., 2017). In relation to the two diagrams as
stated above it can be observed that the rate of unemployment and inflation also varied
accordingly with the variations in the growth rate of GDP.
Examining the relationship between the Net Exports and Real Exchange Rates between
USA and Australia
The net exports of a country can be defined as the monetary value of the total exports of
the country less than the monetary value of the total imports of the nation. The net exports is
used for estimating the expenditure within the country or measuring the gross domestic product
of an open economy. Author, have defined net exports as the extent to which the expenditure on
the part of the goods and services of the home country supersedes the expenditure of the home
country over the foreign goods and services of the foreign country.
On the other hand, the exchange rate is characterized as the price of currency of a nation
in terms of the currency of the other nation (Hannaford and Allen, 2015). Therefore, it can be
Paraphrase This Document
Need a fresh take? Get an instant paraphrase of this document with our AI Paraphraser
BUSINESS ECONOMICS 7
stated that the exchange rate possesses two distinct components which are domestic currency and
foreign currency and it can either be quoted directly or indirectly. In the genre of direct quotation
the unit price of the foreign currency is expressed in terms of the domestic currency. On the other
hand, under indirect quotation regime the unit price of the domestic currency is expressed in
terms of the foreign currency.
1990
1992
1994
1996
1998
2000
2002
2004
2006
2008
2010
2012
2014
2016
0
2
4
6
8
10
12
14
Federal and Australian Cash Rate (1990-2016)
Cash Rate (Australia) Federal Cash Rate
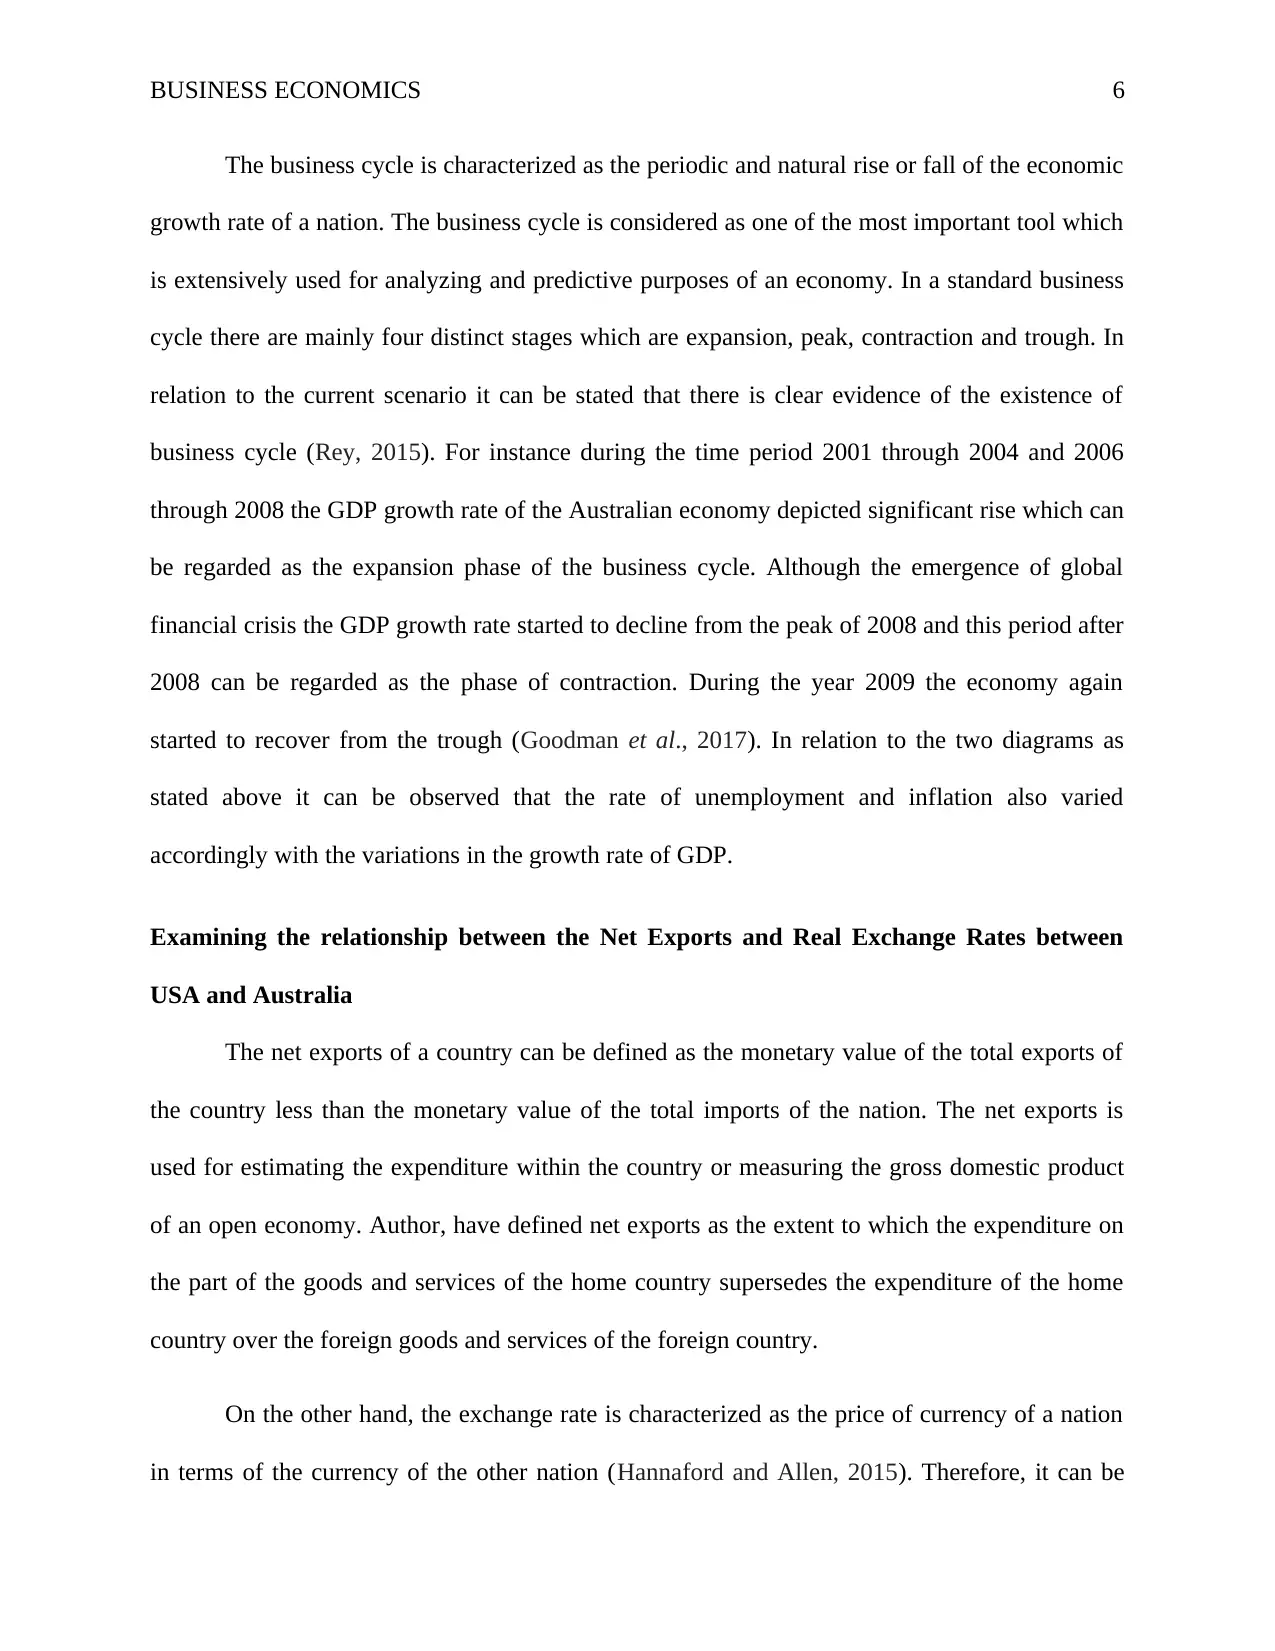
Figure 4: Federal and Australian Cash Rate (1990-2016)
(Source: Databank.worldbank.org. 2018)
The diagram above represents the value of the exchange rate of Australian Dollar against
the U.S. Dollar and the value of net exports for the time period of 1990 through 2016. It is
expected that the relationship between these two variables can be traced out through this
diagram.
As it can be observed from the figure above that the exchange rate of Australia remained
almost the same during the selected time period and has not depicted any significant fluctuations
as well (Waemustafa and Sukri, 2016). However, in relation to the net exports it can be observed
stated that the exchange rate possesses two distinct components which are domestic currency and
foreign currency and it can either be quoted directly or indirectly. In the genre of direct quotation
the unit price of the foreign currency is expressed in terms of the domestic currency. On the other
hand, under indirect quotation regime the unit price of the domestic currency is expressed in
terms of the foreign currency.
1990
1992
1994
1996
1998
2000
2002
2004
2006
2008
2010
2012
2014
2016
0
2
4
6
8
10
12
14
Federal and Australian Cash Rate (1990-2016)
Cash Rate (Australia) Federal Cash Rate
Figure 4: Federal and Australian Cash Rate (1990-2016)
(Source: Databank.worldbank.org. 2018)
The diagram above represents the value of the exchange rate of Australian Dollar against
the U.S. Dollar and the value of net exports for the time period of 1990 through 2016. It is
expected that the relationship between these two variables can be traced out through this
diagram.
As it can be observed from the figure above that the exchange rate of Australia remained
almost the same during the selected time period and has not depicted any significant fluctuations
as well (Waemustafa and Sukri, 2016). However, in relation to the net exports it can be observed
BUSINESS ECONOMICS 8
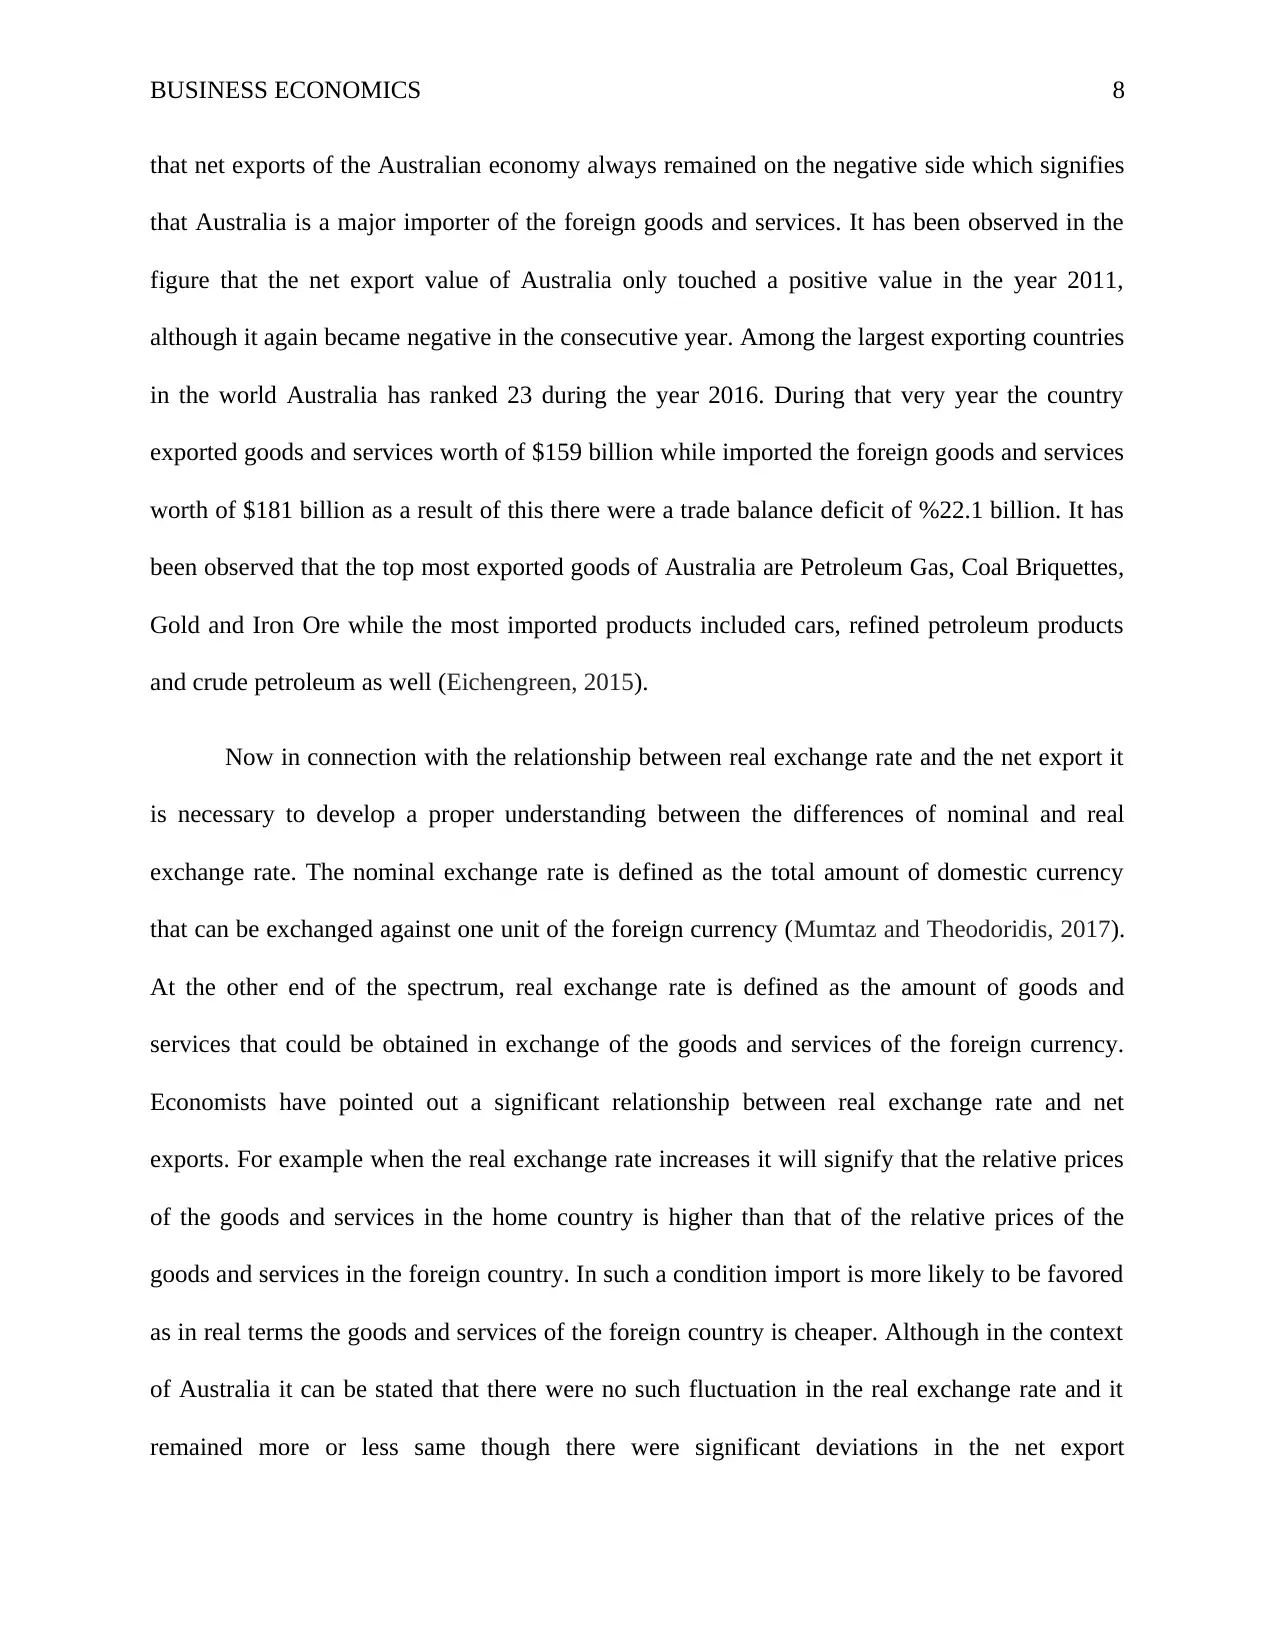
that net exports of the Australian economy always remained on the negative side which signifies
that Australia is a major importer of the foreign goods and services. It has been observed in the
figure that the net export value of Australia only touched a positive value in the year 2011,
although it again became negative in the consecutive year. Among the largest exporting countries
in the world Australia has ranked 23 during the year 2016. During that very year the country
exported goods and services worth of $159 billion while imported the foreign goods and services
worth of $181 billion as a result of this there were a trade balance deficit of %22.1 billion. It has
been observed that the top most exported goods of Australia are Petroleum Gas, Coal Briquettes,
Gold and Iron Ore while the most imported products included cars, refined petroleum products
and crude petroleum as well (Eichengreen, 2015).
Now in connection with the relationship between real exchange rate and the net export it
is necessary to develop a proper understanding between the differences of nominal and real
exchange rate. The nominal exchange rate is defined as the total amount of domestic currency
that can be exchanged against one unit of the foreign currency (Mumtaz and Theodoridis, 2017).
At the other end of the spectrum, real exchange rate is defined as the amount of goods and
services that could be obtained in exchange of the goods and services of the foreign currency.
Economists have pointed out a significant relationship between real exchange rate and net
exports. For example when the real exchange rate increases it will signify that the relative prices
of the goods and services in the home country is higher than that of the relative prices of the
goods and services in the foreign country. In such a condition import is more likely to be favored
as in real terms the goods and services of the foreign country is cheaper. Although in the context
of Australia it can be stated that there were no such fluctuation in the real exchange rate and it
remained more or less same though there were significant deviations in the net export
⊘ This is a preview!⊘
Do you want full access?
Subscribe today to unlock all pages.
Trusted by 1+ million students worldwide
BUSINESS ECONOMICS 9
(McCombie and Thirlwall, 2016). Henceforth it can be stated that there is no such relationship
between the real exchange rate and net export in Australia at least for the given time period.
Relationship between the Australian Cash rate and Federal Cash Rate
Cash rate is characterized as the interest rate which is charged by the central bank for the
overnight borrowings of the commercial banks. The system of cash rate indirectly influences the
prevailing interest rate in the economy. On the other hand, the cash arte target expresses the
monetary policy decisions.
The Reserve Bank of Australia follows a strict approach for the implementation of
monetary policies which is also known as the inflation targeting. This in turn signifies the fact
that the country sets a numerical target of inflation and thereby develops a significant framework
for achieving that target (Eichenbaum et al., 2017). The cash rate of Australia touched the lowest
value of 1.5 per cent. This lowest value signifies that if there is a negative shock over the
economy the government would merely get a chance to influence the cash rate anymore. It is
also matter of fact that when the inflation rate is below the target level the reduction in the cash
rate would in turn signify a reduction in the long term interest rate which allows the people to
buy more of the goods and services. This increase in the demand also increases the price level
and brings back the inflation to its previous level.
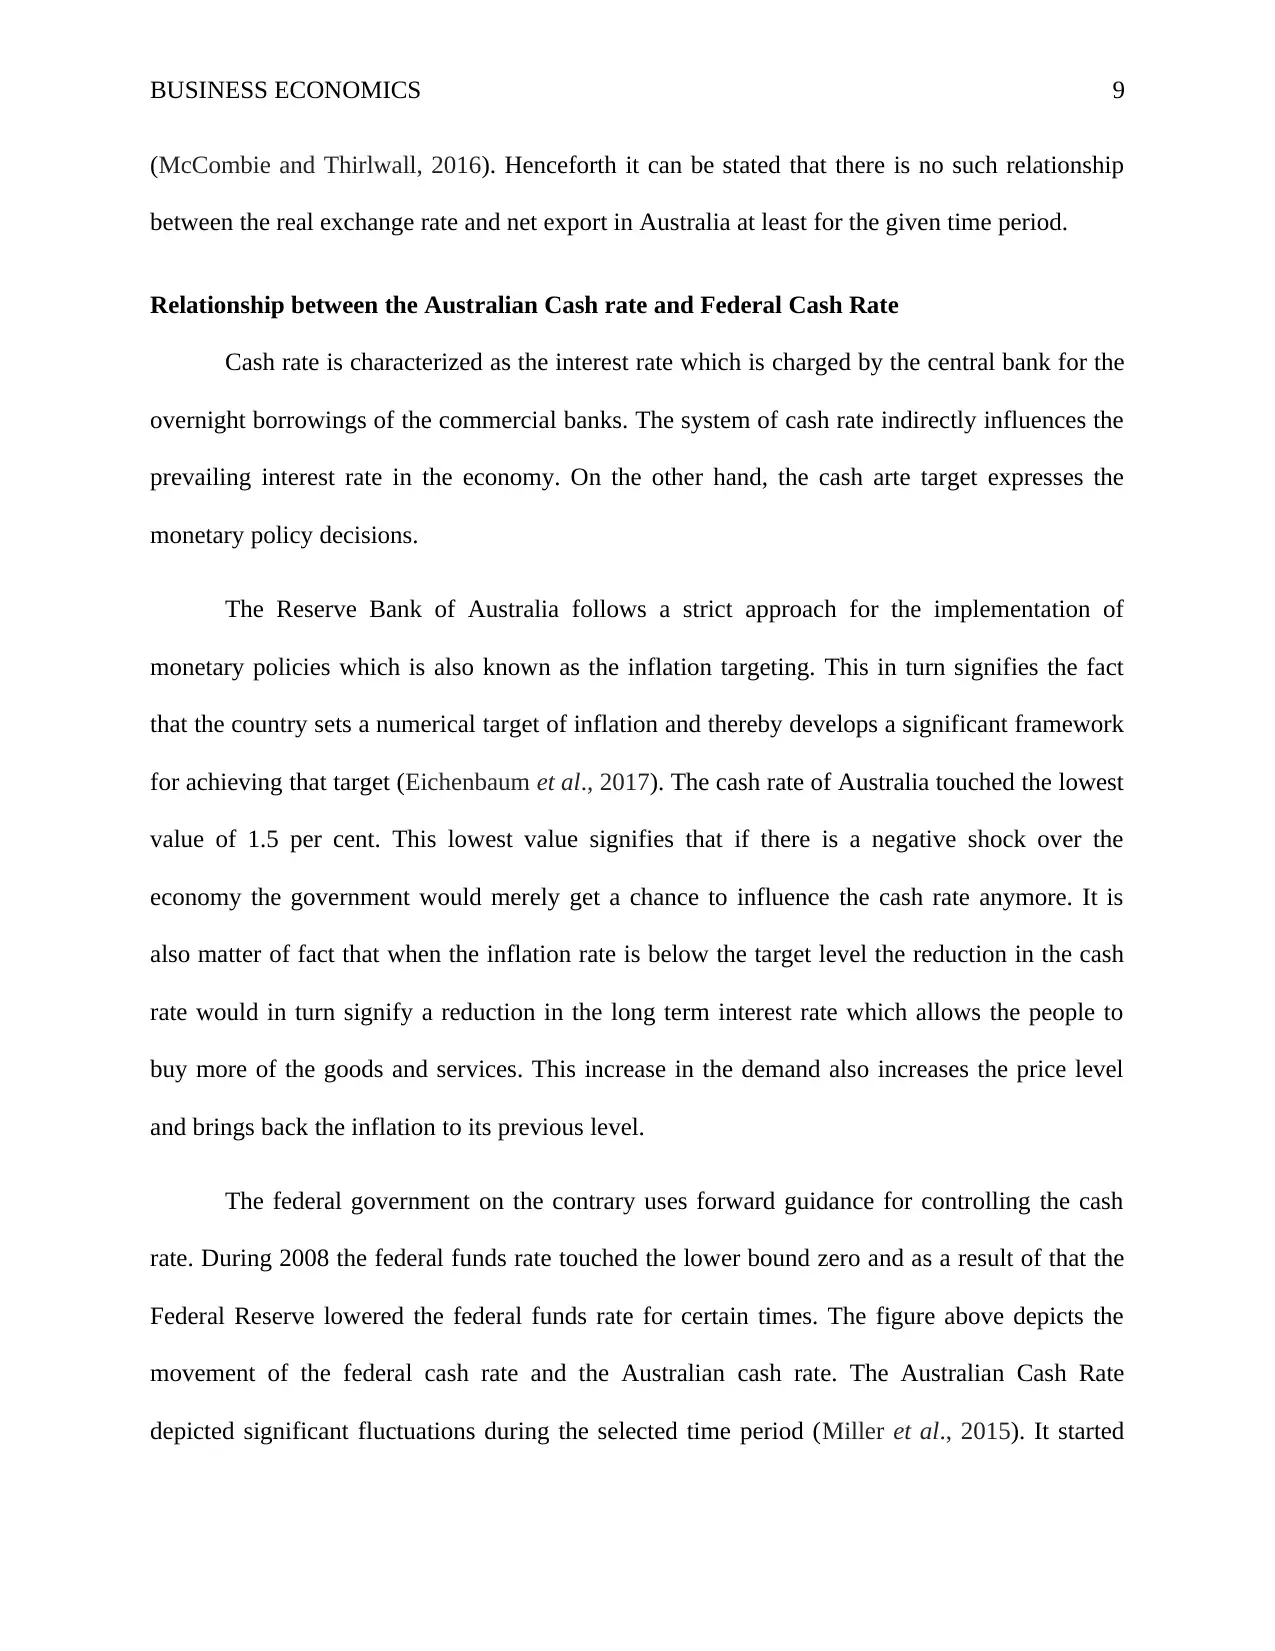
The federal government on the contrary uses forward guidance for controlling the cash
rate. During 2008 the federal funds rate touched the lower bound zero and as a result of that the
Federal Reserve lowered the federal funds rate for certain times. The figure above depicts the
movement of the federal cash rate and the Australian cash rate. The Australian Cash Rate
depicted significant fluctuations during the selected time period (Miller et al., 2015). It started
(McCombie and Thirlwall, 2016). Henceforth it can be stated that there is no such relationship
between the real exchange rate and net export in Australia at least for the given time period.
Relationship between the Australian Cash rate and Federal Cash Rate
Cash rate is characterized as the interest rate which is charged by the central bank for the
overnight borrowings of the commercial banks. The system of cash rate indirectly influences the
prevailing interest rate in the economy. On the other hand, the cash arte target expresses the
monetary policy decisions.
The Reserve Bank of Australia follows a strict approach for the implementation of
monetary policies which is also known as the inflation targeting. This in turn signifies the fact
that the country sets a numerical target of inflation and thereby develops a significant framework
for achieving that target (Eichenbaum et al., 2017). The cash rate of Australia touched the lowest
value of 1.5 per cent. This lowest value signifies that if there is a negative shock over the
economy the government would merely get a chance to influence the cash rate anymore. It is
also matter of fact that when the inflation rate is below the target level the reduction in the cash
rate would in turn signify a reduction in the long term interest rate which allows the people to
buy more of the goods and services. This increase in the demand also increases the price level
and brings back the inflation to its previous level.
The federal government on the contrary uses forward guidance for controlling the cash
rate. During 2008 the federal funds rate touched the lower bound zero and as a result of that the
Federal Reserve lowered the federal funds rate for certain times. The figure above depicts the
movement of the federal cash rate and the Australian cash rate. The Australian Cash Rate
depicted significant fluctuations during the selected time period (Miller et al., 2015). It started
Paraphrase This Document
Need a fresh take? Get an instant paraphrase of this document with our AI Paraphraser
BUSINESS ECONOMICS 10
declining from the high value since 1990 and reached the lowest value during 1995 the same
value it has achieved during 2004 and 2014 as well. During the rest of the years it maintained a
sustained value. On the other hand, the Federal Cash Rate has also fluctuated during 1990 to
2008 it depicted several rise and falls (Summers, 2014). However after 2008 it maintained a
lower value almost equal to zero. In the context of the relationship between the Australian Cash
Rate and Federal Cash Rate it can be stated that these two are the two different components of
the monetary policy of two different countries. Hence it is quite natural that there would be no
relationship between these two. However, if the federal cash rate can influence the exchange rate
of the Australian economy then the Australian cash rate could be influenced by the changes in
the federal Cash Rate.
The Macroeconomic Outlook of Australia
On the basis of the empirical data analyzed throughout the study suggested the fact that
the economy of Australia will continue to flourish in near future. The GDP growth rate of the
country is depicting as steady growth rate the investments apart from the mining and housing
industry will increase (Panizza and Presbitero, 2014). As the resource capacities of the country is
increasing it will result in a rise in the level of exports as well. On an added notion, further
strengthening of the labor market and the household incomes will help to sustain the private
consumptions. This will give rise to an increase in the wage rate and the inflation rate as well
(Fornero et al., 2016).
The GD growth rate, rate of inflation as well as the rate of unemployment strictly depicts
that currently Australian economy is in a very good health and shape. The country managed to
sustain a substantial GDP growth rate even after the emergence of the global financial crisis the
country managed to recover quickly. On the other hand, Australian economy managed to
BUSINESS ECONOMICS 11
maintain a substantially lower level of unemployment which signifies that the wage rate
prevailing in the economy could attract substantially large number of workers to the industry. In
the context of inflation it can be stated that the inflation rate has remained stable throughout the
selected time period (Nakamura et al., 2016). Therefore, it can be forecasted that the country in
near future may experience an inflation but chances are low that it will face any financial
downfall. This is because the business cycle of the country depicts that during 2016 the country
has achieved a trough and it is thereby now in a stage of recovery and it can easily be expected
that it will continue to rise as the recovery phase will emerge. Henceforth, it can be expected that
the country will face an inflation in near future.
⊘ This is a preview!⊘
Do you want full access?
Subscribe today to unlock all pages.
Trusted by 1+ million students worldwide
1 out of 15
Related Documents


Your All-in-One AI-Powered Toolkit for Academic Success.
+13062052269
info@desklib.com
Available 24*7 on WhatsApp / Email
![[object Object]](/_next/static/media/star-bottom.7253800d.svg)
Unlock your academic potential
Copyright © 2020–2026 A2Z Services. All Rights Reserved. Developed and managed by ZUCOL.