BEO6600 Business Economics T1 2018: Analysis of Bitcoin and Trade
VerifiedAdded on 2023/06/11
|18
|3887
|420
Report
AI Summary
This report delves into various aspects of business economics, focusing on Bitcoin's demand and supply dynamics, market price determination, and economic importance. It also analyzes the impact of trade policies such as tariffs and subsidies, using the example of Canadian wine imports from Australia. The report discusses the effects of these policies on consumer and producer surplus, government revenue, and potential deadweight losses. Furthermore, it explores trade pacts like the Canada-Australia Trade and Economic Cooperation Arrangement (TECA) as a means for Australia to address trade barriers. The document is intended to provide insights into the complexities of international trade and the role of government intervention in markets.
Running head: BUSINESS ECONOMICS
Business Economics
Name of the student:
Name of the University:
Author note
Business Economics
Name of the student:
Name of the University:
Author note
Paraphrase This Document
Need a fresh take? Get an instant paraphrase of this document with our AI Paraphraser
1BUSINESS ECONOMICS
Table of Contents
Part 1:.........................................................................................................................................2
1.1:..........................................................................................................................................2
1.2:..........................................................................................................................................4
1.3:..........................................................................................................................................5
Part 2:.........................................................................................................................................7
2.1:..........................................................................................................................................7
2.2:..........................................................................................................................................8
2.3:........................................................................................................................................10
Part 3:.......................................................................................................................................11
3.1:........................................................................................................................................11
3.2:........................................................................................................................................11
3.3:........................................................................................................................................12
Reference:................................................................................................................................13
2BUSINESS ECONOMICS
Demand
P0
P1
Price
Quantity demandedQ1 Q0
Part 1:
1.1:
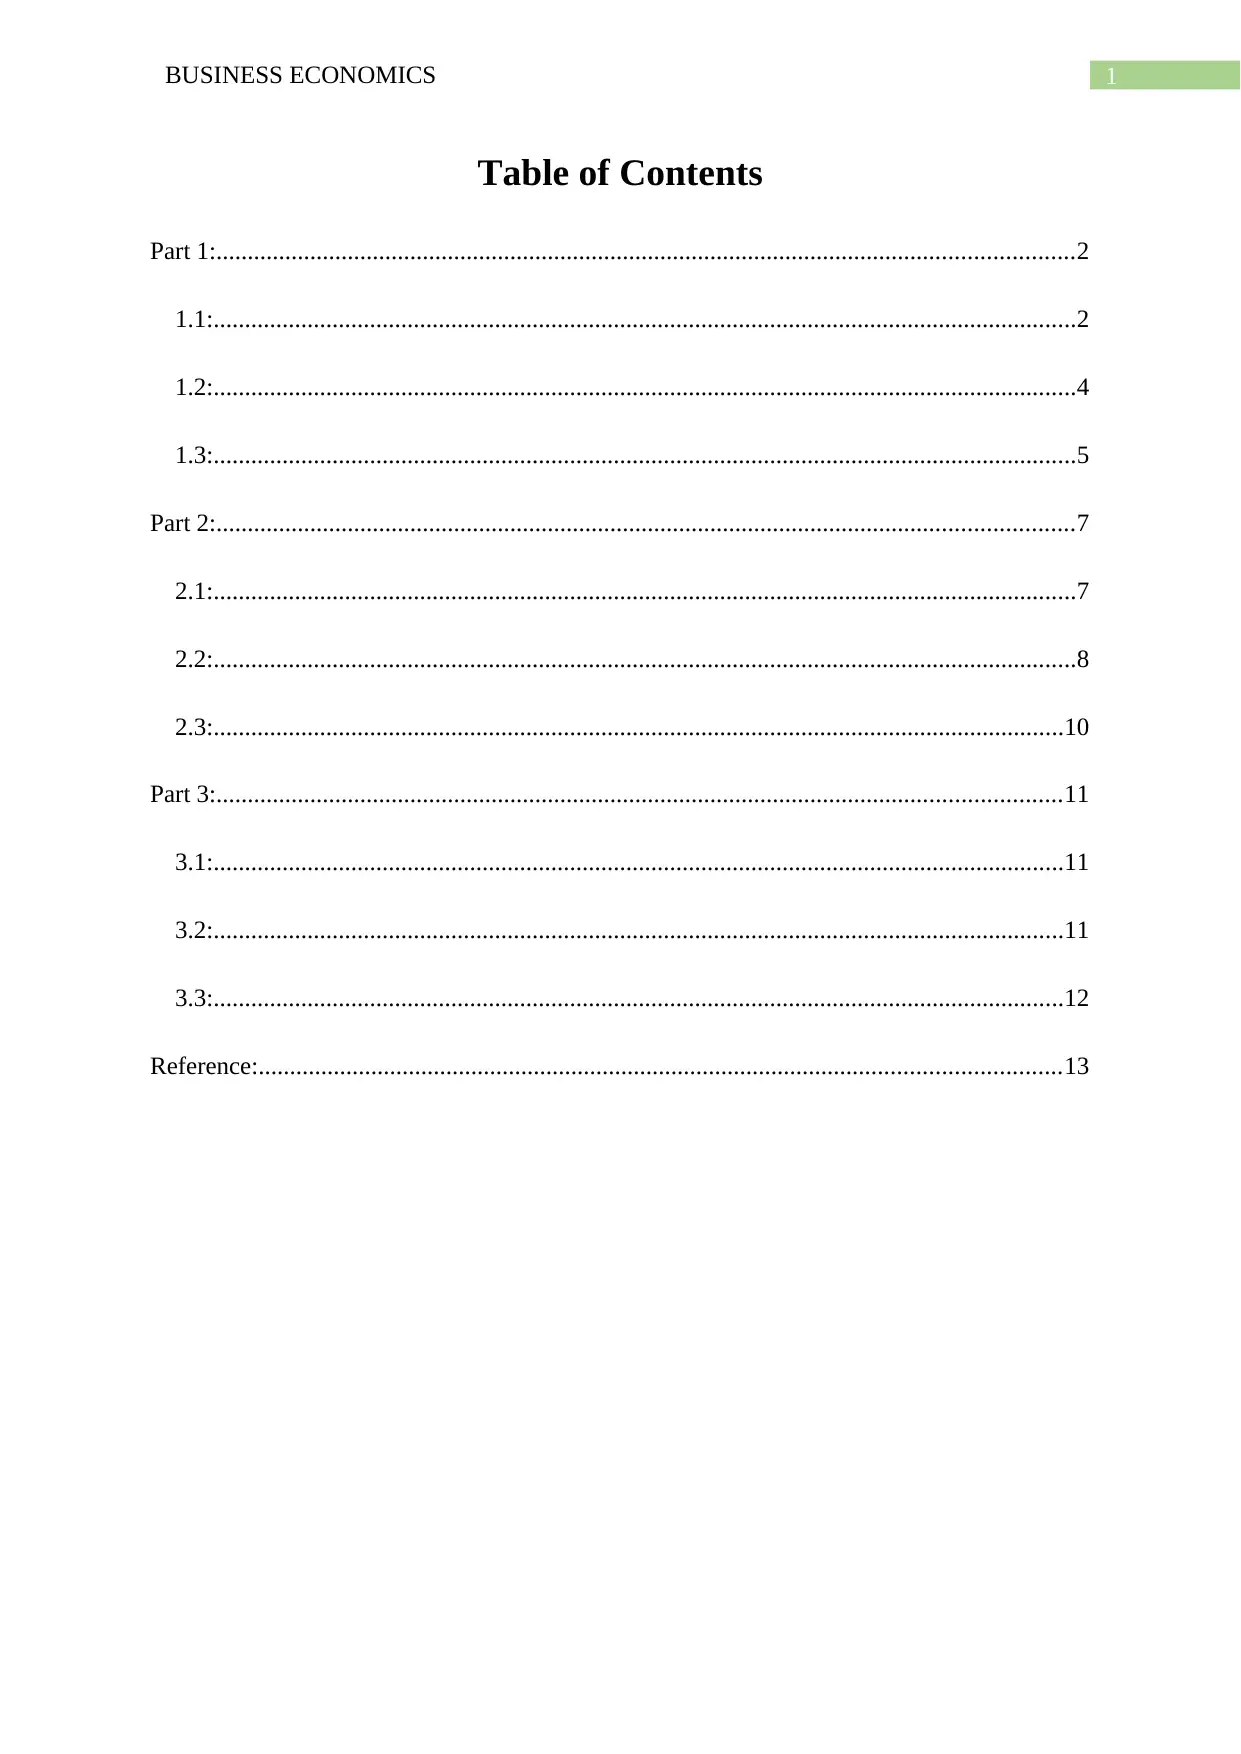
Demand for Bitcoin comes from collective want of consumers and the law of quantity
demand supports this concept. According to law of demand, price and quantity demanded for
any product follows an opposite relationship for which the demand curve also slopes
downward (Blundell et al. 2015). The term ‘quantity demanded’ means any particular amount
of good that buyers can intend and able to buy at a certain price. For Bitcoin, this economic
concept is applicable as well. Few years ago, price of a single Bitcoin was around USD 1200
and consequently fewer amounts of people intended to purchase this cryptocurrency.
However, in 2015, value of each Bitcoin has decreased and become around USD 225, which
in turn has led the demand for Bitcoin to increase further (Ciaian, Rajcaniova and Kancs
2016). Other factors that can influence this demand except its own price are number of
buyers, preferences and their income along with their expectations and advertisements. At
present, Bitcoin is not classified under either a normal good or an inferior one.
Figure 1: Demand curve
Demand
P0
P1
Price
Quantity demandedQ1 Q0
Part 1:
1.1:
Demand for Bitcoin comes from collective want of consumers and the law of quantity
demand supports this concept. According to law of demand, price and quantity demanded for
any product follows an opposite relationship for which the demand curve also slopes
downward (Blundell et al. 2015). The term ‘quantity demanded’ means any particular amount
of good that buyers can intend and able to buy at a certain price. For Bitcoin, this economic
concept is applicable as well. Few years ago, price of a single Bitcoin was around USD 1200
and consequently fewer amounts of people intended to purchase this cryptocurrency.
However, in 2015, value of each Bitcoin has decreased and become around USD 225, which
in turn has led the demand for Bitcoin to increase further (Ciaian, Rajcaniova and Kancs
2016). Other factors that can influence this demand except its own price are number of
buyers, preferences and their income along with their expectations and advertisements. At
present, Bitcoin is not classified under either a normal good or an inferior one.
Figure 1: Demand curve
⊘ This is a preview!⊘
Do you want full access?
Subscribe today to unlock all pages.
Trusted by 1+ million students worldwide
3BUSINESS ECONOMICS
Supply
ly
P0
P1
Price
O
Quantity suppliedQ0 Q1
Source: (created by author)
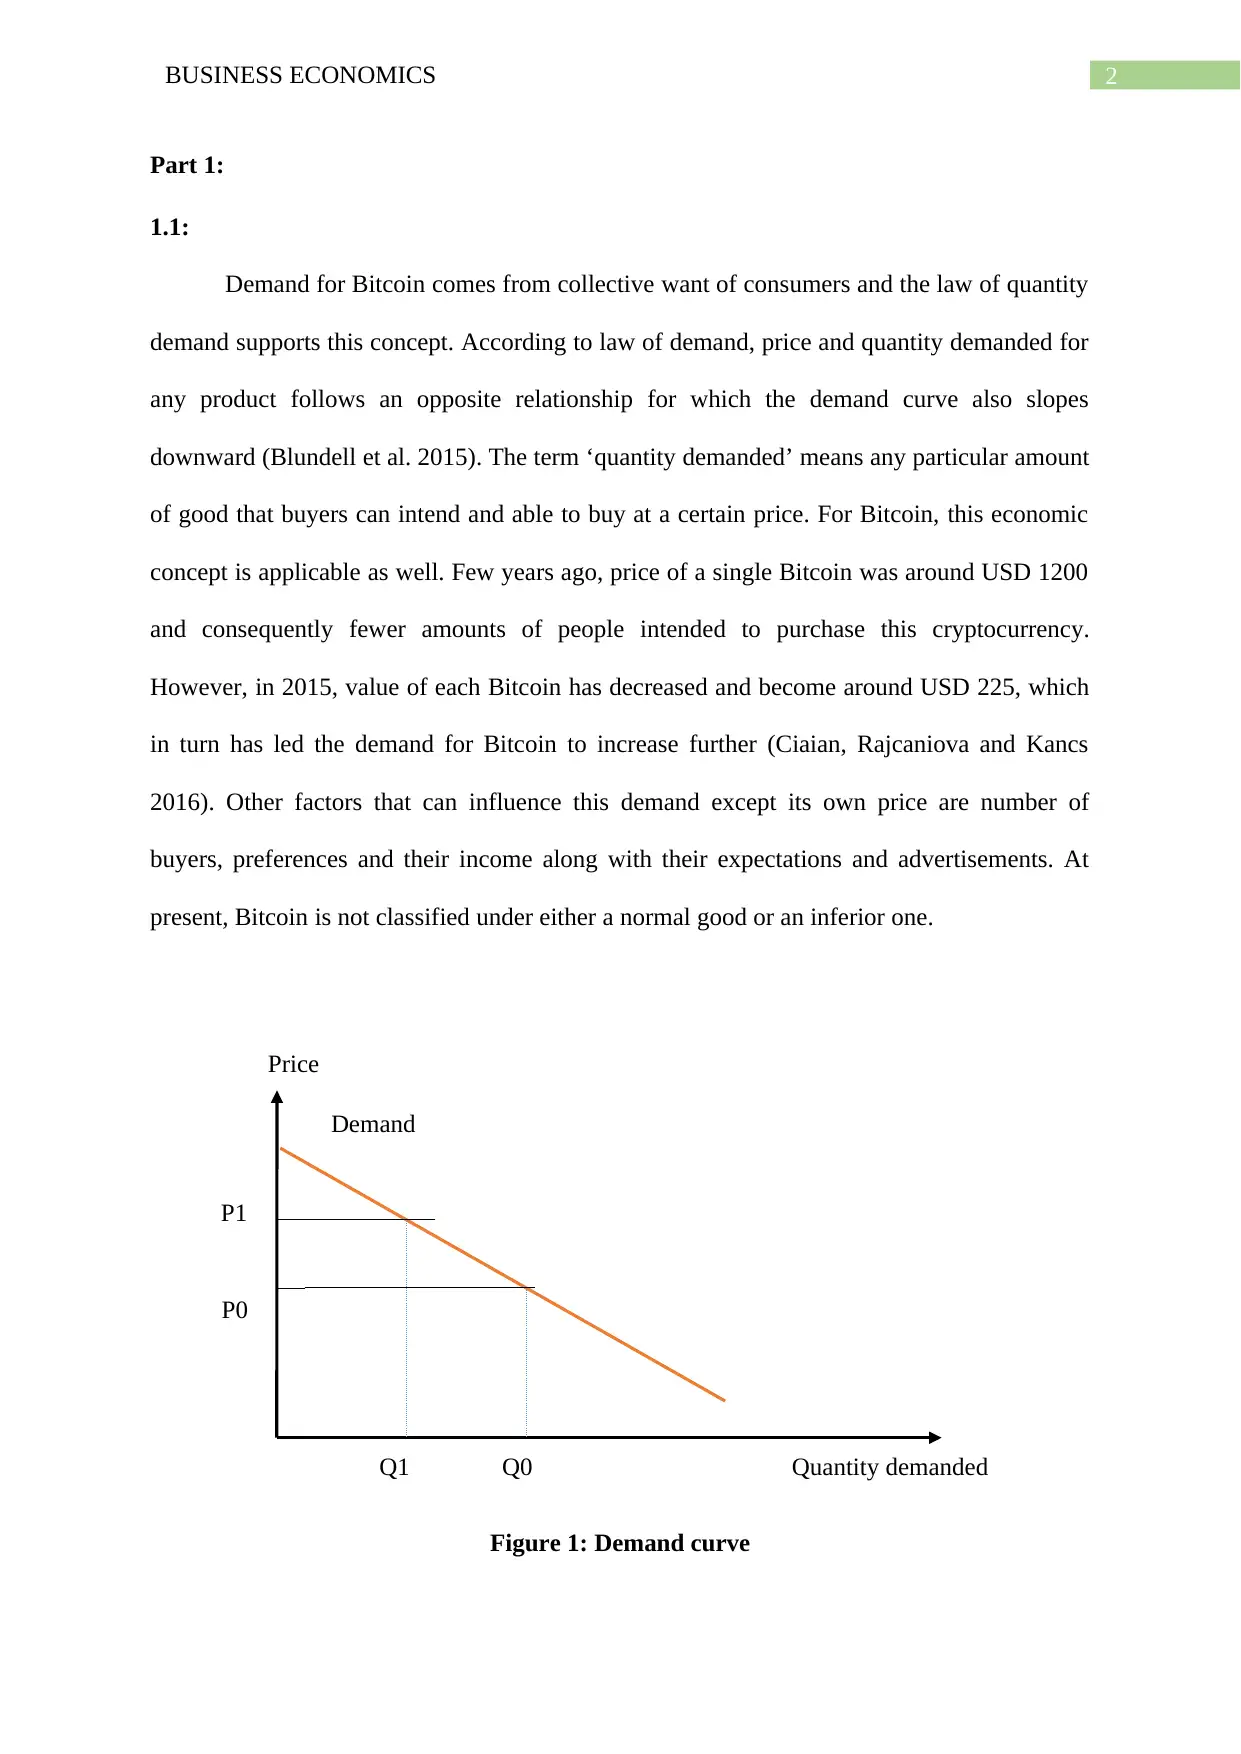
Figure 1 represents downward slopping demand curve for Bitcoin. From this figure it
can be said that when price remains at P0, demand for this currency remains at Q0 level.
When price per unit of Bitcoin increases and becomes P1, its quantity demanded becomes Q1
amount, which is comparatively lower than Q0 amount.
Supply of Bitcoin, on the other side, refers to the suppliers’ collective ability to
produce Bitcoin and this comes from the block chain, which is a series of calculations.
Several computers solve those calculations and they are called Bitcoin miners. Bitcoin
suppliers also follow the law of supply indicating that price and quantity supplied have
positive relationship with each other. Hence, the supply curve is an upward slopping curve.
However, the supplier or algorithm is going to restrict the supply of Bitcoin in 2140 after
reaching to its optimum level of 2.1 million (Ciaian and Rajcaniova 2018).
Figure 2: Supply curve
Supply
ly
P0
P1
Price
O
Quantity suppliedQ0 Q1
Source: (created by author)
Figure 1 represents downward slopping demand curve for Bitcoin. From this figure it
can be said that when price remains at P0, demand for this currency remains at Q0 level.
When price per unit of Bitcoin increases and becomes P1, its quantity demanded becomes Q1
amount, which is comparatively lower than Q0 amount.
Supply of Bitcoin, on the other side, refers to the suppliers’ collective ability to
produce Bitcoin and this comes from the block chain, which is a series of calculations.
Several computers solve those calculations and they are called Bitcoin miners. Bitcoin
suppliers also follow the law of supply indicating that price and quantity supplied have
positive relationship with each other. Hence, the supply curve is an upward slopping curve.
However, the supplier or algorithm is going to restrict the supply of Bitcoin in 2140 after
reaching to its optimum level of 2.1 million (Ciaian and Rajcaniova 2018).
Figure 2: Supply curve
Paraphrase This Document
Need a fresh take? Get an instant paraphrase of this document with our AI Paraphraser
4BUSINESS ECONOMICS
E
Supply
ly
Demand
Pe
Price
O
Qe Quantity
Source: (created by author)
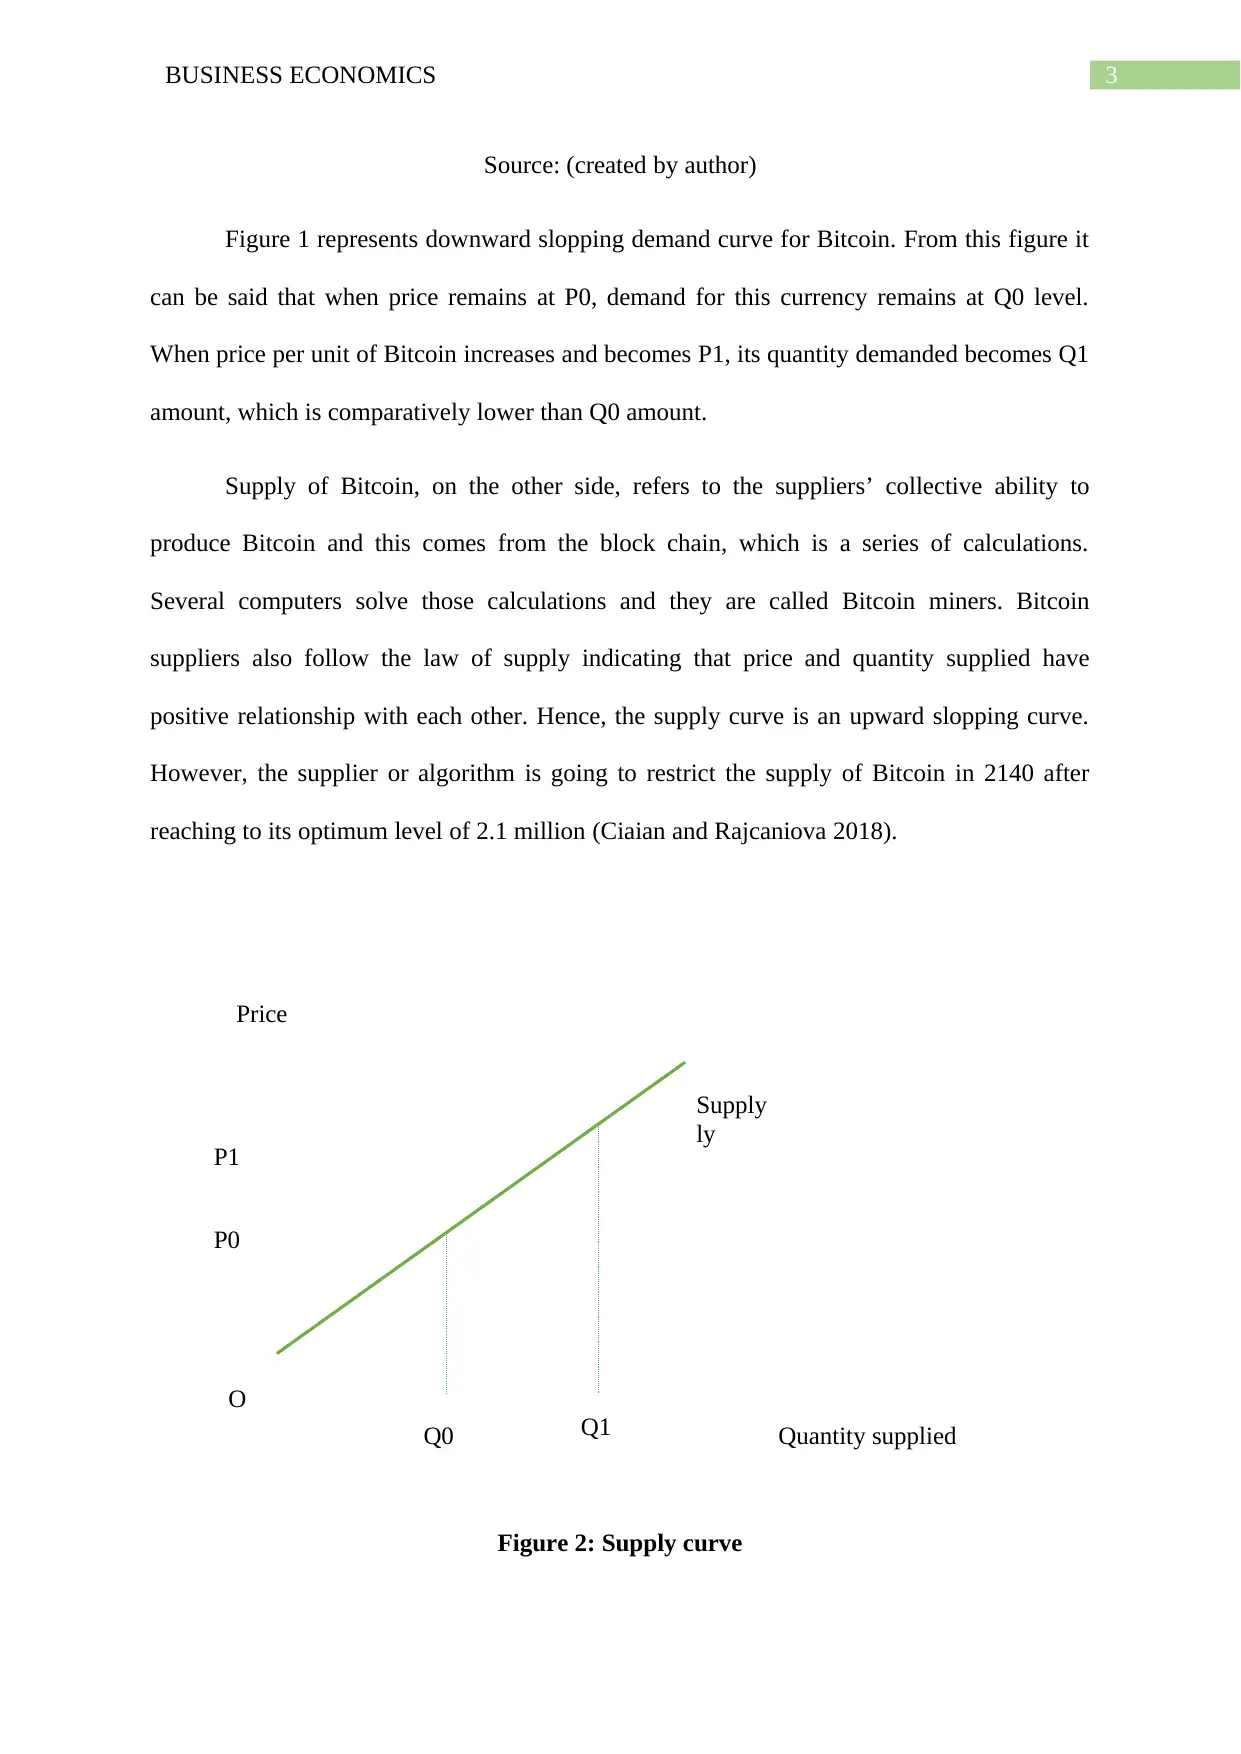
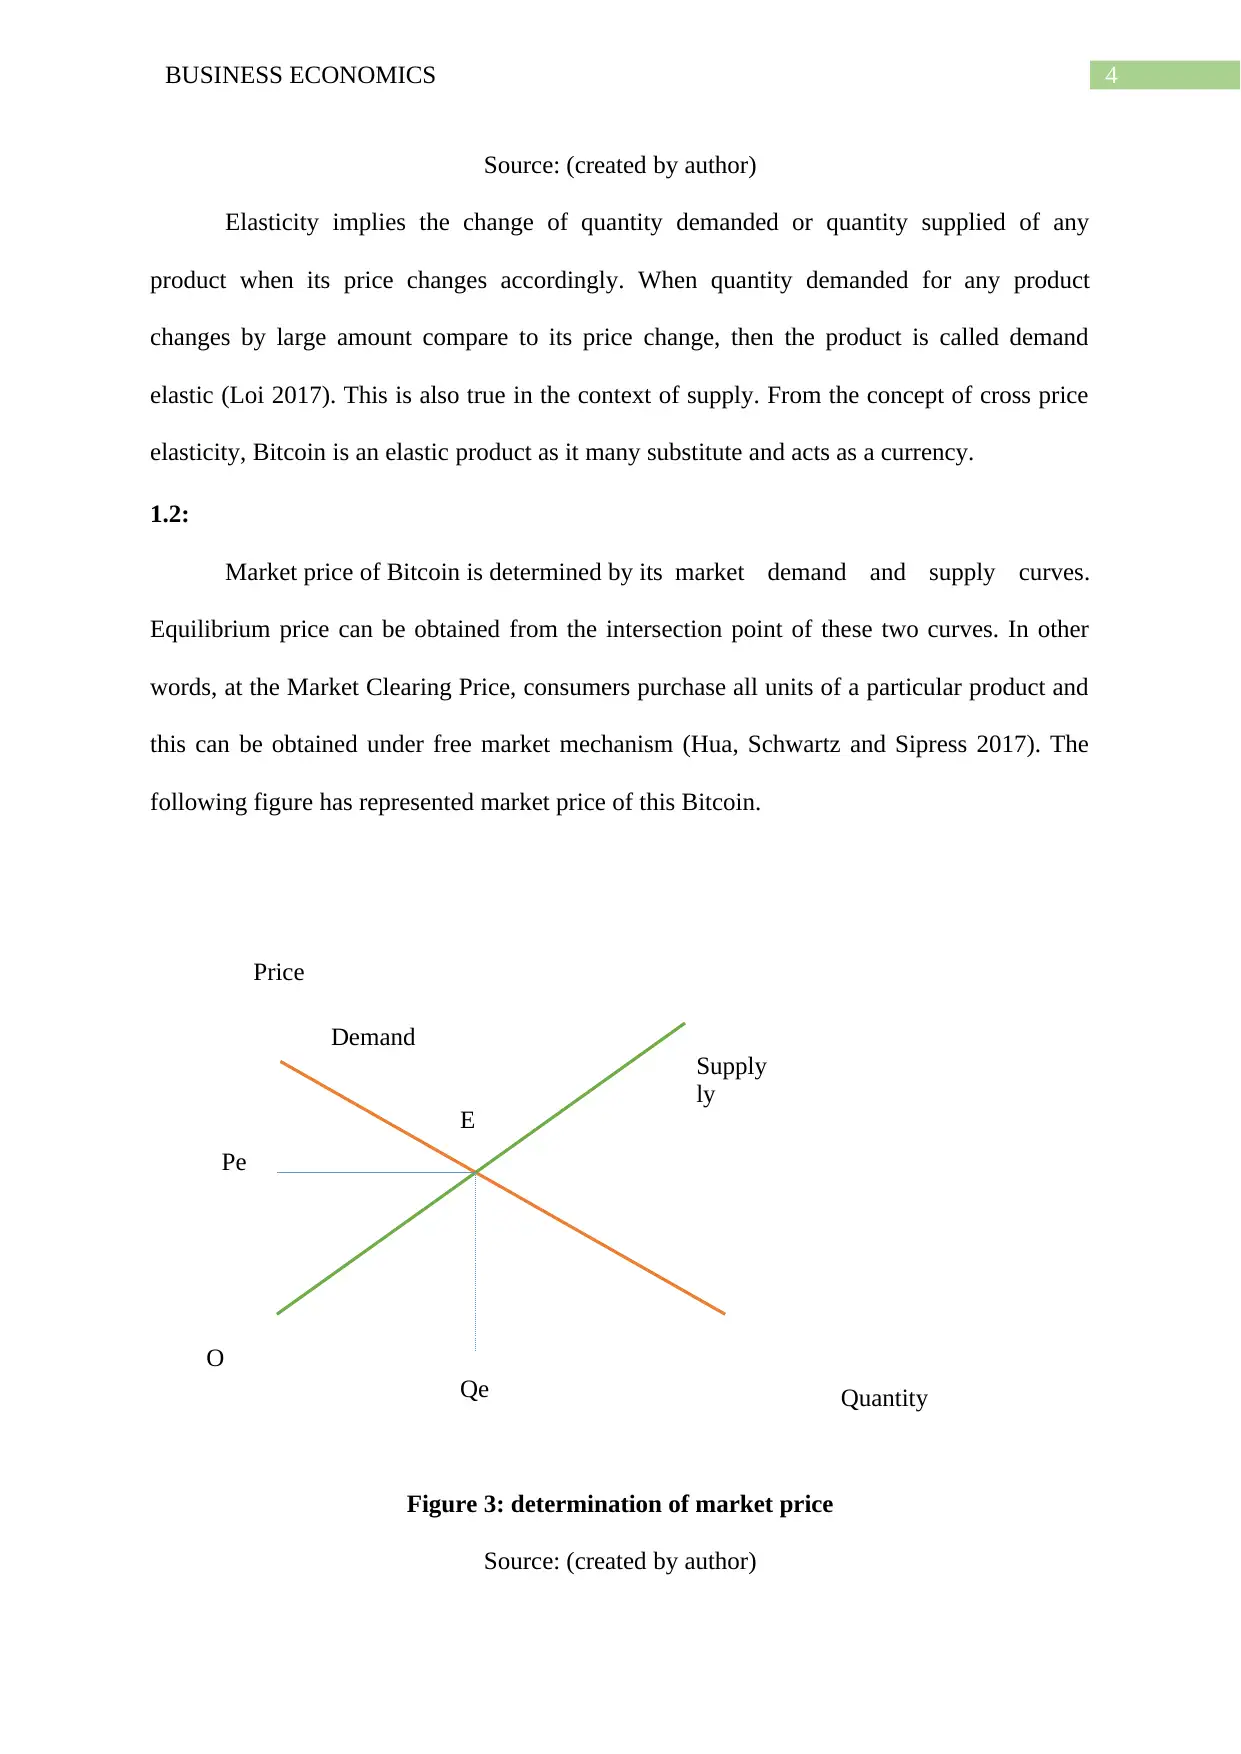
Elasticity implies the change of quantity demanded or quantity supplied of any
product when its price changes accordingly. When quantity demanded for any product
changes by large amount compare to its price change, then the product is called demand
elastic (Loi 2017). This is also true in the context of supply. From the concept of cross price
elasticity, Bitcoin is an elastic product as it many substitute and acts as a currency.
1.2:
Market price of Bitcoin is determined by its market demand and supply curves.
Equilibrium price can be obtained from the intersection point of these two curves. In other
words, at the Market Clearing Price, consumers purchase all units of a particular product and
this can be obtained under free market mechanism (Hua, Schwartz and Sipress 2017). The
following figure has represented market price of this Bitcoin.
Figure 3: determination of market price
Source: (created by author)
E
Supply
ly
Demand
Pe
Price
O
Qe Quantity
Source: (created by author)
Elasticity implies the change of quantity demanded or quantity supplied of any
product when its price changes accordingly. When quantity demanded for any product
changes by large amount compare to its price change, then the product is called demand
elastic (Loi 2017). This is also true in the context of supply. From the concept of cross price
elasticity, Bitcoin is an elastic product as it many substitute and acts as a currency.
1.2:
Market price of Bitcoin is determined by its market demand and supply curves.
Equilibrium price can be obtained from the intersection point of these two curves. In other
words, at the Market Clearing Price, consumers purchase all units of a particular product and
this can be obtained under free market mechanism (Hua, Schwartz and Sipress 2017). The
following figure has represented market price of this Bitcoin.
Figure 3: determination of market price
Source: (created by author)
5BUSINESS ECONOMICS
Supply
ly
P0
P1
Q0 Q1
O
Price
Quantity
D0
D1
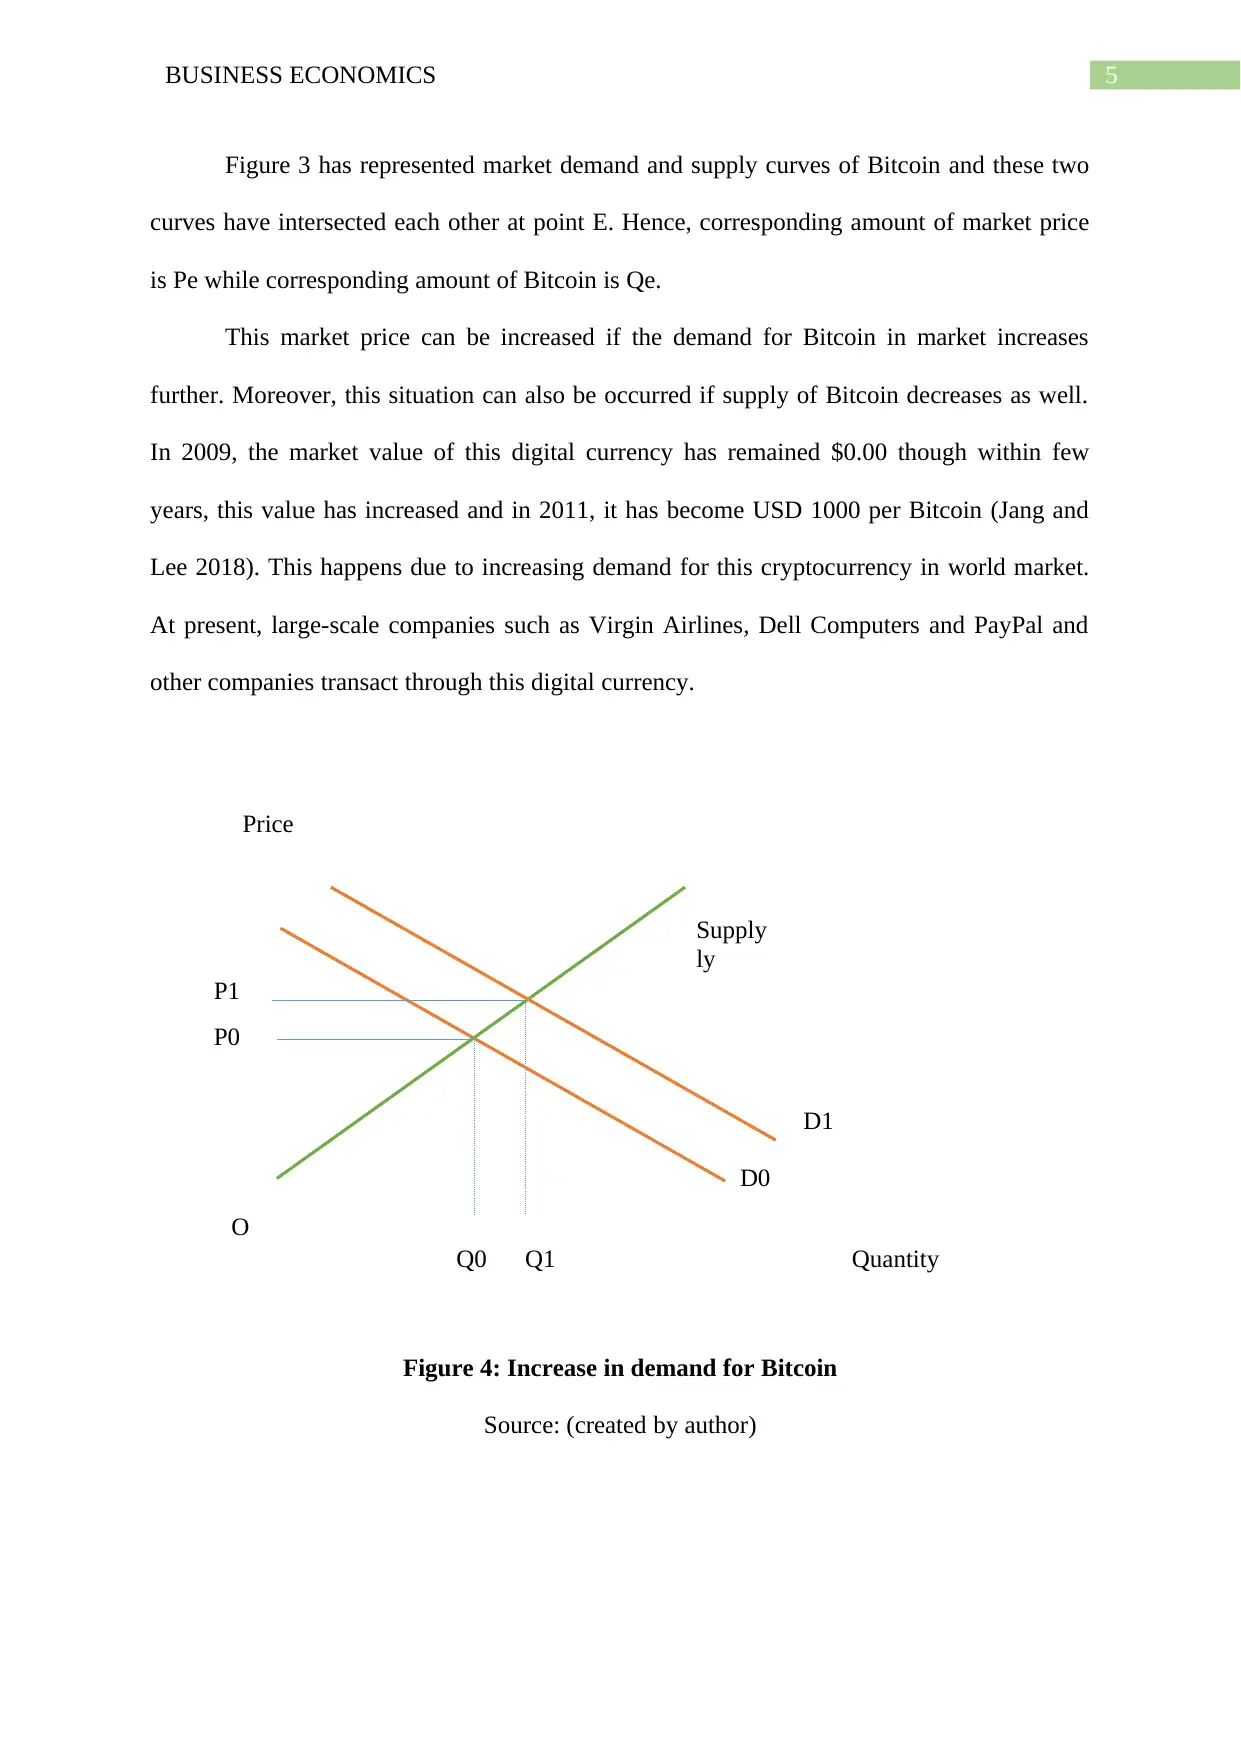
Figure 3 has represented market demand and supply curves of Bitcoin and these two
curves have intersected each other at point E. Hence, corresponding amount of market price
is Pe while corresponding amount of Bitcoin is Qe.
This market price can be increased if the demand for Bitcoin in market increases
further. Moreover, this situation can also be occurred if supply of Bitcoin decreases as well.
In 2009, the market value of this digital currency has remained $0.00 though within few
years, this value has increased and in 2011, it has become USD 1000 per Bitcoin (Jang and
Lee 2018). This happens due to increasing demand for this cryptocurrency in world market.
At present, large-scale companies such as Virgin Airlines, Dell Computers and PayPal and
other companies transact through this digital currency.
Figure 4: Increase in demand for Bitcoin
Source: (created by author)
Supply
ly
P0
P1
Q0 Q1
O
Price
Quantity
D0
D1
Figure 3 has represented market demand and supply curves of Bitcoin and these two
curves have intersected each other at point E. Hence, corresponding amount of market price
is Pe while corresponding amount of Bitcoin is Qe.
This market price can be increased if the demand for Bitcoin in market increases
further. Moreover, this situation can also be occurred if supply of Bitcoin decreases as well.
In 2009, the market value of this digital currency has remained $0.00 though within few
years, this value has increased and in 2011, it has become USD 1000 per Bitcoin (Jang and
Lee 2018). This happens due to increasing demand for this cryptocurrency in world market.
At present, large-scale companies such as Virgin Airlines, Dell Computers and PayPal and
other companies transact through this digital currency.
Figure 4: Increase in demand for Bitcoin
Source: (created by author)
⊘ This is a preview!⊘
Do you want full access?
Subscribe today to unlock all pages.
Trusted by 1+ million students worldwide
6BUSINESS ECONOMICS
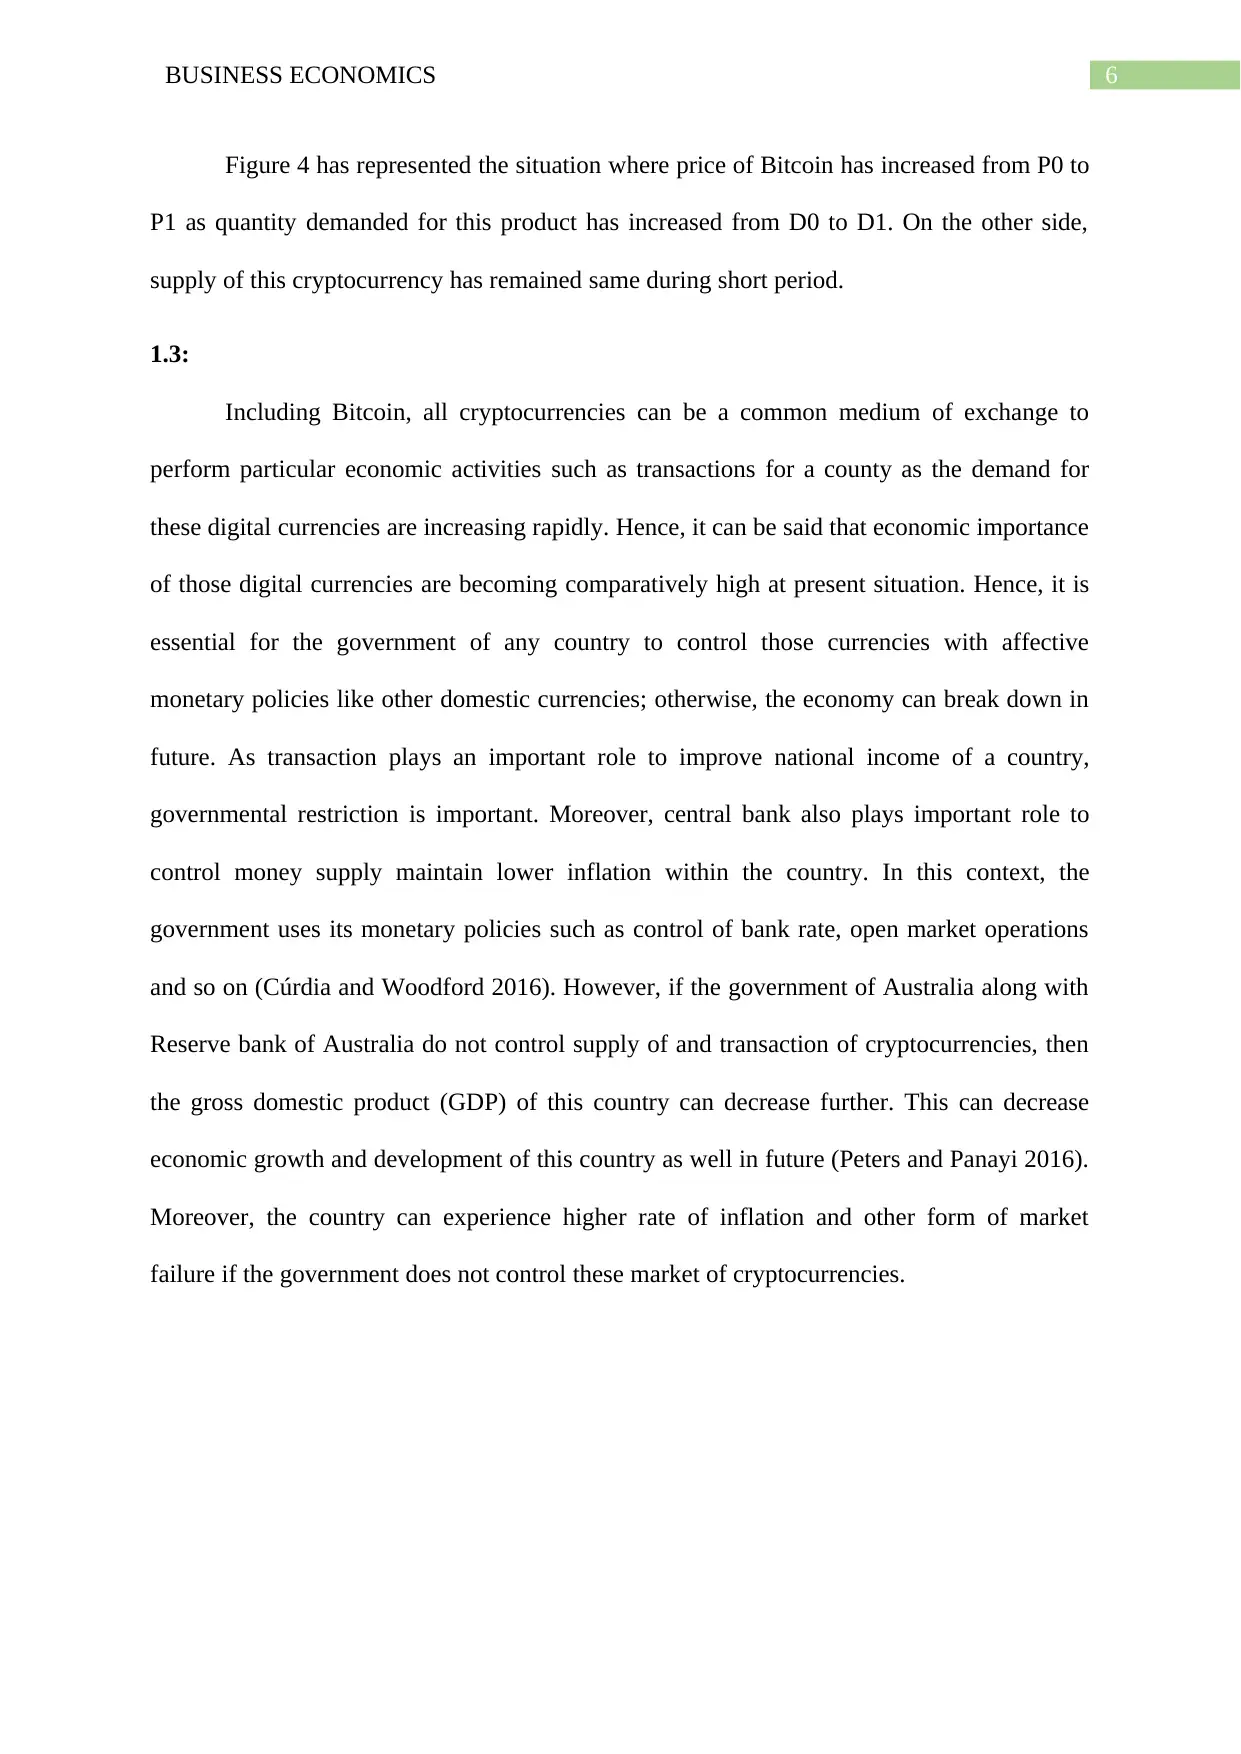
Figure 4 has represented the situation where price of Bitcoin has increased from P0 to
P1 as quantity demanded for this product has increased from D0 to D1. On the other side,
supply of this cryptocurrency has remained same during short period.
1.3:
Including Bitcoin, all cryptocurrencies can be a common medium of exchange to
perform particular economic activities such as transactions for a county as the demand for
these digital currencies are increasing rapidly. Hence, it can be said that economic importance
of those digital currencies are becoming comparatively high at present situation. Hence, it is
essential for the government of any country to control those currencies with affective
monetary policies like other domestic currencies; otherwise, the economy can break down in
future. As transaction plays an important role to improve national income of a country,
governmental restriction is important. Moreover, central bank also plays important role to
control money supply maintain lower inflation within the country. In this context, the
government uses its monetary policies such as control of bank rate, open market operations
and so on (Cúrdia and Woodford 2016). However, if the government of Australia along with
Reserve bank of Australia do not control supply of and transaction of cryptocurrencies, then
the gross domestic product (GDP) of this country can decrease further. This can decrease
economic growth and development of this country as well in future (Peters and Panayi 2016).
Moreover, the country can experience higher rate of inflation and other form of market
failure if the government does not control these market of cryptocurrencies.
Paraphrase This Document
Need a fresh take? Get an instant paraphrase of this document with our AI Paraphraser
7BUSINESS ECONOMICS
E’’
A
B C DA’
E
Supply
ly
Demand
P0
P1
Qs Qs’ Qd’ Qd
Q
P
Part 2:
2.1:
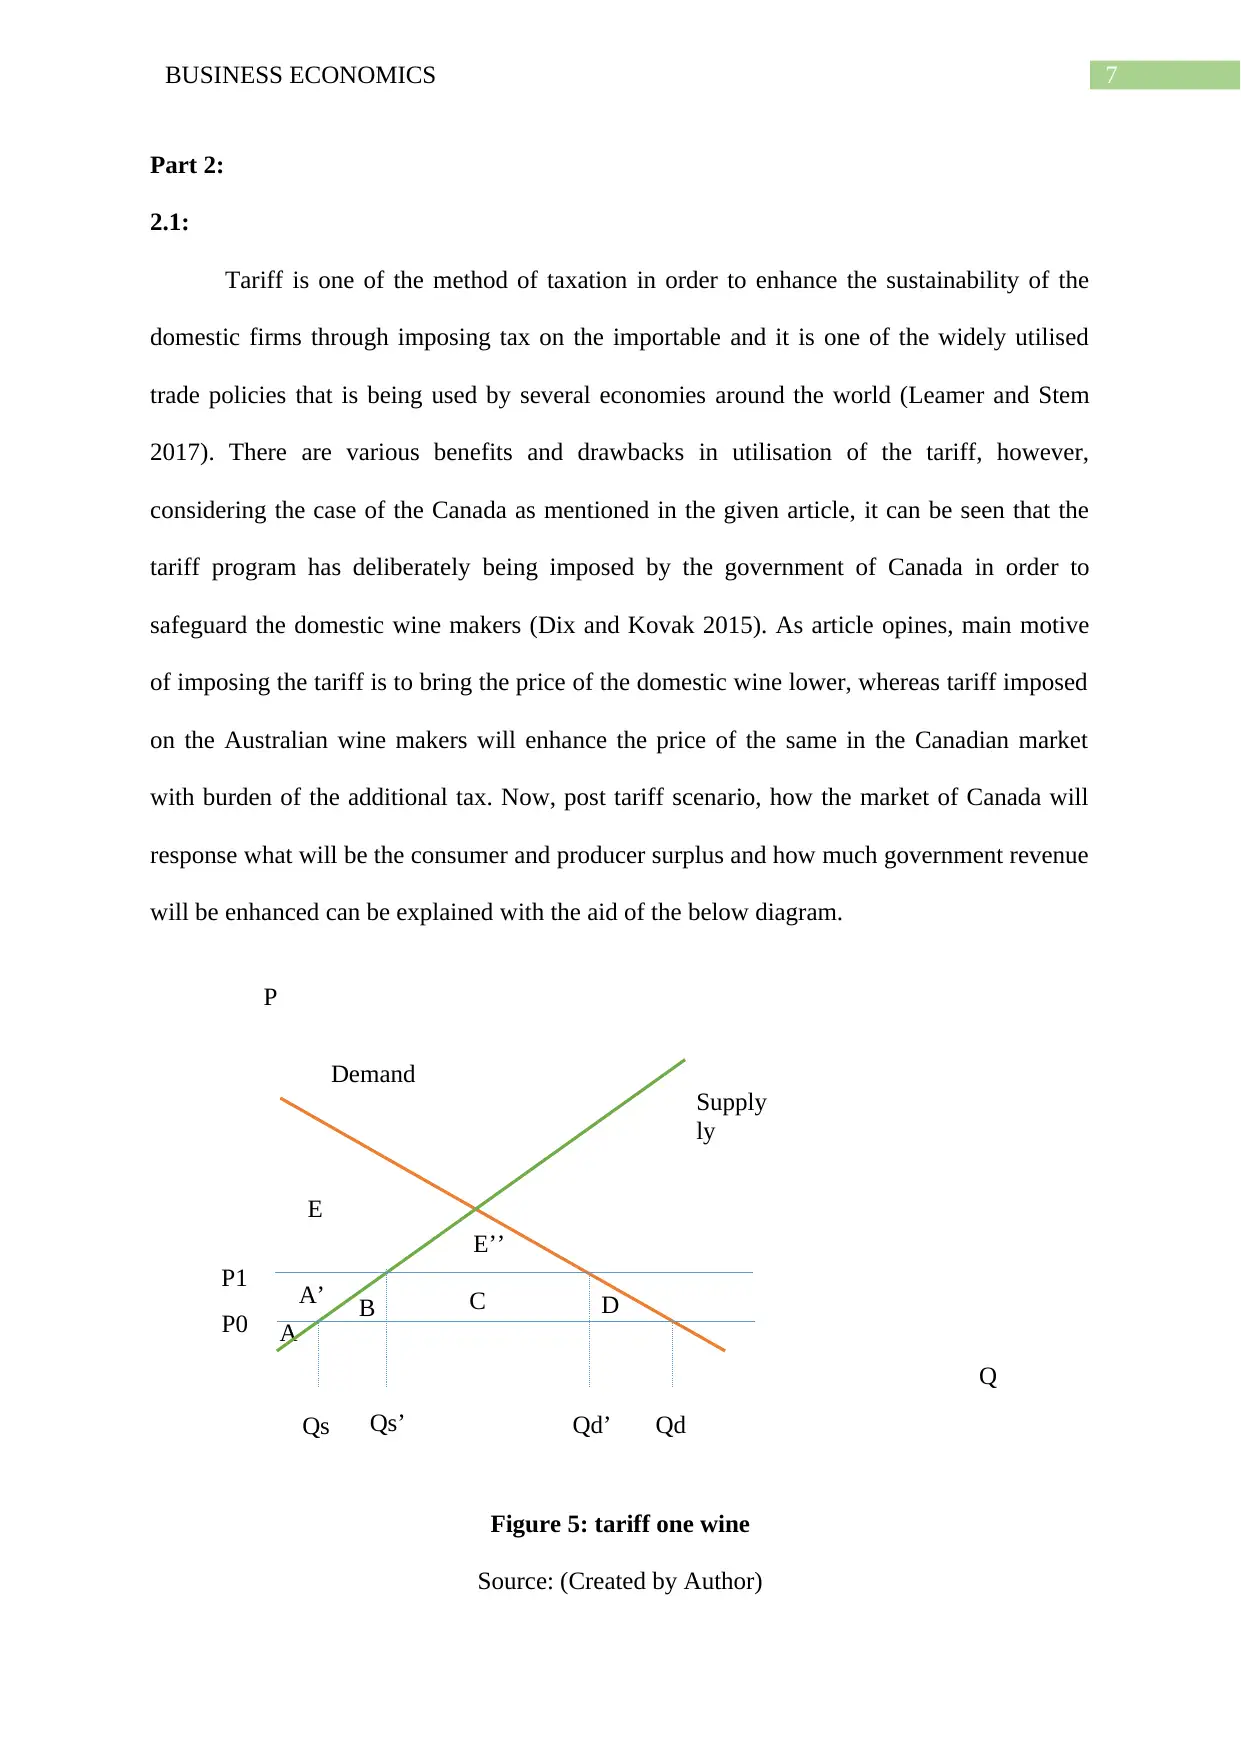
Tariff is one of the method of taxation in order to enhance the sustainability of the
domestic firms through imposing tax on the importable and it is one of the widely utilised
trade policies that is being used by several economies around the world (Leamer and Stem
2017). There are various benefits and drawbacks in utilisation of the tariff, however,
considering the case of the Canada as mentioned in the given article, it can be seen that the
tariff program has deliberately being imposed by the government of Canada in order to
safeguard the domestic wine makers (Dix and Kovak 2015). As article opines, main motive
of imposing the tariff is to bring the price of the domestic wine lower, whereas tariff imposed
on the Australian wine makers will enhance the price of the same in the Canadian market
with burden of the additional tax. Now, post tariff scenario, how the market of Canada will
response what will be the consumer and producer surplus and how much government revenue
will be enhanced can be explained with the aid of the below diagram.
Figure 5: tariff one wine
Source: (Created by Author)
E’’
A
B C DA’
E
Supply
ly
Demand
P0
P1
Qs Qs’ Qd’ Qd
Q
P
Part 2:
2.1:
Tariff is one of the method of taxation in order to enhance the sustainability of the
domestic firms through imposing tax on the importable and it is one of the widely utilised
trade policies that is being used by several economies around the world (Leamer and Stem
2017). There are various benefits and drawbacks in utilisation of the tariff, however,
considering the case of the Canada as mentioned in the given article, it can be seen that the
tariff program has deliberately being imposed by the government of Canada in order to
safeguard the domestic wine makers (Dix and Kovak 2015). As article opines, main motive
of imposing the tariff is to bring the price of the domestic wine lower, whereas tariff imposed
on the Australian wine makers will enhance the price of the same in the Canadian market
with burden of the additional tax. Now, post tariff scenario, how the market of Canada will
response what will be the consumer and producer surplus and how much government revenue
will be enhanced can be explained with the aid of the below diagram.
Figure 5: tariff one wine
Source: (Created by Author)
8BUSINESS ECONOMICS
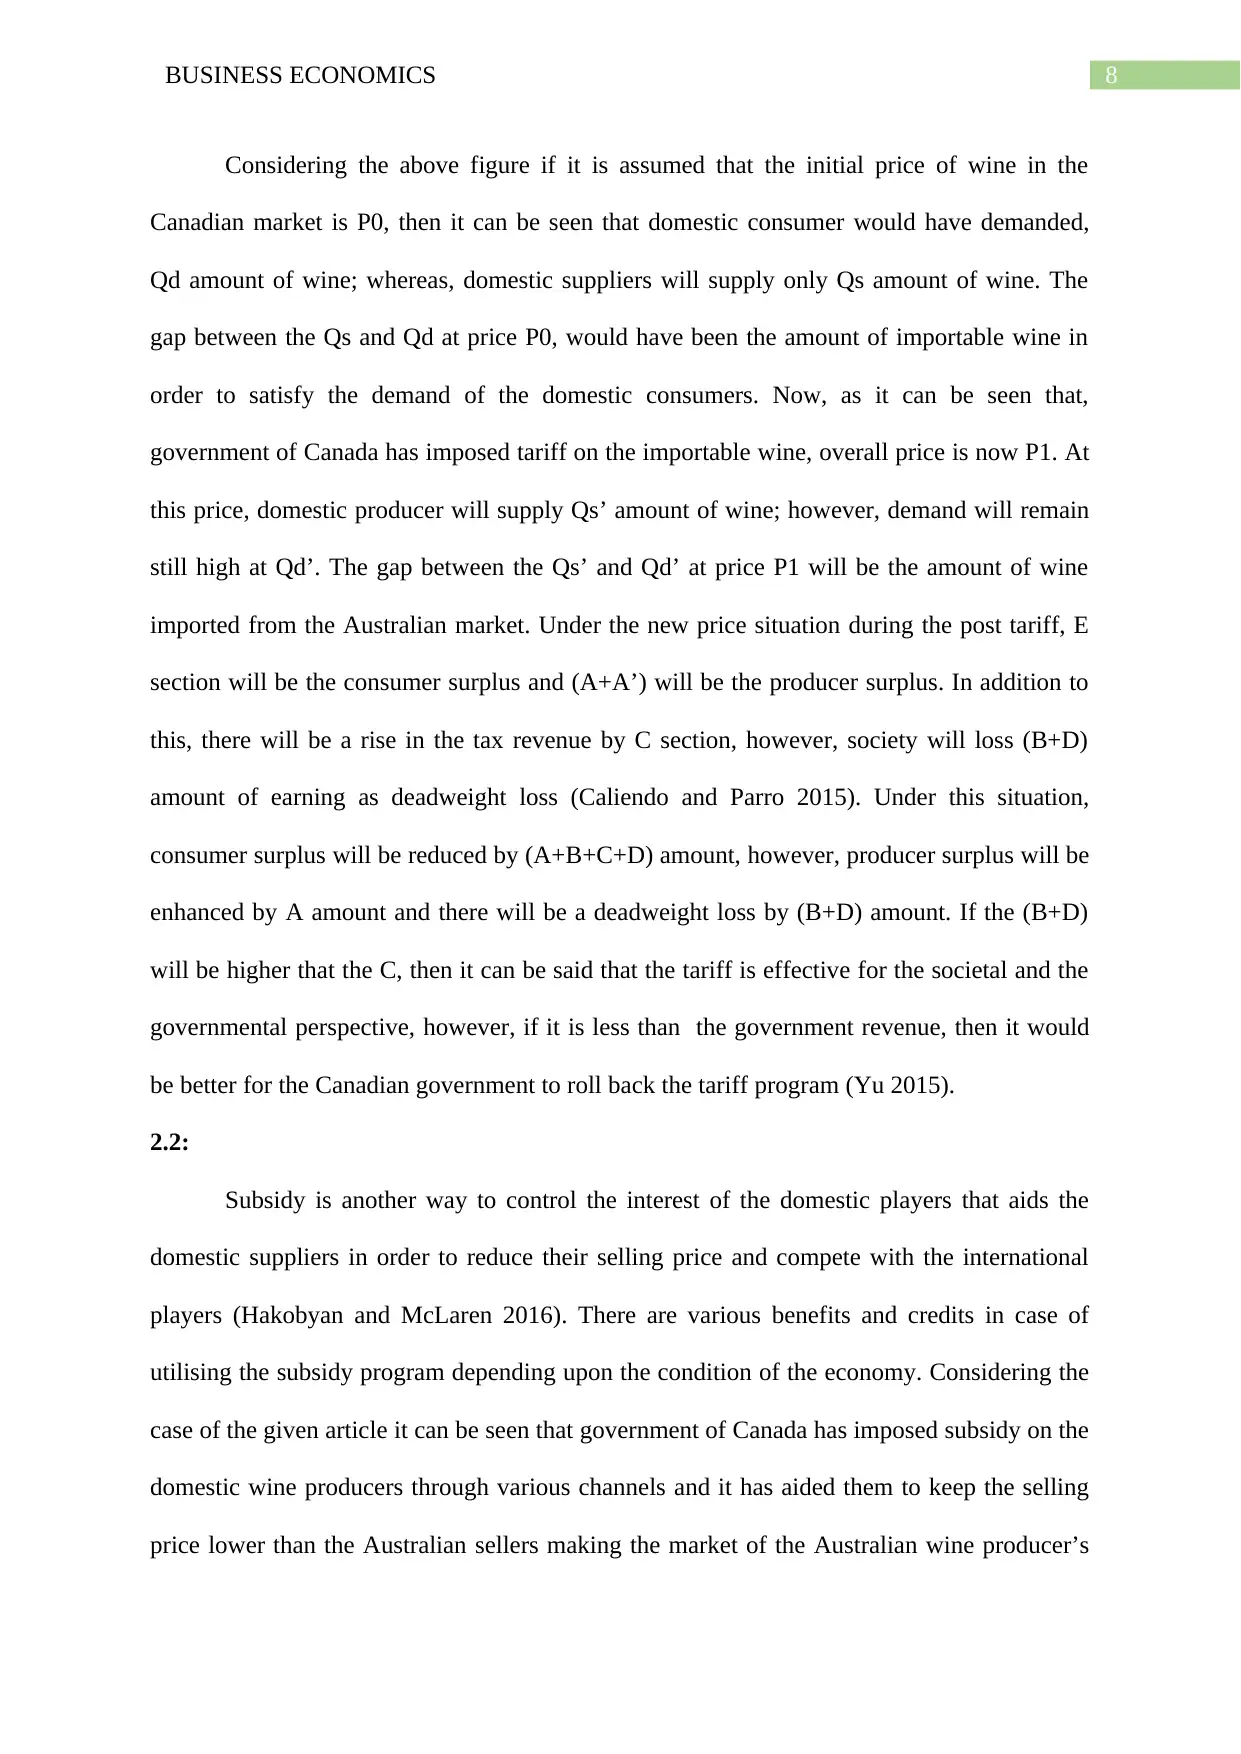
Considering the above figure if it is assumed that the initial price of wine in the
Canadian market is P0, then it can be seen that domestic consumer would have demanded,
Qd amount of wine; whereas, domestic suppliers will supply only Qs amount of wine. The
gap between the Qs and Qd at price P0, would have been the amount of importable wine in
order to satisfy the demand of the domestic consumers. Now, as it can be seen that,
government of Canada has imposed tariff on the importable wine, overall price is now P1. At
this price, domestic producer will supply Qs’ amount of wine; however, demand will remain
still high at Qd’. The gap between the Qs’ and Qd’ at price P1 will be the amount of wine
imported from the Australian market. Under the new price situation during the post tariff, E
section will be the consumer surplus and (A+A’) will be the producer surplus. In addition to
this, there will be a rise in the tax revenue by C section, however, society will loss (B+D)
amount of earning as deadweight loss (Caliendo and Parro 2015). Under this situation,
consumer surplus will be reduced by (A+B+C+D) amount, however, producer surplus will be
enhanced by A amount and there will be a deadweight loss by (B+D) amount. If the (B+D)
will be higher that the C, then it can be said that the tariff is effective for the societal and the
governmental perspective, however, if it is less than the government revenue, then it would
be better for the Canadian government to roll back the tariff program (Yu 2015).
2.2:
Subsidy is another way to control the interest of the domestic players that aids the
domestic suppliers in order to reduce their selling price and compete with the international
players (Hakobyan and McLaren 2016). There are various benefits and credits in case of
utilising the subsidy program depending upon the condition of the economy. Considering the
case of the given article it can be seen that government of Canada has imposed subsidy on the
domestic wine producers through various channels and it has aided them to keep the selling
price lower than the Australian sellers making the market of the Australian wine producer’s
⊘ This is a preview!⊘
Do you want full access?
Subscribe today to unlock all pages.
Trusted by 1+ million students worldwide
9BUSINESS ECONOMICS
D’
DE’
AA’
E
S’
P0
P1
Q0 Q1
Q
P
S
P2
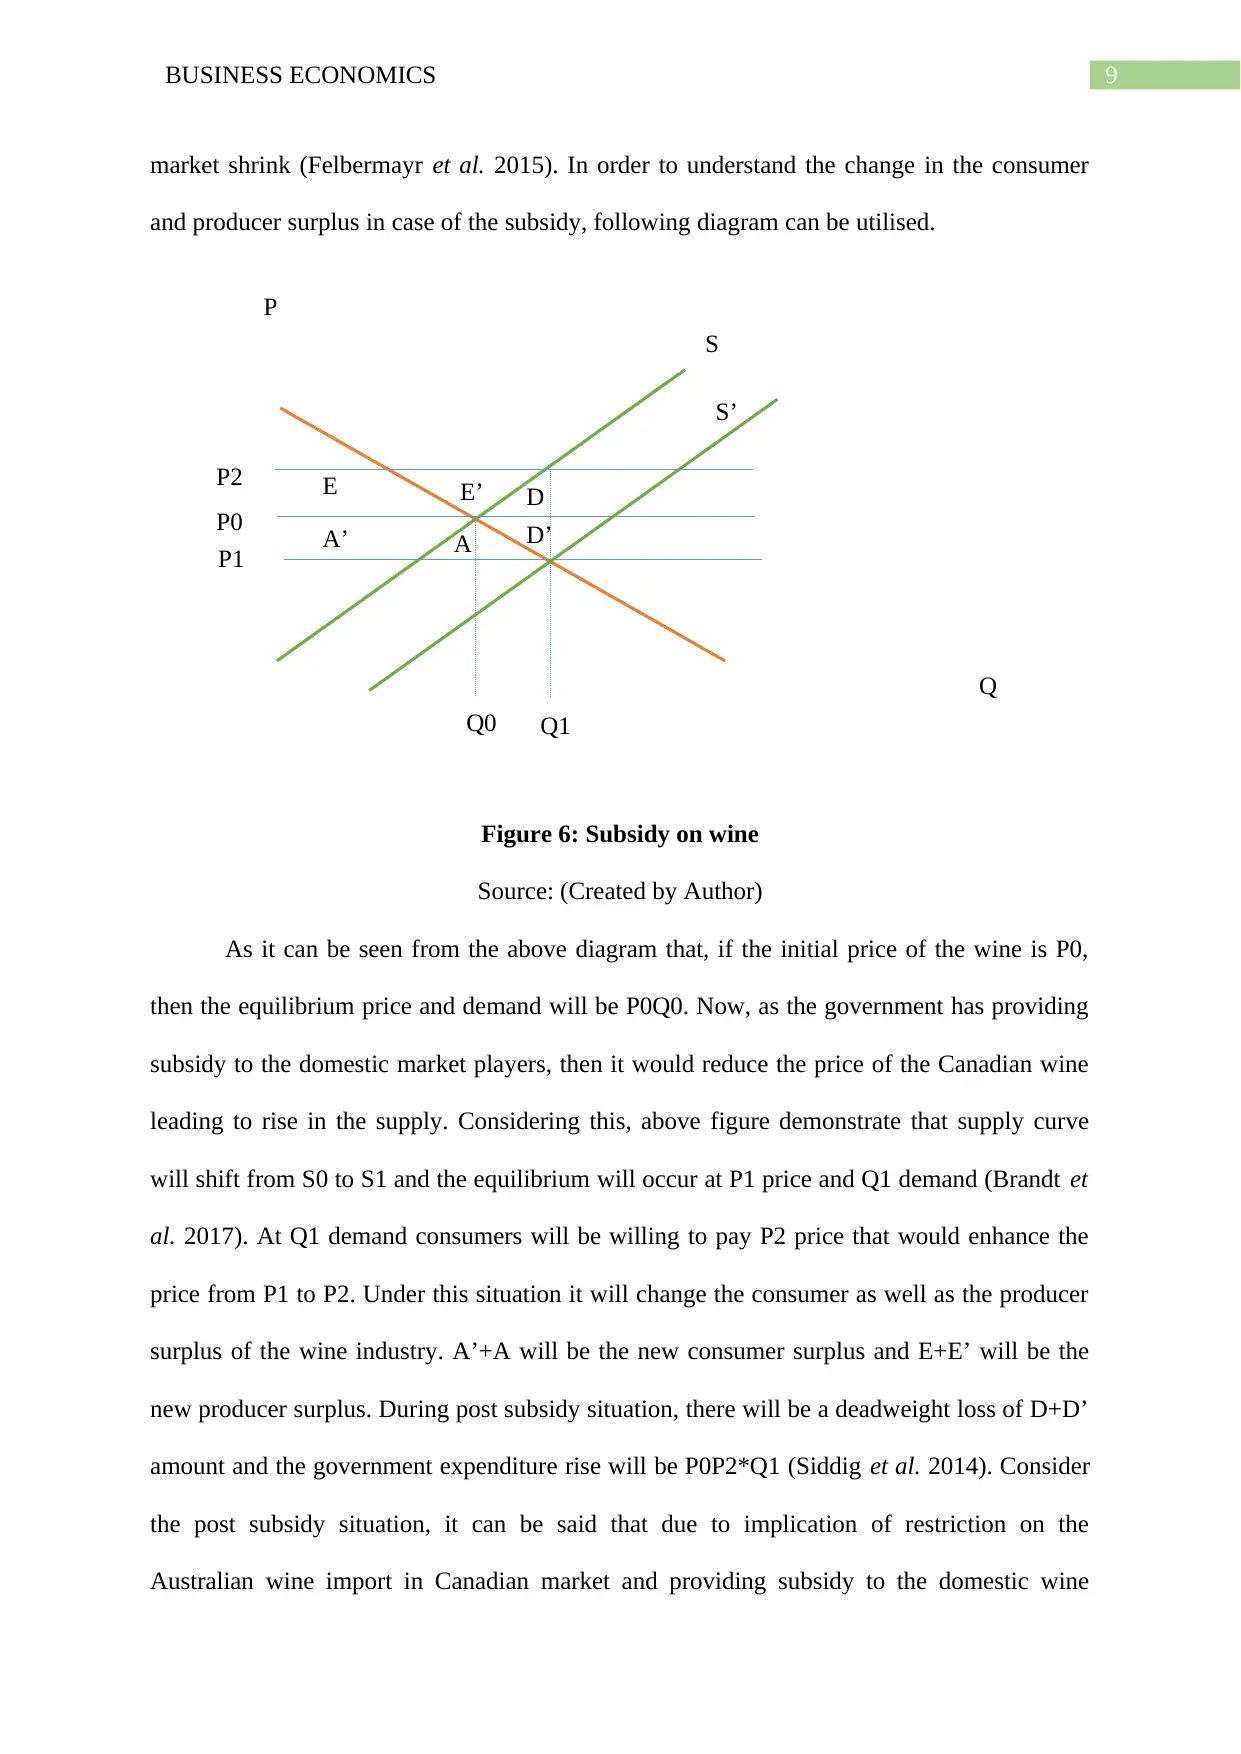
market shrink (Felbermayr et al. 2015). In order to understand the change in the consumer
and producer surplus in case of the subsidy, following diagram can be utilised.
Figure 6: Subsidy on wine
Source: (Created by Author)
As it can be seen from the above diagram that, if the initial price of the wine is P0,
then the equilibrium price and demand will be P0Q0. Now, as the government has providing
subsidy to the domestic market players, then it would reduce the price of the Canadian wine
leading to rise in the supply. Considering this, above figure demonstrate that supply curve
will shift from S0 to S1 and the equilibrium will occur at P1 price and Q1 demand (Brandt et
al. 2017). At Q1 demand consumers will be willing to pay P2 price that would enhance the
price from P1 to P2. Under this situation it will change the consumer as well as the producer
surplus of the wine industry. A’+A will be the new consumer surplus and E+E’ will be the
new producer surplus. During post subsidy situation, there will be a deadweight loss of D+D’
amount and the government expenditure rise will be P0P2*Q1 (Siddig et al. 2014). Consider
the post subsidy situation, it can be said that due to implication of restriction on the
Australian wine import in Canadian market and providing subsidy to the domestic wine
D’
DE’
AA’
E
S’
P0
P1
Q0 Q1
Q
P
S
P2
market shrink (Felbermayr et al. 2015). In order to understand the change in the consumer
and producer surplus in case of the subsidy, following diagram can be utilised.
Figure 6: Subsidy on wine
Source: (Created by Author)
As it can be seen from the above diagram that, if the initial price of the wine is P0,
then the equilibrium price and demand will be P0Q0. Now, as the government has providing
subsidy to the domestic market players, then it would reduce the price of the Canadian wine
leading to rise in the supply. Considering this, above figure demonstrate that supply curve
will shift from S0 to S1 and the equilibrium will occur at P1 price and Q1 demand (Brandt et
al. 2017). At Q1 demand consumers will be willing to pay P2 price that would enhance the
price from P1 to P2. Under this situation it will change the consumer as well as the producer
surplus of the wine industry. A’+A will be the new consumer surplus and E+E’ will be the
new producer surplus. During post subsidy situation, there will be a deadweight loss of D+D’
amount and the government expenditure rise will be P0P2*Q1 (Siddig et al. 2014). Consider
the post subsidy situation, it can be said that due to implication of restriction on the
Australian wine import in Canadian market and providing subsidy to the domestic wine
Paraphrase This Document
Need a fresh take? Get an instant paraphrase of this document with our AI Paraphraser
10BUSINESS ECONOMICS
producers in order to keep their selling price lower would hamper the interest of the Canadian
government instead of helping them. It would bring down both the consumer as well as
producer surplus in different scenario and more importantly, there will be deadweight loss,
which will reduce the societal benefit.
2.3:
In order to deal with the tariff imposition and subsidy to the domestic player of Canada,
Australian government can utilise the following trade pacts:
Canada-Australia Trade and Economic Cooperation Arrangement (TECA):
This is one of the goods and service related trade pact between the Canada and
Australia, signed during 1995. One of the main objective of the same was to expand the
special trade bond and cooperation between these two trade participating nations. In addition
to this, it was aimed to provide both the parties free access to the respective nations so that
the trading can boost between them and the relationship fosters (Solaymanu et al. 2015).
TECA firmly supports the growth of the liberalization and promotion of trade of goods and
services between these two nations. Utilising the same, government of Australia can object
the tariff imposition act of the Canadian government in the case of the wine market.
Trans Pacific Partnership (TPP):
Though the US government has withdrawn its signature from the TPP, yet it is an ambitious
pact among the Trans Pacific nations in order to enhance their economic performance
through international trade. It was supposed to be came in force during 2016, however, two
nations have ratified the same and moreover, US has withdrawn its signature that has made it
paralysed. Under this situation a modified version of the TPP model has come in that holds
most of the principal of the TPP and in order to bring in the same in force in real world,
Australia can utilise the same in the case of the biased imposition of tariff and subsidy
towards the domestic wine producer of Canada (Brandt et al. 2017).

11BUSINESS ECONOMICS
⊘ This is a preview!⊘
Do you want full access?
Subscribe today to unlock all pages.
Trusted by 1+ million students worldwide
1 out of 18
Related Documents


Your All-in-One AI-Powered Toolkit for Academic Success.
+13062052269
info@desklib.com
Available 24*7 on WhatsApp / Email
![[object Object]](/_next/static/media/star-bottom.7253800d.svg)
Unlock your academic potential
Copyright © 2020–2026 A2Z Services. All Rights Reserved. Developed and managed by ZUCOL.