Contemporary Business Economics (BM533) Report: Theories Analysis
VerifiedAdded on 2023/01/03
|15
|3338
|3
Report
AI Summary
This report delves into the core principles of contemporary business economics, commencing with a comprehensive exploration of the law of demand and the law of supply. It meticulously outlines the factors influencing demand and supply, including price changes and other external variables, and examines the movements and shifts of the demand and supply curves. The report further analyzes the interplay between price and quantity demanded and supplied, illustrated through practical examples and diagrams. The second part of the report focuses on the comparison and evaluation of Keynesian and Friedman economic theories, highlighting their key tenets, strengths, and weaknesses. It explores the roles of government spending, money supply, and inflation control within each framework, offering insights into their relevance in modern business practices and economic policies.
BM533: CONTEMPORARY
BUSINESS ECONOMICS
BUSINESS ECONOMICS
Paraphrase This Document
Need a fresh take? Get an instant paraphrase of this document with our AI Paraphraser
TABLE OF CONTENTS
INTRODUCTION...........................................................................................................................3
MAIN BODY..................................................................................................................................3
TASK 1............................................................................................................................................3
Law of demand, its movement and shift......................................................................................3
Law of supply, its movement and shift in supply curve..............................................................6
TASK 2............................................................................................................................................9
Comparison and evaluation of economic theories.......................................................................9
CONCLUSION..............................................................................................................................11
REFERENCES................................................................................................................................1
INTRODUCTION
The Business Economics can be defined as daily economic activities that help to understand
the business economic activities. This activity includes the Law of demand and law of supply by
the consumer and supplier in the market and understand the behaviour occurs on the various
factors like change in price and other factors as well (Acs and et.al., 2018). The report has made
on the topics of law of demand and law of supply and the changes occurs with the change in
price and other factor. Movement of demand of goods and suppliers are change due to change in
price without any changes in other factor whereas shift in demand and supplies are done when
there is change in other factor and price constant. Other we also discussed the theory on the 21st
century comparing with the 20th century and compare with the modern business practise.
MAIN BODY
TASK 1
Law of demand, its movement and shift
Law of Demand: The law says that the change in demand of the consumer occurs when
there is a change in quantity where other factor remains constant. It means that there is a change
in quantity demand from the customer if prices changes in the market. The behaviour of the
customer changes id there if there is change in price I.e. when the prices rise in the market of any
product then the demand of that product fallen in the market as consumer will wait for price
drop. Same as when the price of the product drop in the market consumer will demand more and
more of that product for consumption (Makowski and et.al., 2017). Whereas in law of Demand
Ceteris Paribus theory apply here which says that all other factor remains the same other than
price, quantity changes when there is a change in price. It Shows the relation between two
variables I.e quantity on horizontal axis and price on the vertical axis which shows changes in
the price show the impact on quantity demanded by the consumers in the market. However, in
real world not only price but other factor also affect the demanded quantity of the product in the
market depends on income of the consumers. The two tool of law of demand are:
Demand schedule : Shows the different level of quantity demand by the consumer at the
different price level.
Demand curve: Shows the graphical representation of the demand schedule where
horizontal shows the price of the commodity demanded by the consumer and vertical axis
shows the quantity demanded by the consumer.
⊘ This is a preview!⊘
Do you want full access?
Subscribe today to unlock all pages.
Trusted by 1+ million students worldwide
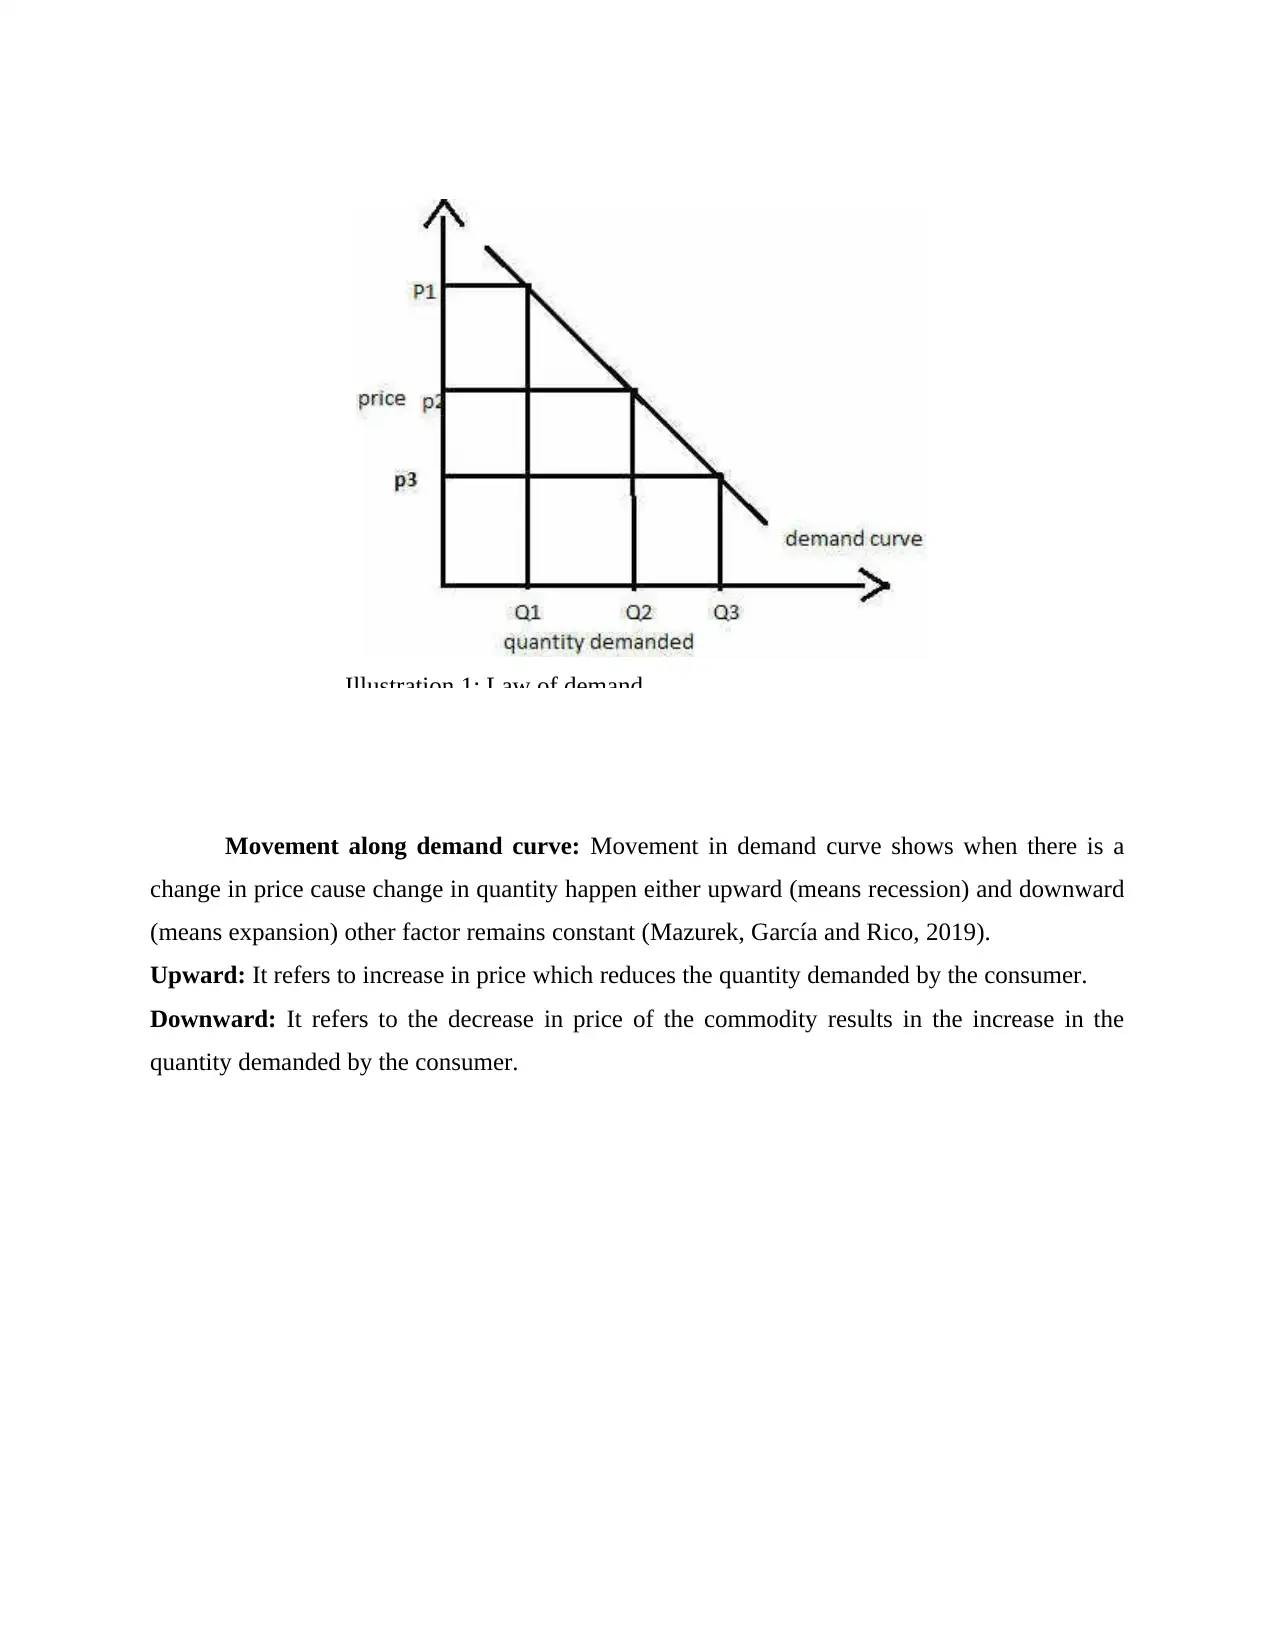
Movement along demand curve: Movement in demand curve shows when there is a
change in price cause change in quantity happen either upward (means recession) and downward
(means expansion) other factor remains constant (Mazurek, García and Rico, 2019).
Upward: It refers to increase in price which reduces the quantity demanded by the consumer.
Downward: It refers to the decrease in price of the commodity results in the increase in the
quantity demanded by the consumer.
Illustration 1: Law of demand
Paraphrase This Document
Need a fresh take? Get an instant paraphrase of this document with our AI Paraphraser
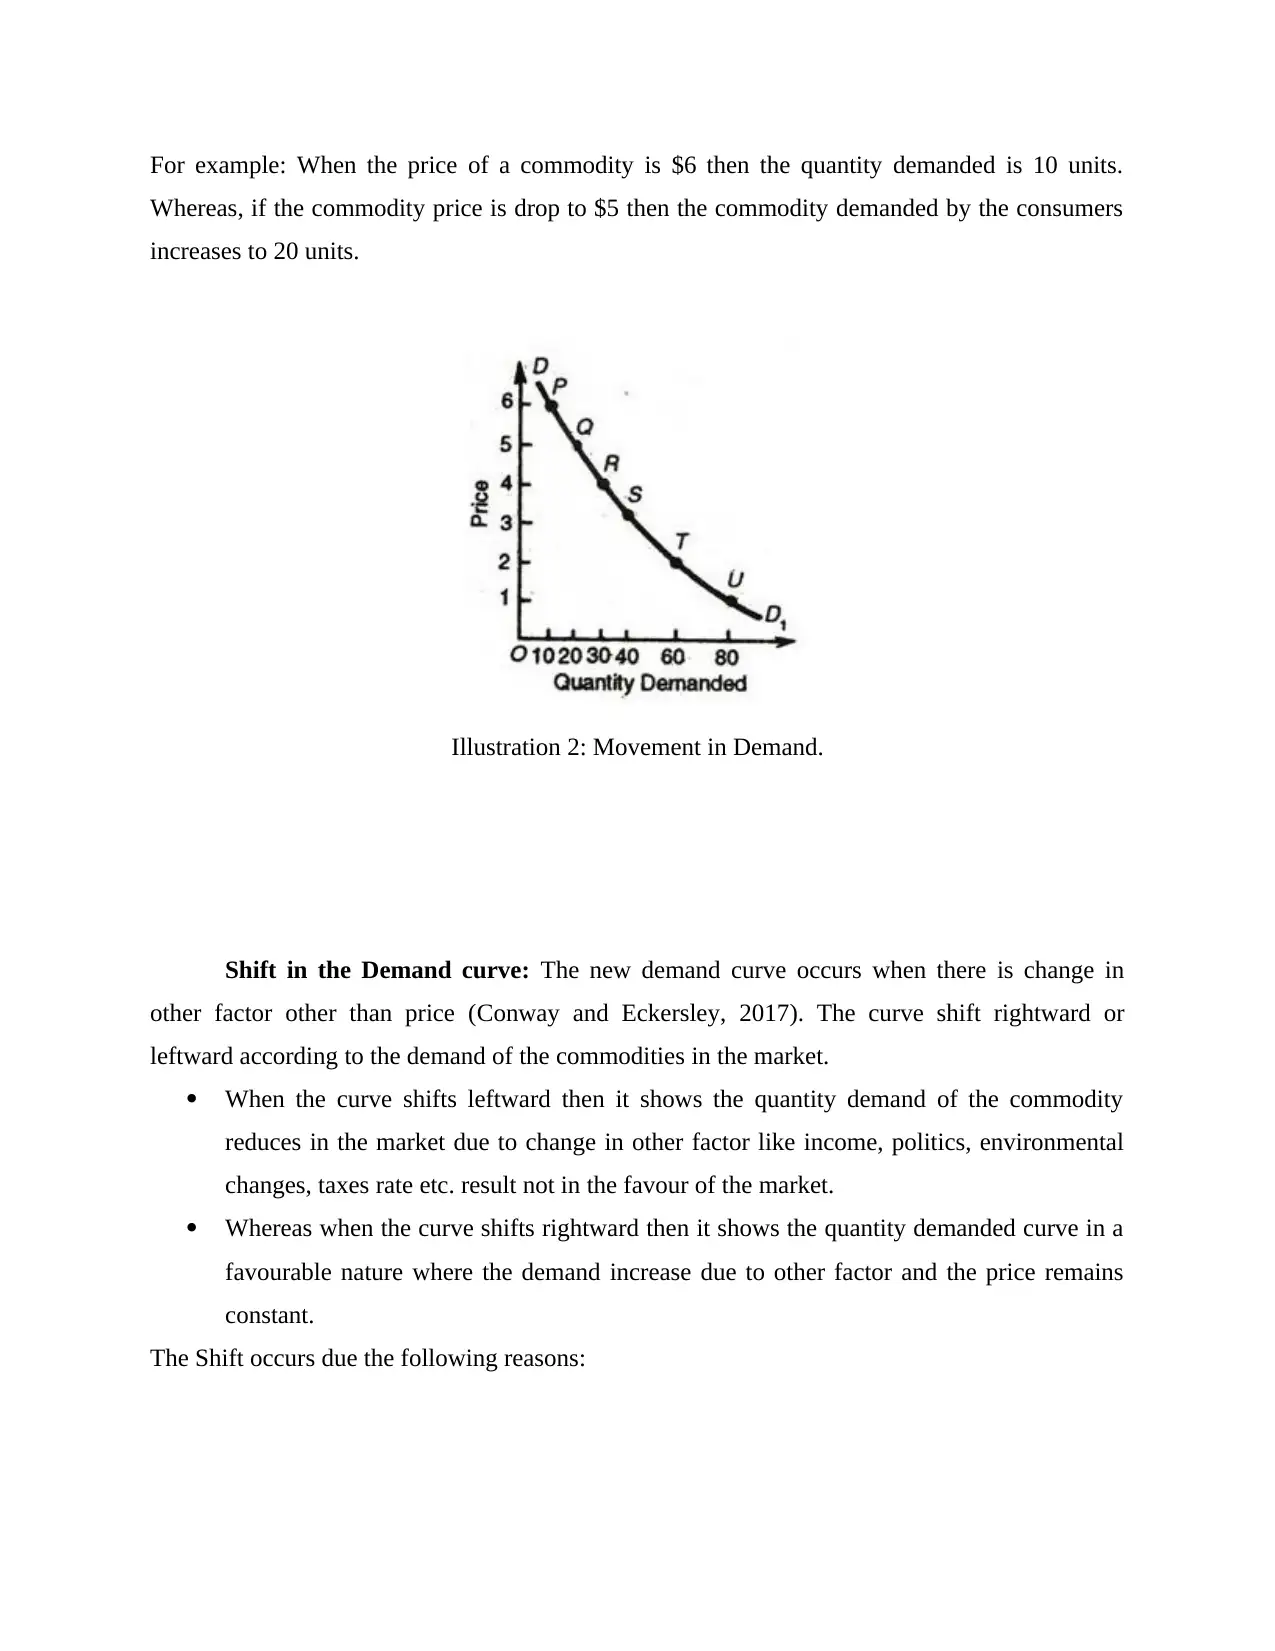
For example: When the price of a commodity is $6 then the quantity demanded is 10 units.
Whereas, if the commodity price is drop to $5 then the commodity demanded by the consumers
increases to 20 units.
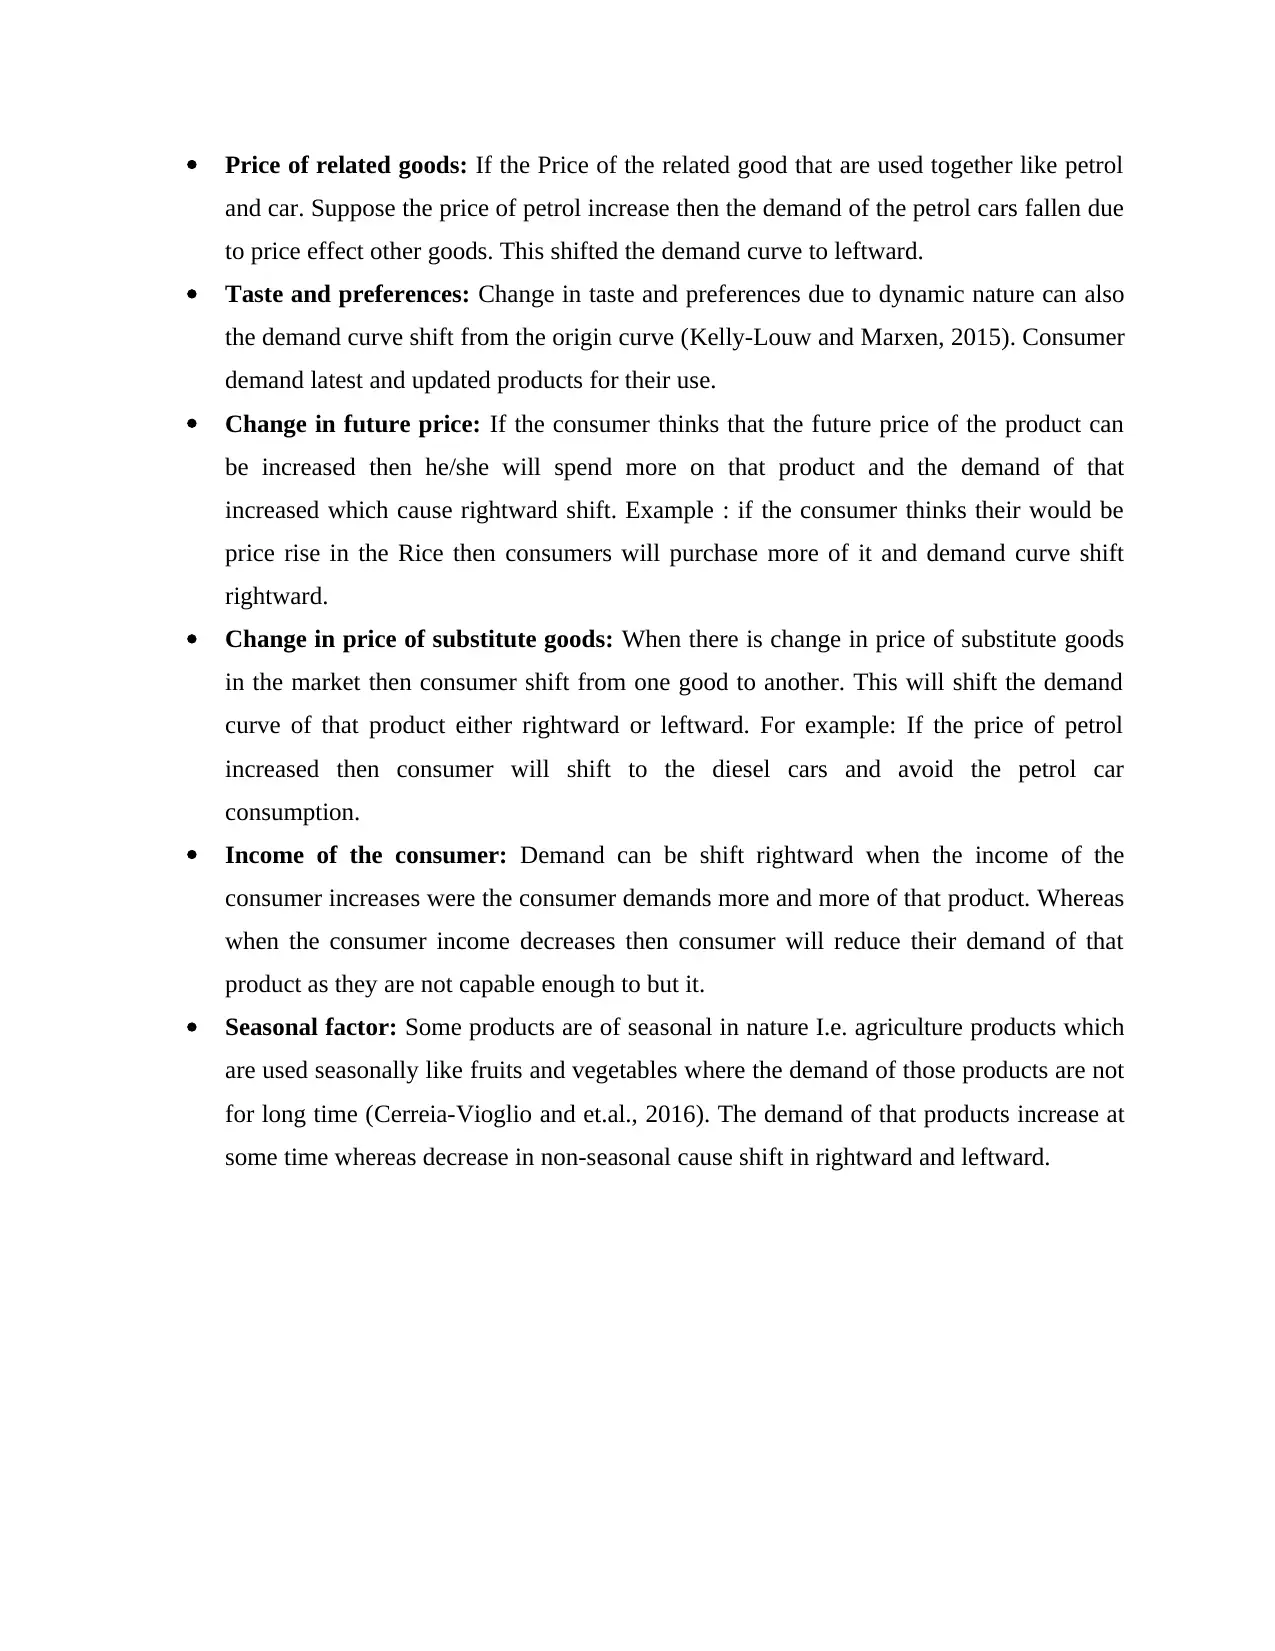
Shift in the Demand curve: The new demand curve occurs when there is change in
other factor other than price (Conway and Eckersley, 2017). The curve shift rightward or
leftward according to the demand of the commodities in the market.
When the curve shifts leftward then it shows the quantity demand of the commodity
reduces in the market due to change in other factor like income, politics, environmental
changes, taxes rate etc. result not in the favour of the market.
Whereas when the curve shifts rightward then it shows the quantity demanded curve in a
favourable nature where the demand increase due to other factor and the price remains
constant.
The Shift occurs due the following reasons:
Illustration 2: Movement in Demand.
Whereas, if the commodity price is drop to $5 then the commodity demanded by the consumers
increases to 20 units.
Shift in the Demand curve: The new demand curve occurs when there is change in
other factor other than price (Conway and Eckersley, 2017). The curve shift rightward or
leftward according to the demand of the commodities in the market.
When the curve shifts leftward then it shows the quantity demand of the commodity
reduces in the market due to change in other factor like income, politics, environmental
changes, taxes rate etc. result not in the favour of the market.
Whereas when the curve shifts rightward then it shows the quantity demanded curve in a
favourable nature where the demand increase due to other factor and the price remains
constant.
The Shift occurs due the following reasons:
Illustration 2: Movement in Demand.
Price of related goods: If the Price of the related good that are used together like petrol
and car. Suppose the price of petrol increase then the demand of the petrol cars fallen due
to price effect other goods. This shifted the demand curve to leftward.
Taste and preferences: Change in taste and preferences due to dynamic nature can also
the demand curve shift from the origin curve (Kelly-Louw and Marxen, 2015). Consumer
demand latest and updated products for their use.
Change in future price: If the consumer thinks that the future price of the product can
be increased then he/she will spend more on that product and the demand of that
increased which cause rightward shift. Example : if the consumer thinks their would be
price rise in the Rice then consumers will purchase more of it and demand curve shift
rightward.
Change in price of substitute goods: When there is change in price of substitute goods
in the market then consumer shift from one good to another. This will shift the demand
curve of that product either rightward or leftward. For example: If the price of petrol
increased then consumer will shift to the diesel cars and avoid the petrol car
consumption.
Income of the consumer: Demand can be shift rightward when the income of the
consumer increases were the consumer demands more and more of that product. Whereas
when the consumer income decreases then consumer will reduce their demand of that
product as they are not capable enough to but it.
Seasonal factor: Some products are of seasonal in nature I.e. agriculture products which
are used seasonally like fruits and vegetables where the demand of those products are not
for long time (Cerreia-Vioglio and et.al., 2016). The demand of that products increase at
some time whereas decrease in non-seasonal cause shift in rightward and leftward.
⊘ This is a preview!⊘
Do you want full access?
Subscribe today to unlock all pages.
Trusted by 1+ million students worldwide
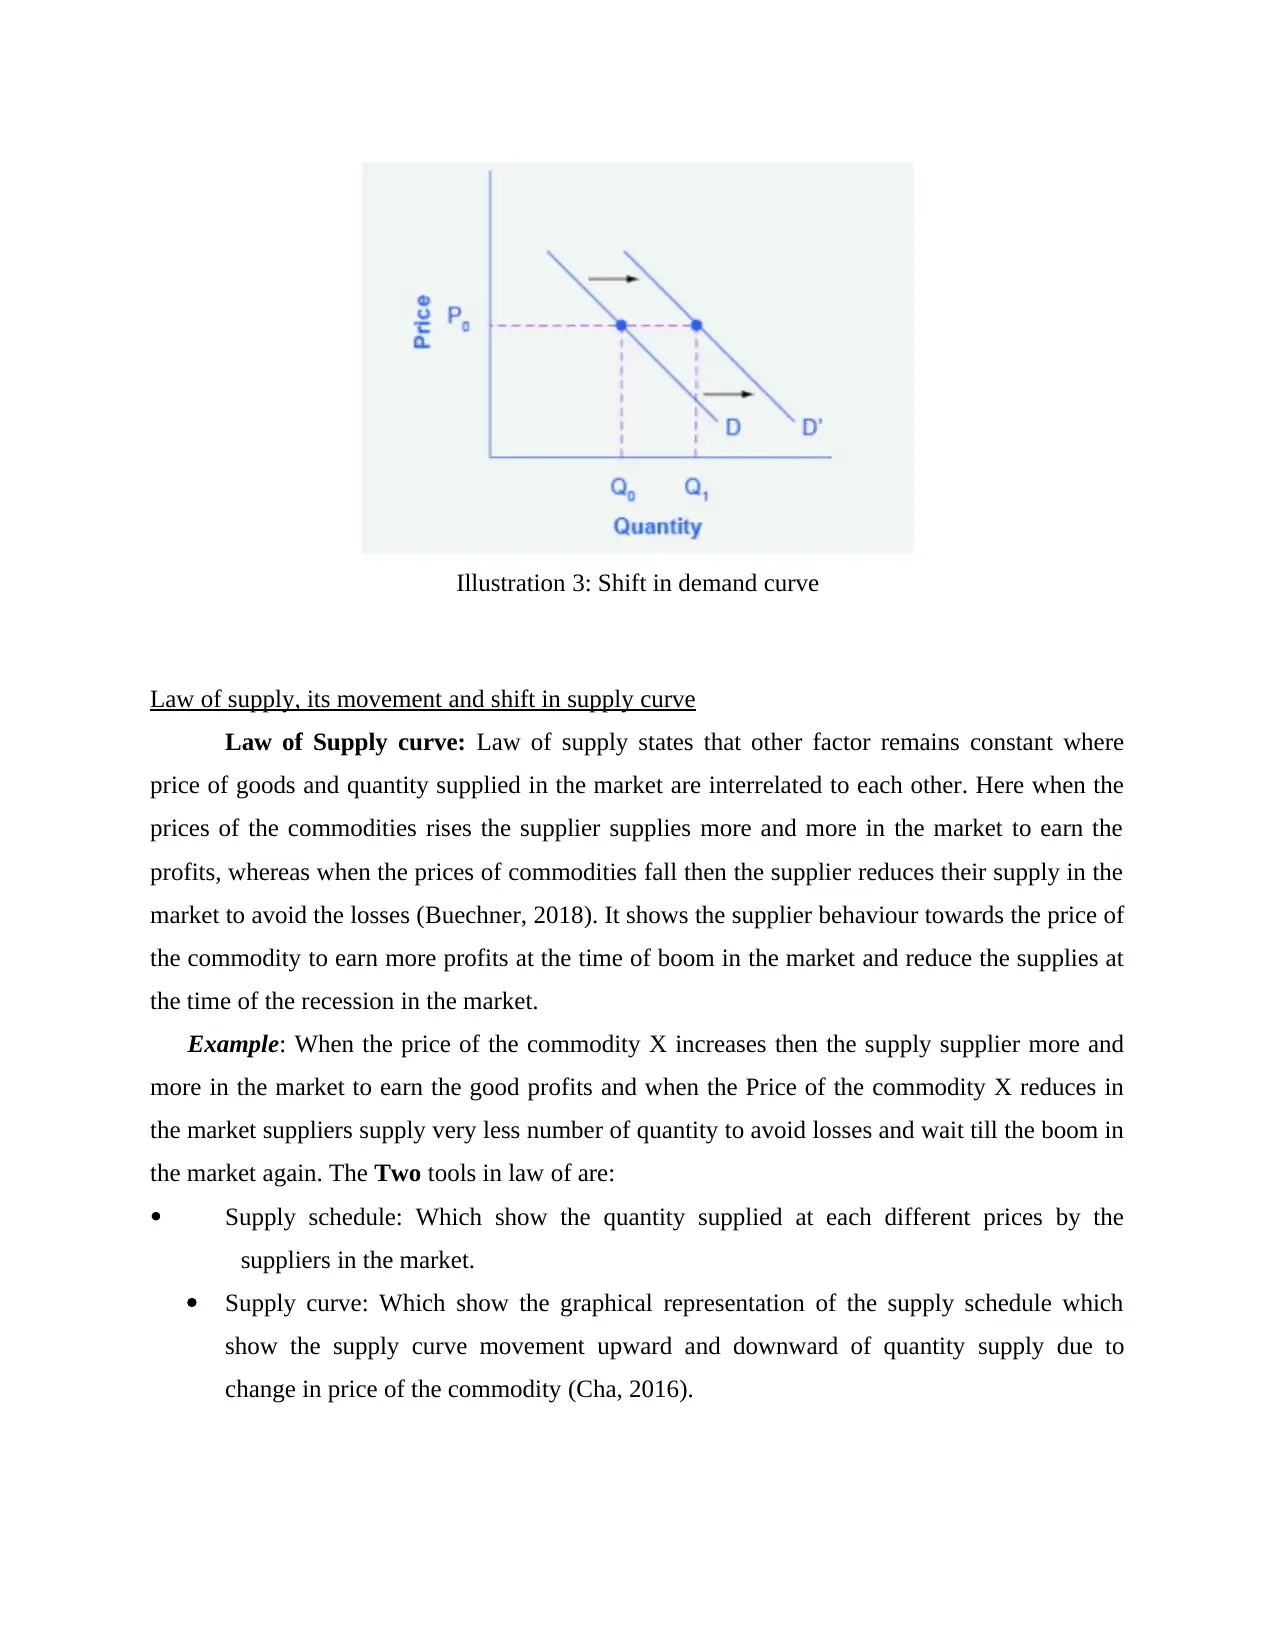
Law of supply, its movement and shift in supply curve
Law of Supply curve: Law of supply states that other factor remains constant where
price of goods and quantity supplied in the market are interrelated to each other. Here when the
prices of the commodities rises the supplier supplies more and more in the market to earn the
profits, whereas when the prices of commodities fall then the supplier reduces their supply in the
market to avoid the losses (Buechner, 2018). It shows the supplier behaviour towards the price of
the commodity to earn more profits at the time of boom in the market and reduce the supplies at
the time of the recession in the market.
Example: When the price of the commodity X increases then the supply supplier more and
more in the market to earn the good profits and when the Price of the commodity X reduces in
the market suppliers supply very less number of quantity to avoid losses and wait till the boom in
the market again. The Two tools in law of are:
Supply schedule: Which show the quantity supplied at each different prices by the
suppliers in the market.
Supply curve: Which show the graphical representation of the supply schedule which
show the supply curve movement upward and downward of quantity supply due to
change in price of the commodity (Cha, 2016).
Illustration 3: Shift in demand curve
Paraphrase This Document
Need a fresh take? Get an instant paraphrase of this document with our AI Paraphraser
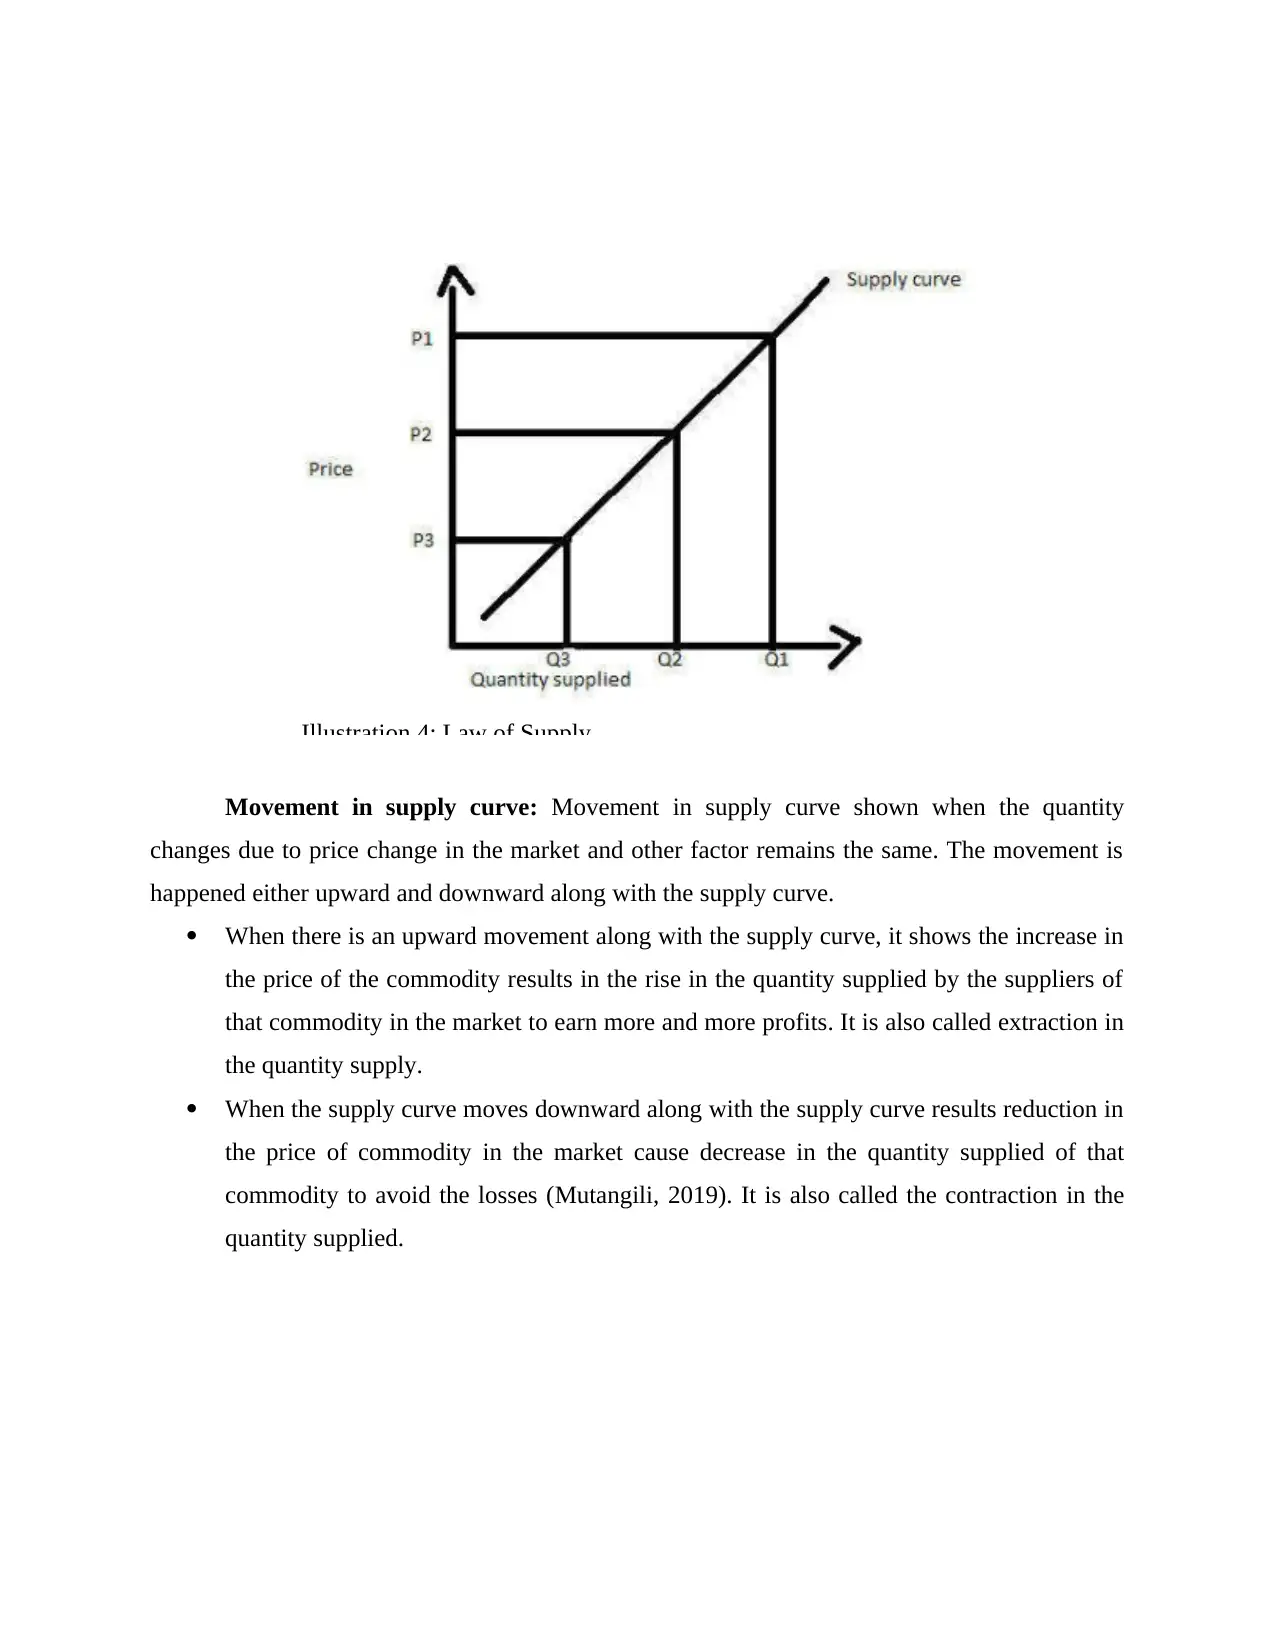
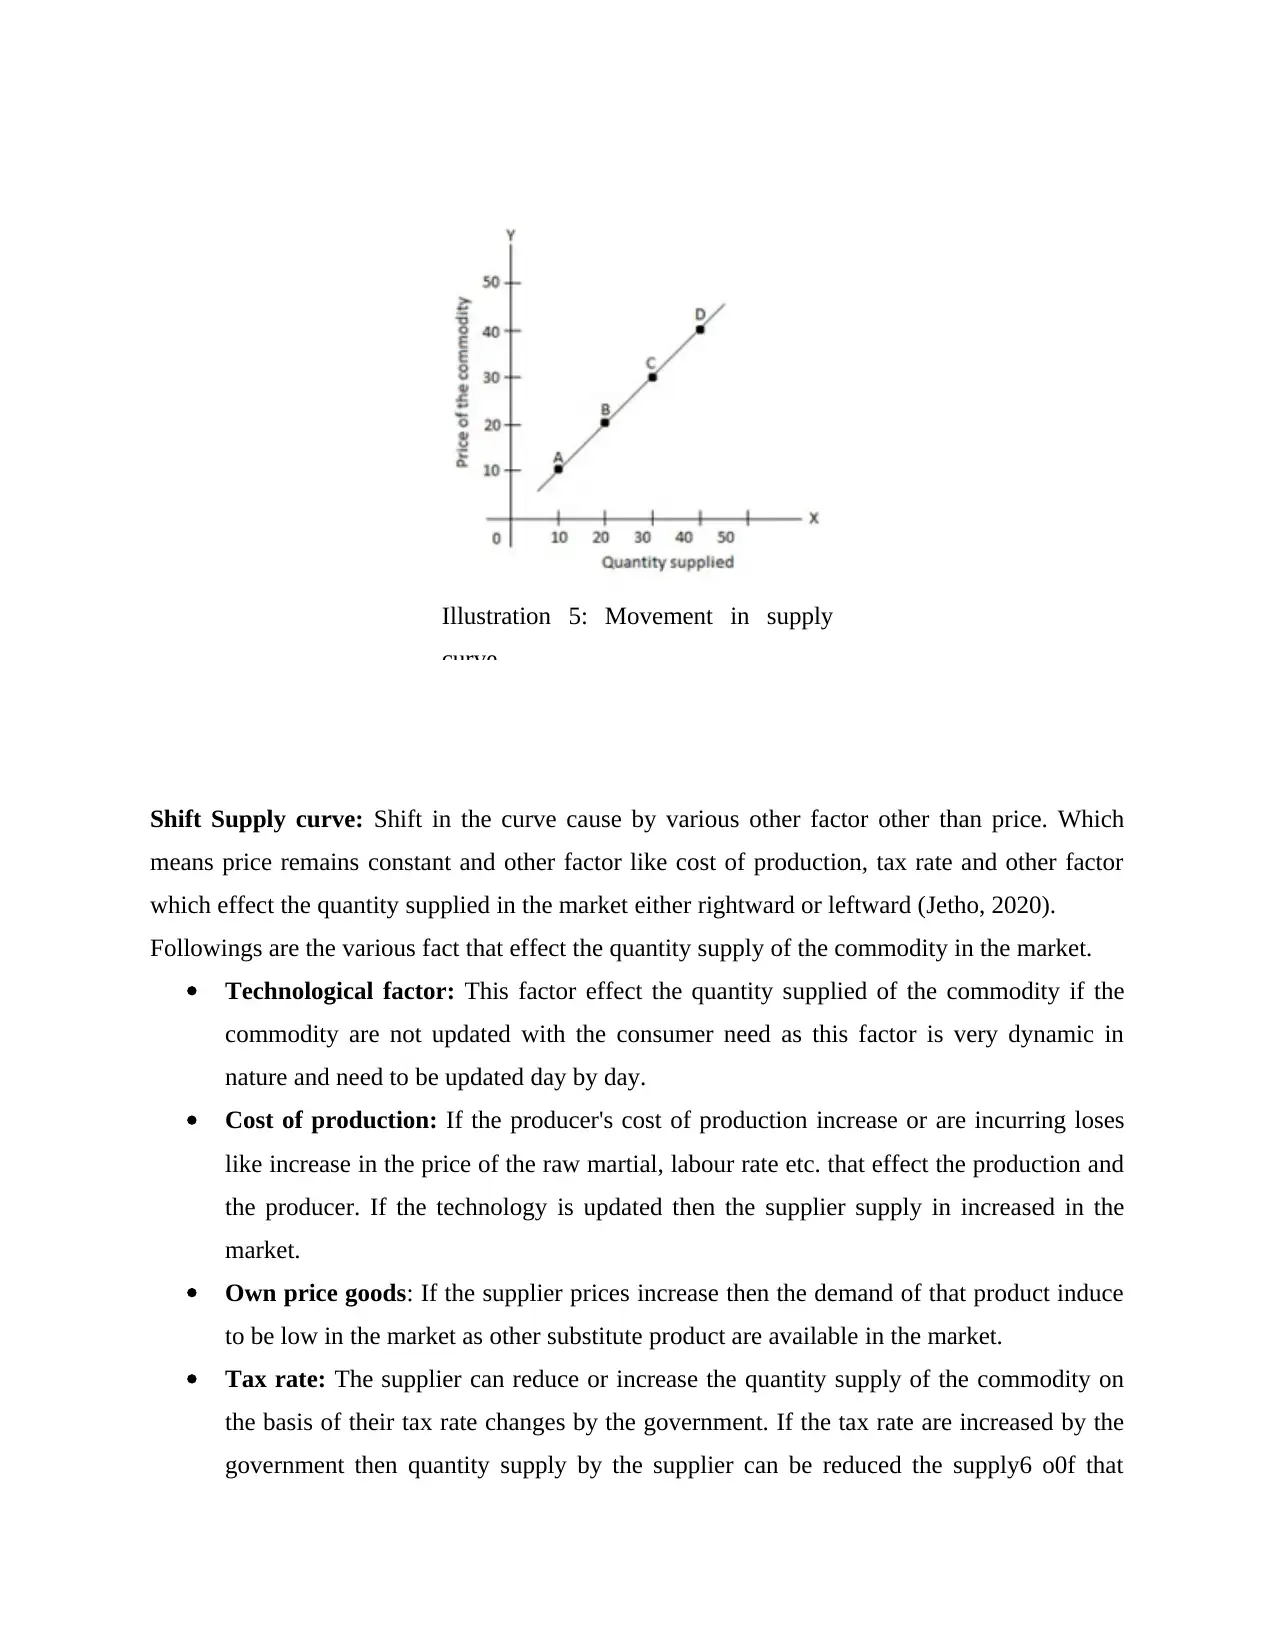
Movement in supply curve: Movement in supply curve shown when the quantity
changes due to price change in the market and other factor remains the same. The movement is
happened either upward and downward along with the supply curve.
When there is an upward movement along with the supply curve, it shows the increase in
the price of the commodity results in the rise in the quantity supplied by the suppliers of
that commodity in the market to earn more and more profits. It is also called extraction in
the quantity supply.
When the supply curve moves downward along with the supply curve results reduction in
the price of commodity in the market cause decrease in the quantity supplied of that
commodity to avoid the losses (Mutangili, 2019). It is also called the contraction in the
quantity supplied.
Illustration 4: Law of Supply
Shift Supply curve: Shift in the curve cause by various other factor other than price. Which
means price remains constant and other factor like cost of production, tax rate and other factor
which effect the quantity supplied in the market either rightward or leftward (Jetho, 2020).
Followings are the various fact that effect the quantity supply of the commodity in the market.
Technological factor: This factor effect the quantity supplied of the commodity if the
commodity are not updated with the consumer need as this factor is very dynamic in
nature and need to be updated day by day.
Cost of production: If the producer's cost of production increase or are incurring loses
like increase in the price of the raw martial, labour rate etc. that effect the production and
the producer. If the technology is updated then the supplier supply in increased in the
market.
Own price goods: If the supplier prices increase then the demand of that product induce
to be low in the market as other substitute product are available in the market.
Tax rate: The supplier can reduce or increase the quantity supply of the commodity on
the basis of their tax rate changes by the government. If the tax rate are increased by the
government then quantity supply by the supplier can be reduced the supply6 o0f that
Illustration 5: Movement in supply
curve
⊘ This is a preview!⊘
Do you want full access?
Subscribe today to unlock all pages.
Trusted by 1+ million students worldwide
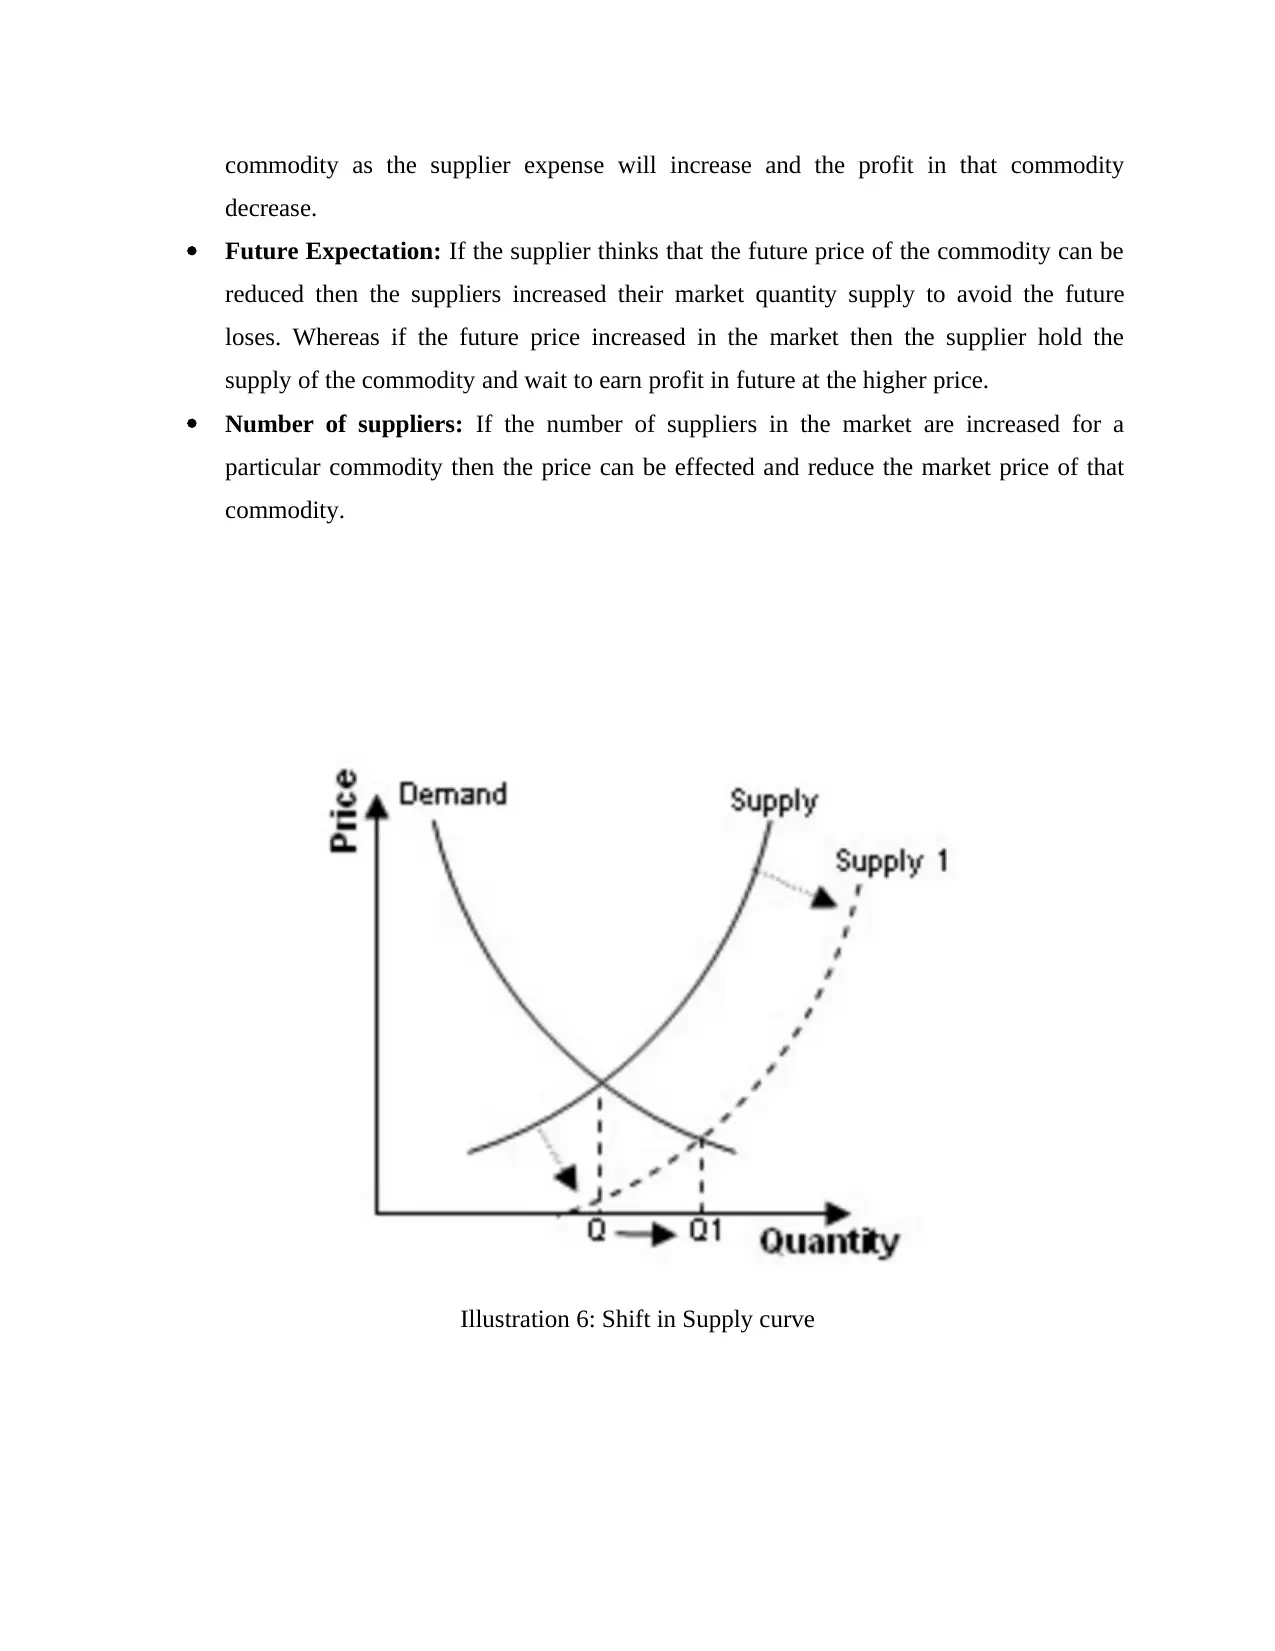
commodity as the supplier expense will increase and the profit in that commodity
decrease.
Future Expectation: If the supplier thinks that the future price of the commodity can be
reduced then the suppliers increased their market quantity supply to avoid the future
loses. Whereas if the future price increased in the market then the supplier hold the
supply of the commodity and wait to earn profit in future at the higher price.
Number of suppliers: If the number of suppliers in the market are increased for a
particular commodity then the price can be effected and reduce the market price of that
commodity.
Illustration 6: Shift in Supply curve
Paraphrase This Document
Need a fresh take? Get an instant paraphrase of this document with our AI Paraphraser
TASK 2
Comparison and evaluation of economic theories
Keynesian theory: was invented in the 1930 by British economist John Maynard Keynes
that states that Government should increase spending in the economy that increases the aggregate
demand in the market. This theory believes that consumer aggregate demand is primary driven to
focus on the economy. Its show the fiscal policy of the government that are used and spending on
the infrastructure, benefits for unemployment and education for all. But the main drawback of
this theory is overdoing cause increase in the inflation (Galí, 2018). This theory includes the
insufficient demand in the country, labour market deficient spending etc. And if the country's
people spend less and save more that effect the recession even harder than company will not
produce much of the products which results in less sales in the company and thereafter company
will cut their labour and the wages for the labour and union trade should be rigid. The theory
gives the definition that government have to spend more on it to compensate the demand for the
organization (Tily, 2016). This theory is criticizes by the free market economist where they have
given certain statement about the theory give more attention to the Friedman theory.
Fried man's theory focus on the inflation low and stable by proper utilization of money
supply. When the Inflations are too high in the economy, money supply can be reduced and
demand and supply will back to balanced level and the interest rate can be change in certain
circumstances, and should be flexible minimum wages should be provided to the labours and
union trade (Friedman, 2016). In Keynes theory says that the in recession when the economy
have increased the aggregate demand that will be minimal effect on the price of the product but
will affect the real output, Friedman is more emphasize in keeping the inflation low and maintain
the employment wage in the economy. Whereas Keynes theory leads to no crowding out in
recession and in the Friedman theory government borrowings lead to the crowding out in the
recession period and also focused on the natural rate of unemployment and according to Keynes
theory idea of the government cannot influence the economic cycle by the business cycle (Arthur
Jr, 2017).
When the economy hits recession again in the 2008 and 2009 in the USA where
government increased the money supply and government spending, the elements are applied to
bring back the economy but can’t get out of it and the Fishers' theory was considered by the
nation to bring back the inflations level.
Fishers theory: This theory says that all other factors remains constant, as the quantity of
money flow increased in the market, the price level also increased which cause the decrease in
the value of money in the market and same as if the money flow in the market decreases then the
price level decrease and but the value of money increases in the market (Cardao-Pito, 2017).
Formula of Fishers:
MV=PT or P = MV/T
Where,
M = quantity of money
V = Transaction velocity
P = Price level
T = total goods and service transacted.
the value of money or the price level is determined by the demand and supply in the market.
Supply of Money: The supply of money is control by the Central bank of the country
Money supply means where the quantity of money presents in the market or total amount
of money present in the market. Money include currency and coins. MV means total
volume of money flows during a certain period. Total supply of money also gives total
money expenditure during the period (Choi, 2020).
Demand of Money: Demand of money refer to total money hold by household and
companies in the market. The several factors that are affected the demand of money are
income level of consumers, interest rate by the government, during the inflation and
uncertainties in the economy.
Demand of supply have 3 major reason: Transaction: This is needed money by the consumer to do transaction. Precautionary: Money needed for the uncertain need by the consumer for the future.
Speculation: People hold the money for the future unexpected situations to take the
advantage of the future investment opportunities.
CONCLUSION
From the above discuss we conclude that Law of demand and law of supply for a
commodity changes with the price and other factor and I.e. movement and shift in the demand
curve and supply curve and knowing the behaviour of the consumer and supplier on the changes
on the curve. Whereas we also conclude the three theory of the economics and compare their
⊘ This is a preview!⊘
Do you want full access?
Subscribe today to unlock all pages.
Trusted by 1+ million students worldwide
1 out of 15
Related Documents


Your All-in-One AI-Powered Toolkit for Academic Success.
+13062052269
info@desklib.com
Available 24*7 on WhatsApp / Email
![[object Object]](/_next/static/media/star-bottom.7253800d.svg)
Unlock your academic potential
Copyright © 2020–2026 A2Z Services. All Rights Reserved. Developed and managed by ZUCOL.