BM533: Demand-Supply Analysis and 21st Century Business Economics
VerifiedAdded on 2023/06/15
|12
|3062
|321
Report
AI Summary
This report provides a detailed analysis of demand and supply principles, including the law of demand, movement along the demand curve, and changes in the demand curve. It also explores the law of supply, movement along the supply curve, and changes in the supply curve. The report further evaluates and contrasts new ideas and concepts in 21st-century economics with those from previous centuries, linking them to current corporate practices. Neoliberal economics and its focus on wealth inequality are compared to traditional economic models. The document concludes by emphasizing the importance of maintaining economic equilibrium and leveraging investment for effective economic growth. This student-contributed assignment is available on Desklib, a platform offering a wide array of study tools and resources for students.
Contemporary business
economics
economics
Paraphrase This Document
Need a fresh take? Get an instant paraphrase of this document with our AI Paraphraser
Contents
Contents...........................................................................................................................................2
INTRODUCTION...........................................................................................................................1
MAIN BODY..................................................................................................................................1
TASK 1........................................................................................................................................1
TASK 2........................................................................................................................................7
CONCLUSION................................................................................................................................8
REFERENCES................................................................................................................................9

⊘ This is a preview!⊘
Do you want full access?
Subscribe today to unlock all pages.
Trusted by 1+ million students worldwide
INTRODUCTION
Demand is an economics framework which explains the myriad of factors to be bought and
the amount each person is prepared to spend (Babic-Hodovic, Arslanagic-Kalajdzic and
Imsirpasic, 2017). The quantity of goods which a company must provide in addition to achieve
its profit is referred to as availability. Demand and supply principles are established in the
present questioning. Several charts would be used to illustrate changes in supplied or
consumption trends. Current macroeconomic models would also be examined in the foregoing
report.
MAIN BODY
TASK 1
Demand and supply are the two most important economics words. Companies can choose
how assets are employed and performing regular operations in such ecosystems.
Law of demand- The quantity demanded illustrates how customers' preferences change
when prices rise. If other factors consistently influence consumption and the cost of a product
rises, it leads to the decrease in item or service particular consumers. This is typical client desire
pattern. Because all other circumstances remain constant, the quantity sought by a product is
equal to the cost of a product, according to the quantity required. This implies that as costs
increase, interest falls. The law of consumption states that cost increases impact the number
purchased. This means that if firms charge greater costs for their activities and goods, consumers
might be less likely to acquire them, resulting in a fall in volume of goods. Decreased effective
usage is primarily to blame for this shift in demands (Cavicchioli, 2018). The consumption
criterion is crucial in economy growth policy. The efficient allocation of assets in an industry is
established using the availability principle, and the best cost and volume are discovered. The
chart is a slope that shows the relationship among the amount demanded and the cost of a
product. The consumption slope's form varies depending on the item. The quantity demanded is
frequently curved in shape. In several economics books, however, a consumption slope has still
been depicted as a single direction. The x-axis represents the quantity required, while the y-axis
represents the cost. The explanation of the rule of consumption predicts a falling quantity
demanded. The difference among the volume requested and the volume necessary should be
identified. The required volume refers to the number of goods available to buy at a specific
Paraphrase This Document
Need a fresh take? Get an instant paraphrase of this document with our AI Paraphraser
pricing level. Demand, on either side, shows all of the relationships among the pricing of items
and the quantity demanded. Customers of the business frequently buy items that match one‘s
immediate demands initially, then buy more items components in order to service lesser worth.
This demanding legislation is constantly focused on the firm's customers' unending desires.
Customers' socioeconomic psychology dictates that they expend their resources on the lowest
urgent necessities initially. Whenever purchasers acquire an item on the marketplace, people
would like to spend a lesser cost than they did before for their present requirements. The
manufacturing slope is defined as the total number of quantity of goods available to buy at the
market valuation. Q represents quantity demanded; if quantity demanded is insufficient, Q1
represents the higher cost shown in p1. Whenever corporations hike commodities rates,
consumption falls; nevertheless, if corporations provide things at reduced or affordable levels,
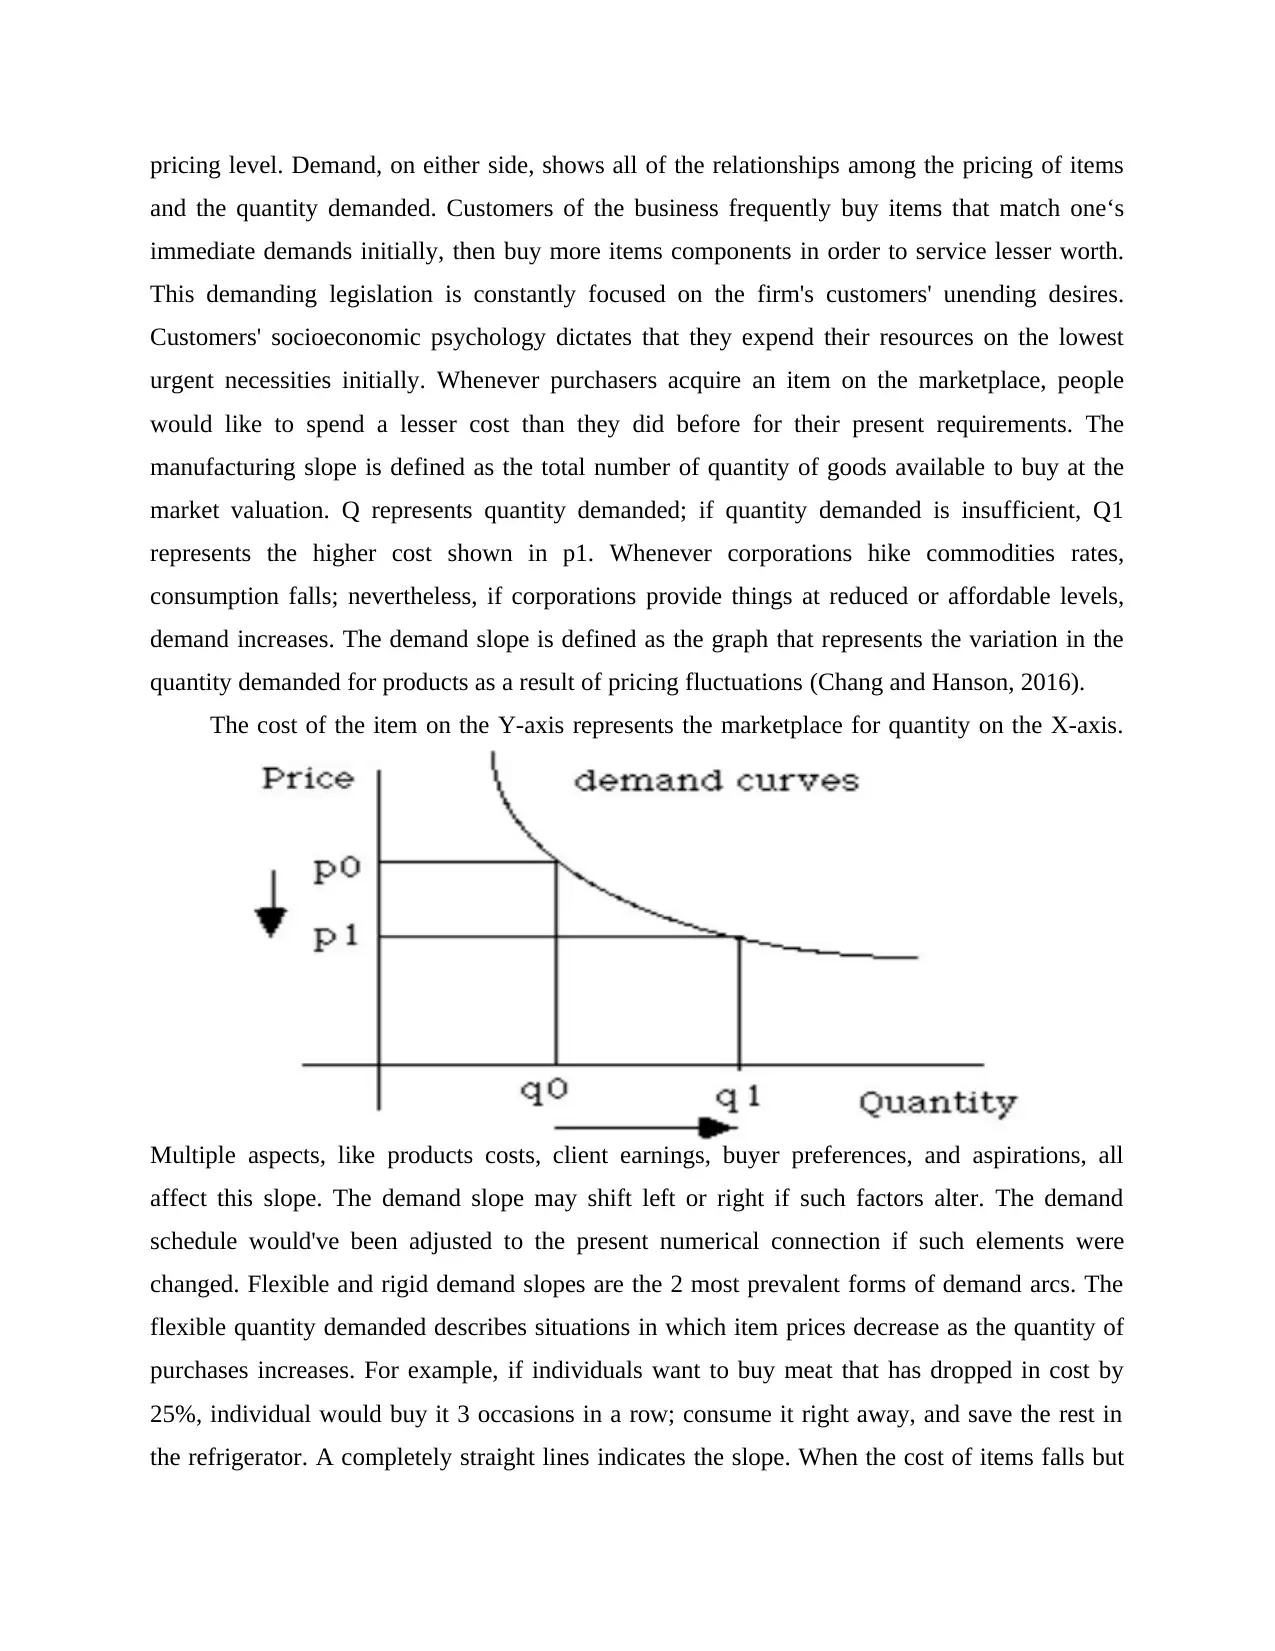
demand increases. The demand slope is defined as the graph that represents the variation in the
quantity demanded for products as a result of pricing fluctuations (Chang and Hanson, 2016).
The cost of the item on the Y-axis represents the marketplace for quantity on the X-axis.
Multiple aspects, like products costs, client earnings, buyer preferences, and aspirations, all
affect this slope. The demand slope may shift left or right if such factors alter. The demand
schedule would've been adjusted to the present numerical connection if such elements were
changed. Flexible and rigid demand slopes are the 2 most prevalent forms of demand arcs. The
flexible quantity demanded describes situations in which item prices decrease as the quantity of
purchases increases. For example, if individuals want to buy meat that has dropped in cost by
25%, individual would buy it 3 occasions in a row; consume it right away, and save the rest in
the refrigerator. A completely straight lines indicates the slope. When the cost of items falls but
and the quantity demanded. Customers of the business frequently buy items that match one‘s
immediate demands initially, then buy more items components in order to service lesser worth.
This demanding legislation is constantly focused on the firm's customers' unending desires.
Customers' socioeconomic psychology dictates that they expend their resources on the lowest
urgent necessities initially. Whenever purchasers acquire an item on the marketplace, people
would like to spend a lesser cost than they did before for their present requirements. The
manufacturing slope is defined as the total number of quantity of goods available to buy at the
market valuation. Q represents quantity demanded; if quantity demanded is insufficient, Q1
represents the higher cost shown in p1. Whenever corporations hike commodities rates,
consumption falls; nevertheless, if corporations provide things at reduced or affordable levels,
demand increases. The demand slope is defined as the graph that represents the variation in the
quantity demanded for products as a result of pricing fluctuations (Chang and Hanson, 2016).
The cost of the item on the Y-axis represents the marketplace for quantity on the X-axis.
Multiple aspects, like products costs, client earnings, buyer preferences, and aspirations, all
affect this slope. The demand slope may shift left or right if such factors alter. The demand
schedule would've been adjusted to the present numerical connection if such elements were
changed. Flexible and rigid demand slopes are the 2 most prevalent forms of demand arcs. The
flexible quantity demanded describes situations in which item prices decrease as the quantity of
purchases increases. For example, if individuals want to buy meat that has dropped in cost by
25%, individual would buy it 3 occasions in a row; consume it right away, and save the rest in
the refrigerator. A completely straight lines indicates the slope. When the cost of items falls but
the quantity purchased does not, the situation is called inelastic. If the individual decides to get
avocados, for instance, he would only get the limited goods since he understands that large
acquisitions would not meet the need. If avocado costs fall by 25%, people will only be able to
buy the amount of bananas they want. A steeply linear inelastic demand graph is presented.
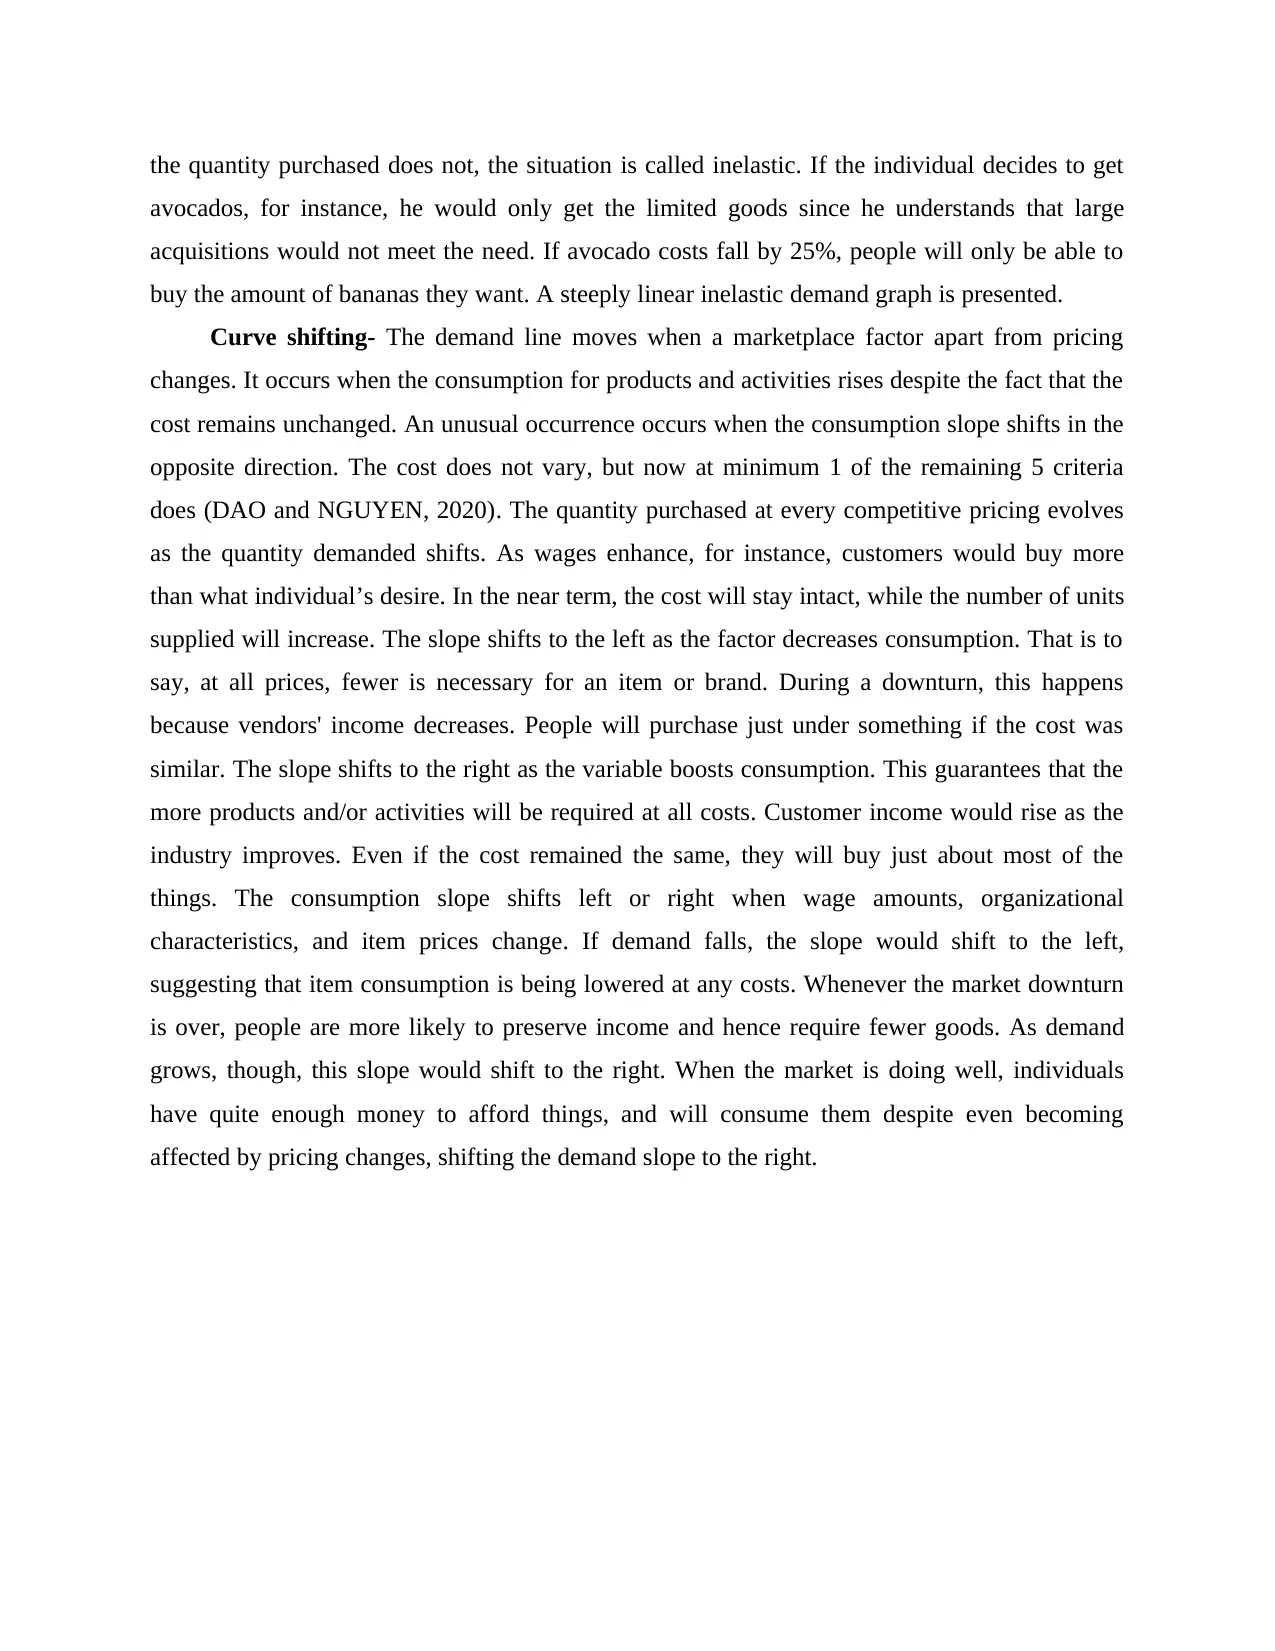
Curve shifting- The demand line moves when a marketplace factor apart from pricing
changes. It occurs when the consumption for products and activities rises despite the fact that the
cost remains unchanged. An unusual occurrence occurs when the consumption slope shifts in the
opposite direction. The cost does not vary, but now at minimum 1 of the remaining 5 criteria
does (DAO and NGUYEN, 2020). The quantity purchased at every competitive pricing evolves
as the quantity demanded shifts. As wages enhance, for instance, customers would buy more
than what individual’s desire. In the near term, the cost will stay intact, while the number of units
supplied will increase. The slope shifts to the left as the factor decreases consumption. That is to
say, at all prices, fewer is necessary for an item or brand. During a downturn, this happens
because vendors' income decreases. People will purchase just under something if the cost was
similar. The slope shifts to the right as the variable boosts consumption. This guarantees that the
more products and/or activities will be required at all costs. Customer income would rise as the
industry improves. Even if the cost remained the same, they will buy just about most of the
things. The consumption slope shifts left or right when wage amounts, organizational
characteristics, and item prices change. If demand falls, the slope would shift to the left,
suggesting that item consumption is being lowered at any costs. Whenever the market downturn
is over, people are more likely to preserve income and hence require fewer goods. As demand
grows, though, this slope would shift to the right. When the market is doing well, individuals
have quite enough money to afford things, and will consume them despite even becoming
affected by pricing changes, shifting the demand slope to the right.
avocados, for instance, he would only get the limited goods since he understands that large
acquisitions would not meet the need. If avocado costs fall by 25%, people will only be able to
buy the amount of bananas they want. A steeply linear inelastic demand graph is presented.
Curve shifting- The demand line moves when a marketplace factor apart from pricing
changes. It occurs when the consumption for products and activities rises despite the fact that the
cost remains unchanged. An unusual occurrence occurs when the consumption slope shifts in the
opposite direction. The cost does not vary, but now at minimum 1 of the remaining 5 criteria
does (DAO and NGUYEN, 2020). The quantity purchased at every competitive pricing evolves
as the quantity demanded shifts. As wages enhance, for instance, customers would buy more
than what individual’s desire. In the near term, the cost will stay intact, while the number of units
supplied will increase. The slope shifts to the left as the factor decreases consumption. That is to
say, at all prices, fewer is necessary for an item or brand. During a downturn, this happens
because vendors' income decreases. People will purchase just under something if the cost was
similar. The slope shifts to the right as the variable boosts consumption. This guarantees that the
more products and/or activities will be required at all costs. Customer income would rise as the
industry improves. Even if the cost remained the same, they will buy just about most of the
things. The consumption slope shifts left or right when wage amounts, organizational
characteristics, and item prices change. If demand falls, the slope would shift to the left,
suggesting that item consumption is being lowered at any costs. Whenever the market downturn
is over, people are more likely to preserve income and hence require fewer goods. As demand
grows, though, this slope would shift to the right. When the market is doing well, individuals
have quite enough money to afford things, and will consume them despite even becoming
affected by pricing changes, shifting the demand slope to the right.
⊘ This is a preview!⊘
Do you want full access?
Subscribe today to unlock all pages.
Trusted by 1+ million students worldwide
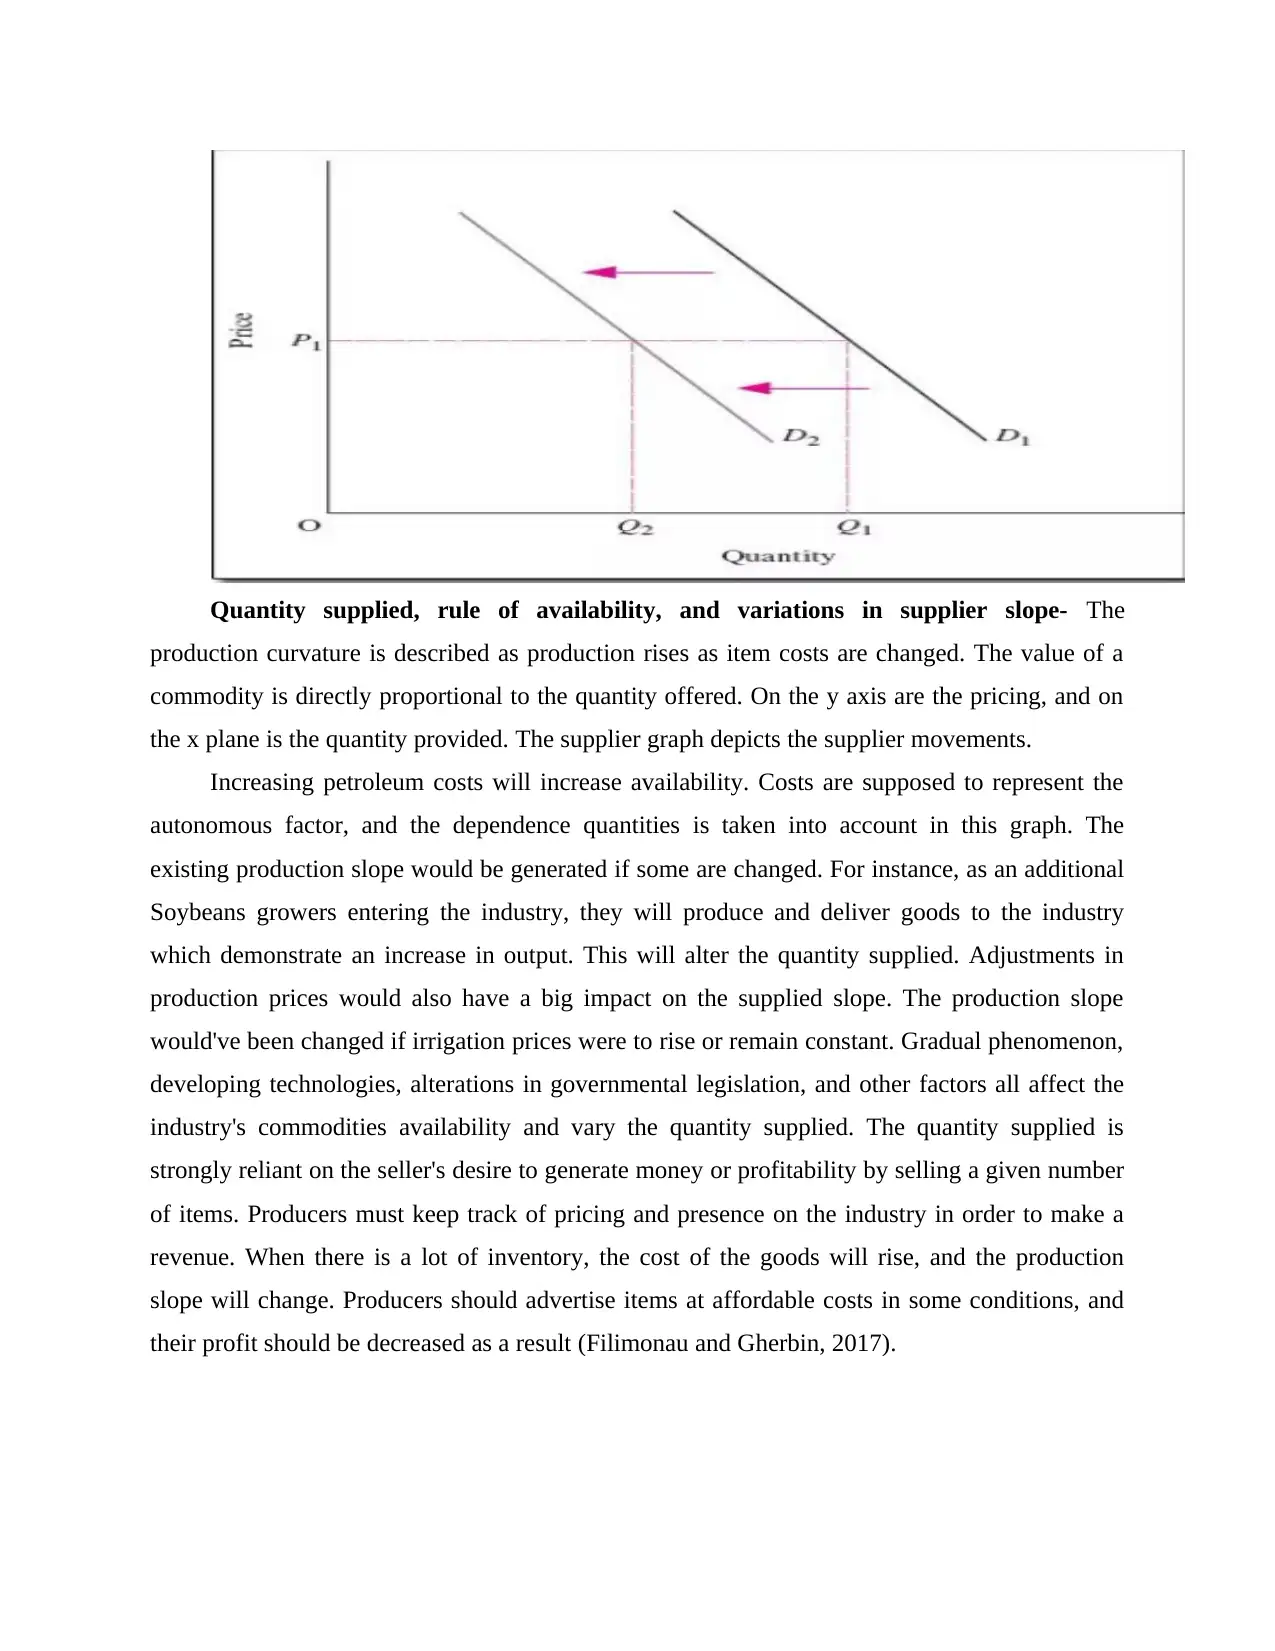
Quantity supplied, rule of availability, and variations in supplier slope- The
production curvature is described as production rises as item costs are changed. The value of a
commodity is directly proportional to the quantity offered. On the y axis are the pricing, and on
the x plane is the quantity provided. The supplier graph depicts the supplier movements.
Increasing petroleum costs will increase availability. Costs are supposed to represent the
autonomous factor, and the dependence quantities is taken into account in this graph. The
existing production slope would be generated if some are changed. For instance, as an additional
Soybeans growers entering the industry, they will produce and deliver goods to the industry
which demonstrate an increase in output. This will alter the quantity supplied. Adjustments in
production prices would also have a big impact on the supplied slope. The production slope
would've been changed if irrigation prices were to rise or remain constant. Gradual phenomenon,
developing technologies, alterations in governmental legislation, and other factors all affect the
industry's commodities availability and vary the quantity supplied. The quantity supplied is
strongly reliant on the seller's desire to generate money or profitability by selling a given number
of items. Producers must keep track of pricing and presence on the industry in order to make a
revenue. When there is a lot of inventory, the cost of the goods will rise, and the production
slope will change. Producers should advertise items at affordable costs in some conditions, and
their profit should be decreased as a result (Filimonau and Gherbin, 2017).
Paraphrase This Document
Need a fresh take? Get an instant paraphrase of this document with our AI Paraphraser
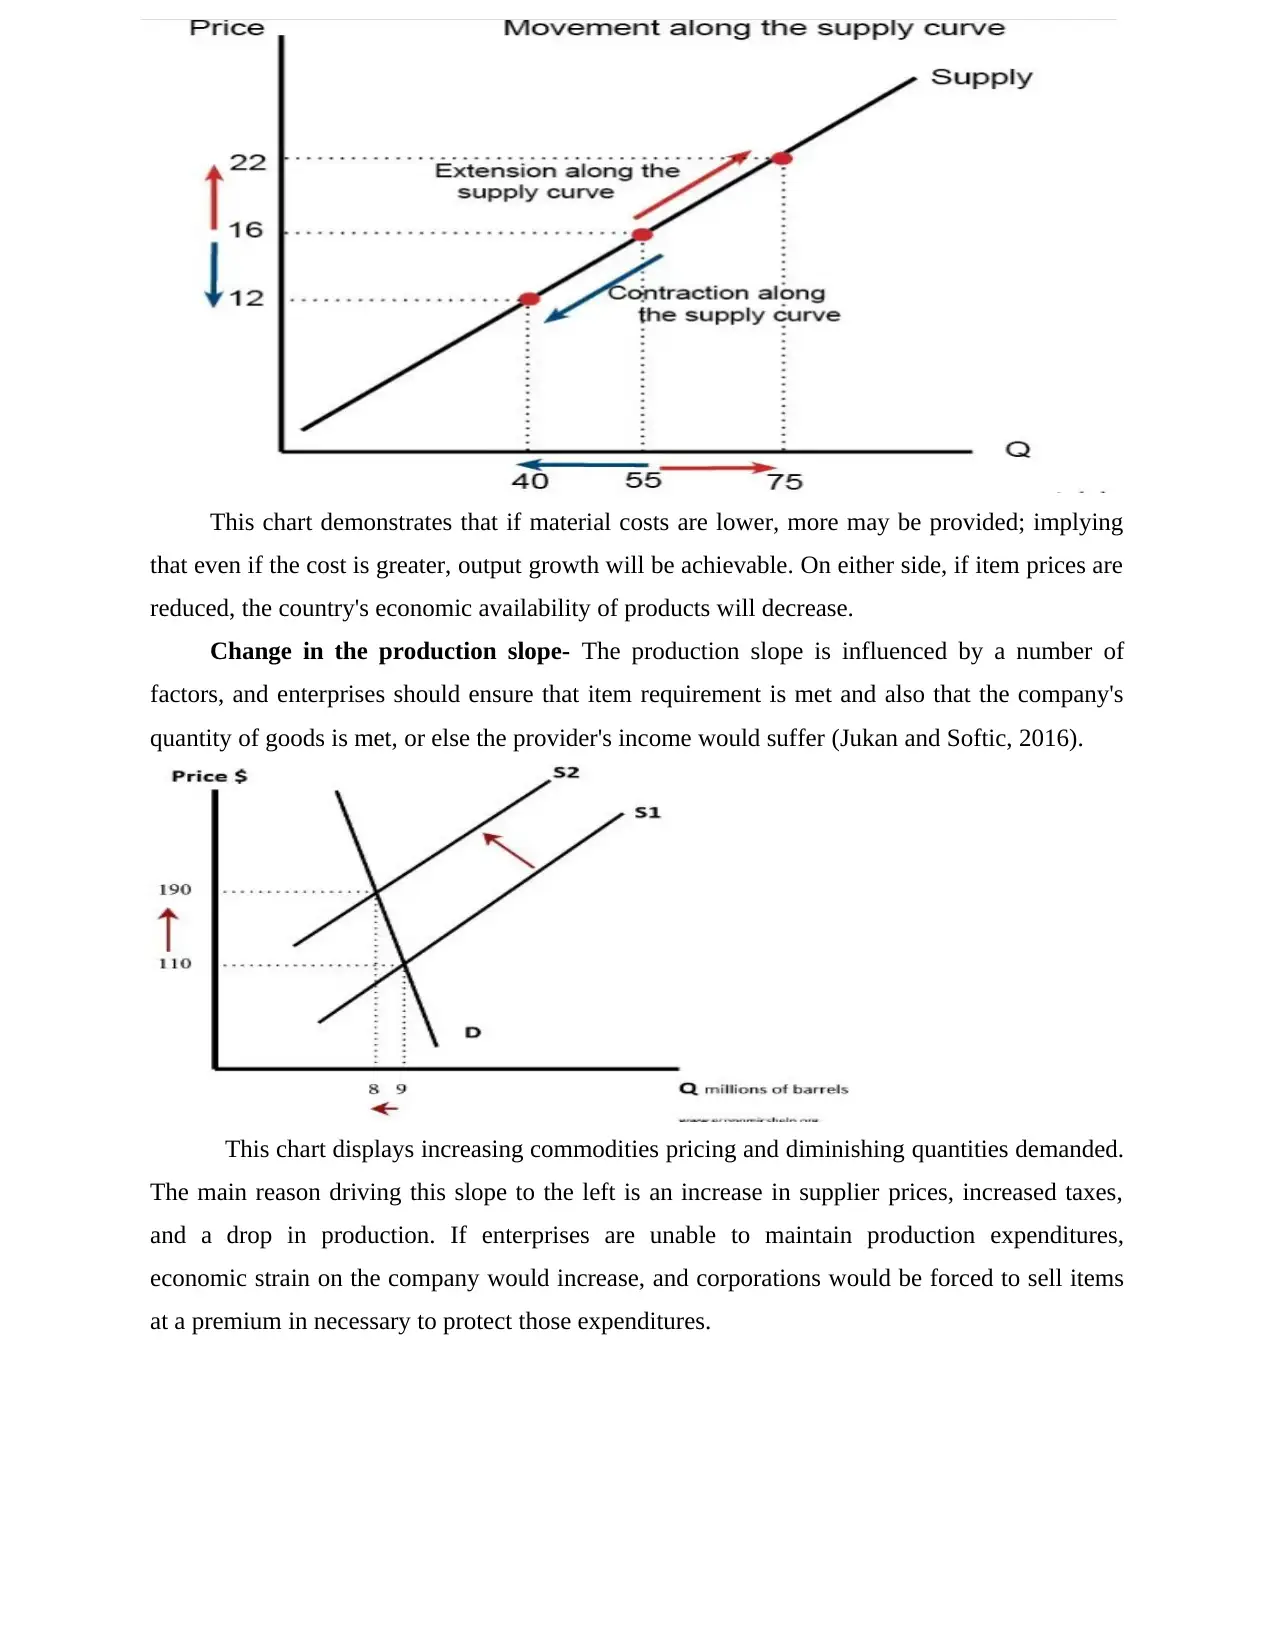
This chart demonstrates that if material costs are lower, more may be provided; implying
that even if the cost is greater, output growth will be achievable. On either side, if item prices are
reduced, the country's economic availability of products will decrease.
Change in the production slope- The production slope is influenced by a number of
factors, and enterprises should ensure that item requirement is met and also that the company's
quantity of goods is met, or else the provider's income would suffer (Jukan and Softic, 2016).
This chart displays increasing commodities pricing and diminishing quantities demanded.
The main reason driving this slope to the left is an increase in supplier prices, increased taxes,
and a drop in production. If enterprises are unable to maintain production expenditures,
economic strain on the company would increase, and corporations would be forced to sell items
at a premium in necessary to protect those expenditures.
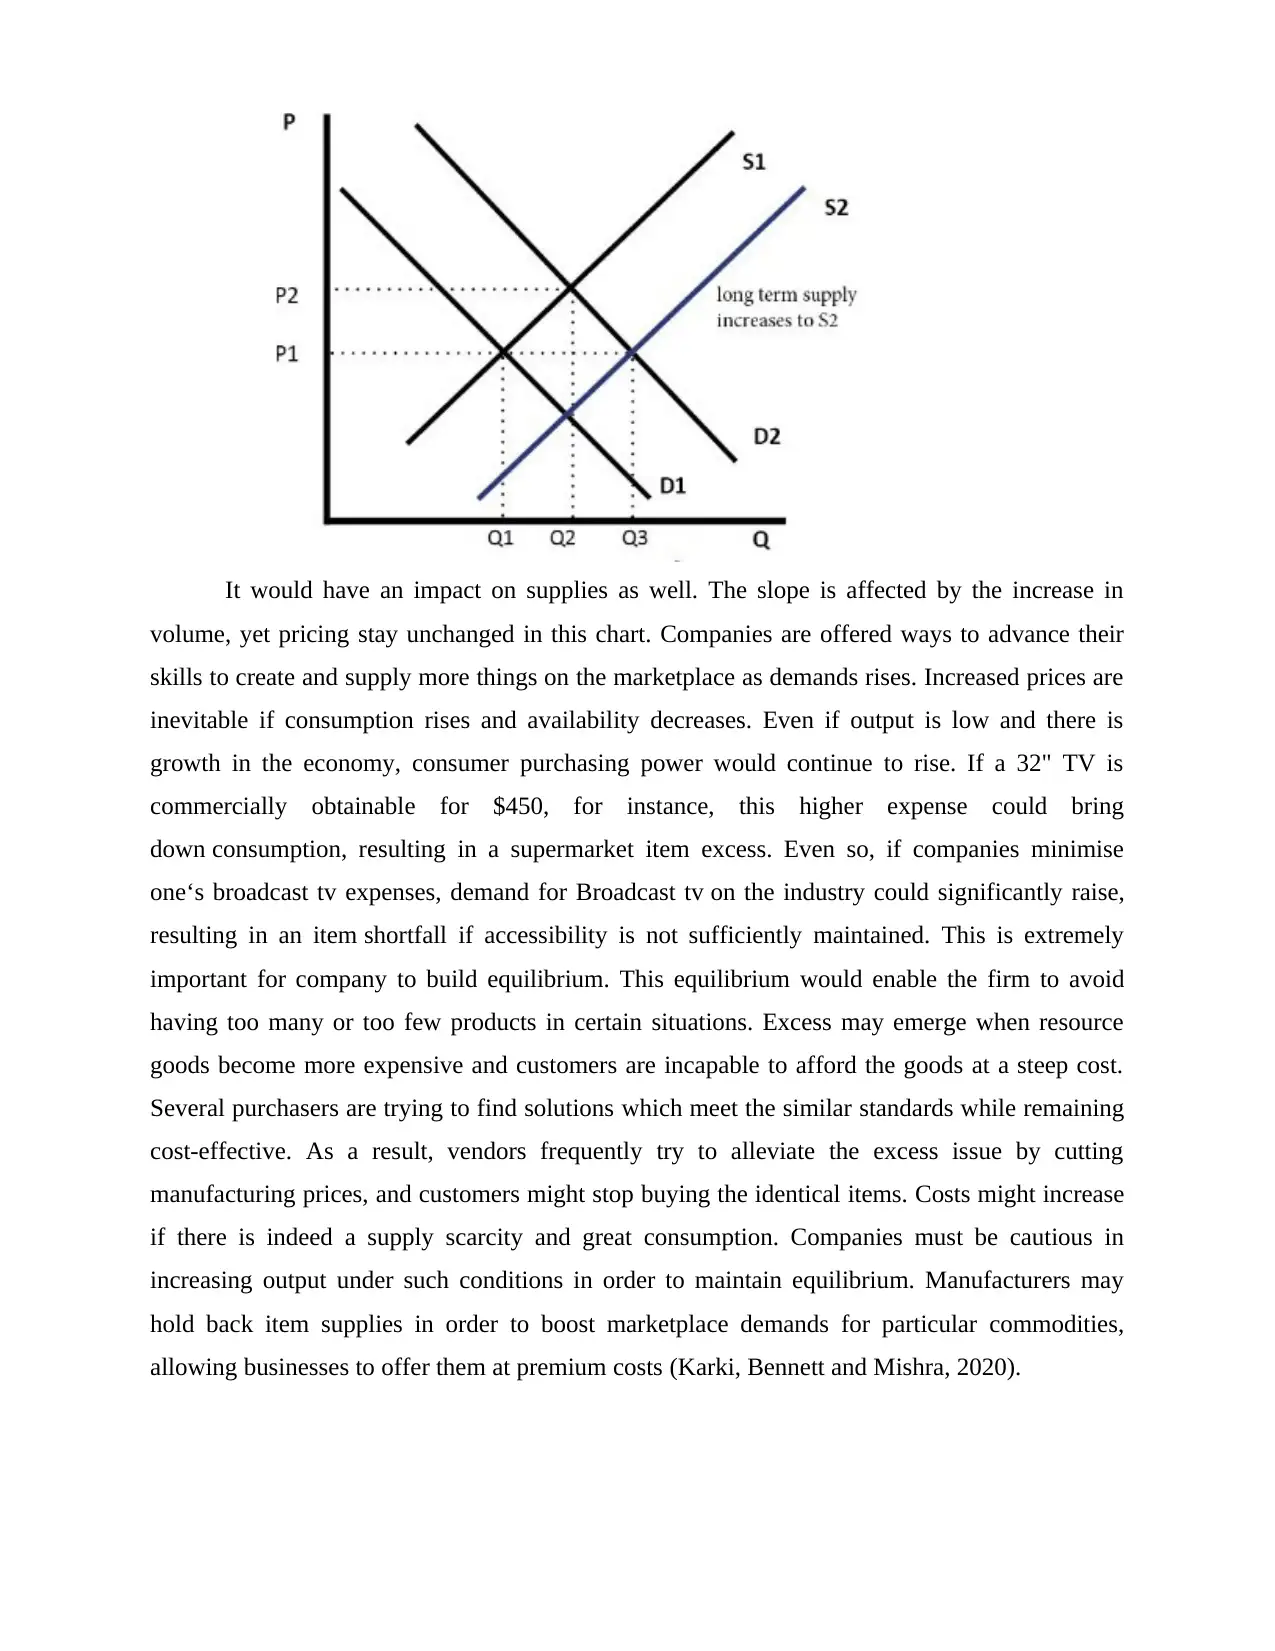
It would have an impact on supplies as well. The slope is affected by the increase in
volume, yet pricing stay unchanged in this chart. Companies are offered ways to advance their
skills to create and supply more things on the marketplace as demands rises. Increased prices are
inevitable if consumption rises and availability decreases. Even if output is low and there is
growth in the economy, consumer purchasing power would continue to rise. If a 32" TV is
commercially obtainable for $450, for instance, this higher expense could bring
down consumption, resulting in a supermarket item excess. Even so, if companies minimise
one‘s broadcast tv expenses, demand for Broadcast tv on the industry could significantly raise,
resulting in an item shortfall if accessibility is not sufficiently maintained. This is extremely
important for company to build equilibrium. This equilibrium would enable the firm to avoid
having too many or too few products in certain situations. Excess may emerge when resource
goods become more expensive and customers are incapable to afford the goods at a steep cost.
Several purchasers are trying to find solutions which meet the similar standards while remaining
cost-effective. As a result, vendors frequently try to alleviate the excess issue by cutting
manufacturing prices, and customers might stop buying the identical items. Costs might increase
if there is indeed a supply scarcity and great consumption. Companies must be cautious in
increasing output under such conditions in order to maintain equilibrium. Manufacturers may
hold back item supplies in order to boost marketplace demands for particular commodities,
allowing businesses to offer them at premium costs (Karki, Bennett and Mishra, 2020).
⊘ This is a preview!⊘
Do you want full access?
Subscribe today to unlock all pages.
Trusted by 1+ million students worldwide
TASK 2
Evaluate and contrasting new ideas and concepts in 21st-century economy with
concepts from the previous centuries, and link them to current corporate practices
The twentieth-century neoliberal economics strategy was more concerned with goods and
income. The consumption and supplied slope identify various factors, which include items,
production, and wealth inequality. It is considered as a more comprehensive strategy that places
a higher focus on wealth inequality in perspective of commodity expenditure. Poor
competitiveness was brought to the industry at the same moment as a standard neoliberal
method. This indicates that profitable limited assets are efficiently managed. This will necessitate
a significant rise in cash and the expansion of item manufacturing in order to attain massive
economic achievement. This neoliberal concept combines with conventional manufacturing price
theoretical framework, demonstrating that increasing productivity is the goal. Traditional
economics concept states that production costs would determine product price, while neo-
classical macroeconomic concept places a greater emphasis on consumption. Several estimates
are taken in neoliberal economics theories; like that consumers would select a reasonable choice
among outcomes and goods. Companies are constantly searching to buy things that will benefit
themselves the most in effort to optimize their profits (Souza-Monteiro and Hooker, 2017).
People take utilization of industry information in their own way. This neoliberal economics
method demonstrates that long-term consumption growth encourages commodities supplier
extension. To effectively leveraged investment, the economic equilibrium must be preserved,
with the administration always striving to enhance it. This strategy discusses the items' utility
and marginalism. The usefulness of the items is highly dependent on client satisfaction with the
firm's specific items and offerings.
In the twentieth decade, economics dedicated more emphasis to sociological. In designed
to steer production, Keynesian macroeconomic philosophy of the twenty-first era argues that
consumption must rise. Consumers' desire to spend is considered as a key factor in the country's
economic improvement. As a result, economic incentive would be boosted by increased
government spending (Towse and Hernández, 2020). Consumers' earnings may rise, and items
might be purchased in greater numbers, in terms of raising governmental spending on major
building and transportation growth. This would help to meet requirements. According to this
hypothesis, inflexible capitalist would improve competitive marketplaces, allowing independent
Paraphrase This Document
Need a fresh take? Get an instant paraphrase of this document with our AI Paraphraser
companies to emphasis mostly on increasing production. Products, environmental assets, and
employment are the emphasis of this philosophy. This idea can be used by individual firms to
increase their competitive desirability. Traditional macroeconomic thought places a greater
emphasis on regulatory constraints. This ensures that the budgeting and indebtedness are both in
good shape. Independent enterprises would increase their capital if the administration invests
greater than they do. Increasing employment prospects in the nation are aided by governmental
spending. Consumers would be available to acquire additional goods when there are enough
work possibilities, which would help to meet the industry's expanding need. Traditional
economics concept concentrates on increasing economical productivity in attempt to strengthen
the economics growth of the nation, whereas Keynesian financial concept concentrates on
governmental spending. Keynesian’s macroeconomic concept depicts the state helping in
employment development, whereas traditional philosophy suggests that the state's role must be
limited. The corporation might utilise such concepts to regulate pricing, demand, and supplies.
Businesses can understand about customers' actual ability and develop a price-supply
equilibrium for performance measurement by applying such macroeconomic concepts (Yunus,
2017).
CONCLUSION
The preceding study demonstrates that consumption and supplies are two fundamental
socioeconomic concepts, and it is critical to maintain the firm's equilibrium in need to obtain
significant profitability. If costs fluctuate, this would affect consuming since purchasers would
not want to invest cash upon those costly goods; yet, if costs decrease, the demand or supplied
slope might alter since consumers' interests within those goods would rise.
REFERENCES
Books and journals
Babic-Hodovic, V., Arslanagic-Kalajdzic, M. and Imsirpasic, A., 2017. Perceived quality and
corporate image in mobile services: the role of technical and functional quality. South
East European Journal of Economics and Business, 12(1), pp.114-125.
Cavicchioli, D., 2018. Detecting Market Power Along Food Supply Chains: Evidence and
Methodological Insights from the Fluid Milk Sector in Italy. Agriculture, 8(12), p.191.
Chang, A.C. and Hanson, T.J., 2016. The accuracy of forecasts prepared for the Federal Open
Market Committee. Journal of Economics and Business, 83, pp.23-43.
DAO, B.T.T. and NGUYEN, D.P., 2020. Determinants of profitability in commercial banks in
Vietnam, Malaysia and Thailand. The Journal of Asian Finance, Economics, and
Business, 7(4), pp.133-143.
Filimonau, V. and Gherbin, A., 2017. An exploratory study of food waste management practices
in the UK grocery retail sector. Journal of Cleaner Production, 167, pp.1184-1194.
Jukan, M.K. and Softic, A., 2016. Comparative analysis of financial inclusion in developing
regions around the world. Economic Review: Journal of Economics and Business, 14(2),
pp.56-65.
Karki, S.T., Bennett, A.C. and Mishra, J.L., 2020. Reducing food waste and food insecurity in
the UK: The architecture of surplus food distribution supply chain in addressing the
sustainable development goals (Goal 2 and Goal 12.3) at a city level. Industrial
Marketing Management.
Souza-Monteiro, D. and Hooker, N., 2017. Comparing UK food retailers corporate social
responsibility strategies. British Food Journal.
Towse, R. and Hernández, T.N. eds., 2020. Handbook of cultural economics. Edward Elgar
Publishing.
Yunus, M., 2017. A world of three zeros: the new economics of zero poverty, zero
unemployment, and zero net carbon emissions. Hachette UK.
⊘ This is a preview!⊘
Do you want full access?
Subscribe today to unlock all pages.
Trusted by 1+ million students worldwide
1 out of 12
Related Documents


Your All-in-One AI-Powered Toolkit for Academic Success.
+13062052269
info@desklib.com
Available 24*7 on WhatsApp / Email
![[object Object]](/_next/static/media/star-bottom.7253800d.svg)
Unlock your academic potential
Copyright © 2020–2026 A2Z Services. All Rights Reserved. Developed and managed by ZUCOL.