Business Economics Assignment: Factors Driving Land Price Increase
VerifiedAdded on 2023/01/20
|14
|2764
|24
Homework Assignment
AI Summary
This economics assignment analyzes the rising land prices in Australian metropolitan cities, particularly focusing on Darwin, Sydney, and Melbourne. The assignment addresses the reasons behind soaring land prices, including rising demand and population growth, and examines the major drivers of house price increases, especially within Central Business Districts (CBDs). It employs economic theory to explain the fluctuations in land prices using demand and supply diagrams, illustrating the impact of increased demand on equilibrium prices. Furthermore, the assignment delves into the elasticity of land supply, concluding that land supply is perfectly inelastic, which significantly influences the soaring housing land prices. The analysis includes relevant figures and diagrams to support the arguments, providing a comprehensive understanding of the economic factors at play in the Australian housing market.
Running head: BUSINESS ECONOMICS
Business Economics
Name of the Student
Name of the University
Course ID
Business Economics
Name of the Student
Name of the University
Course ID
Paraphrase This Document
Need a fresh take? Get an instant paraphrase of this document with our AI Paraphraser
1BUSINESS ECONOMICS
Table of Contents
Question a........................................................................................................................................2
Reasons for soaring land prices in Australia...............................................................................2
Major drivers of soaring house price...........................................................................................4
Question b........................................................................................................................................6
Question c........................................................................................................................................8
Elasticity of land supply..............................................................................................................8
References......................................................................................................................................12
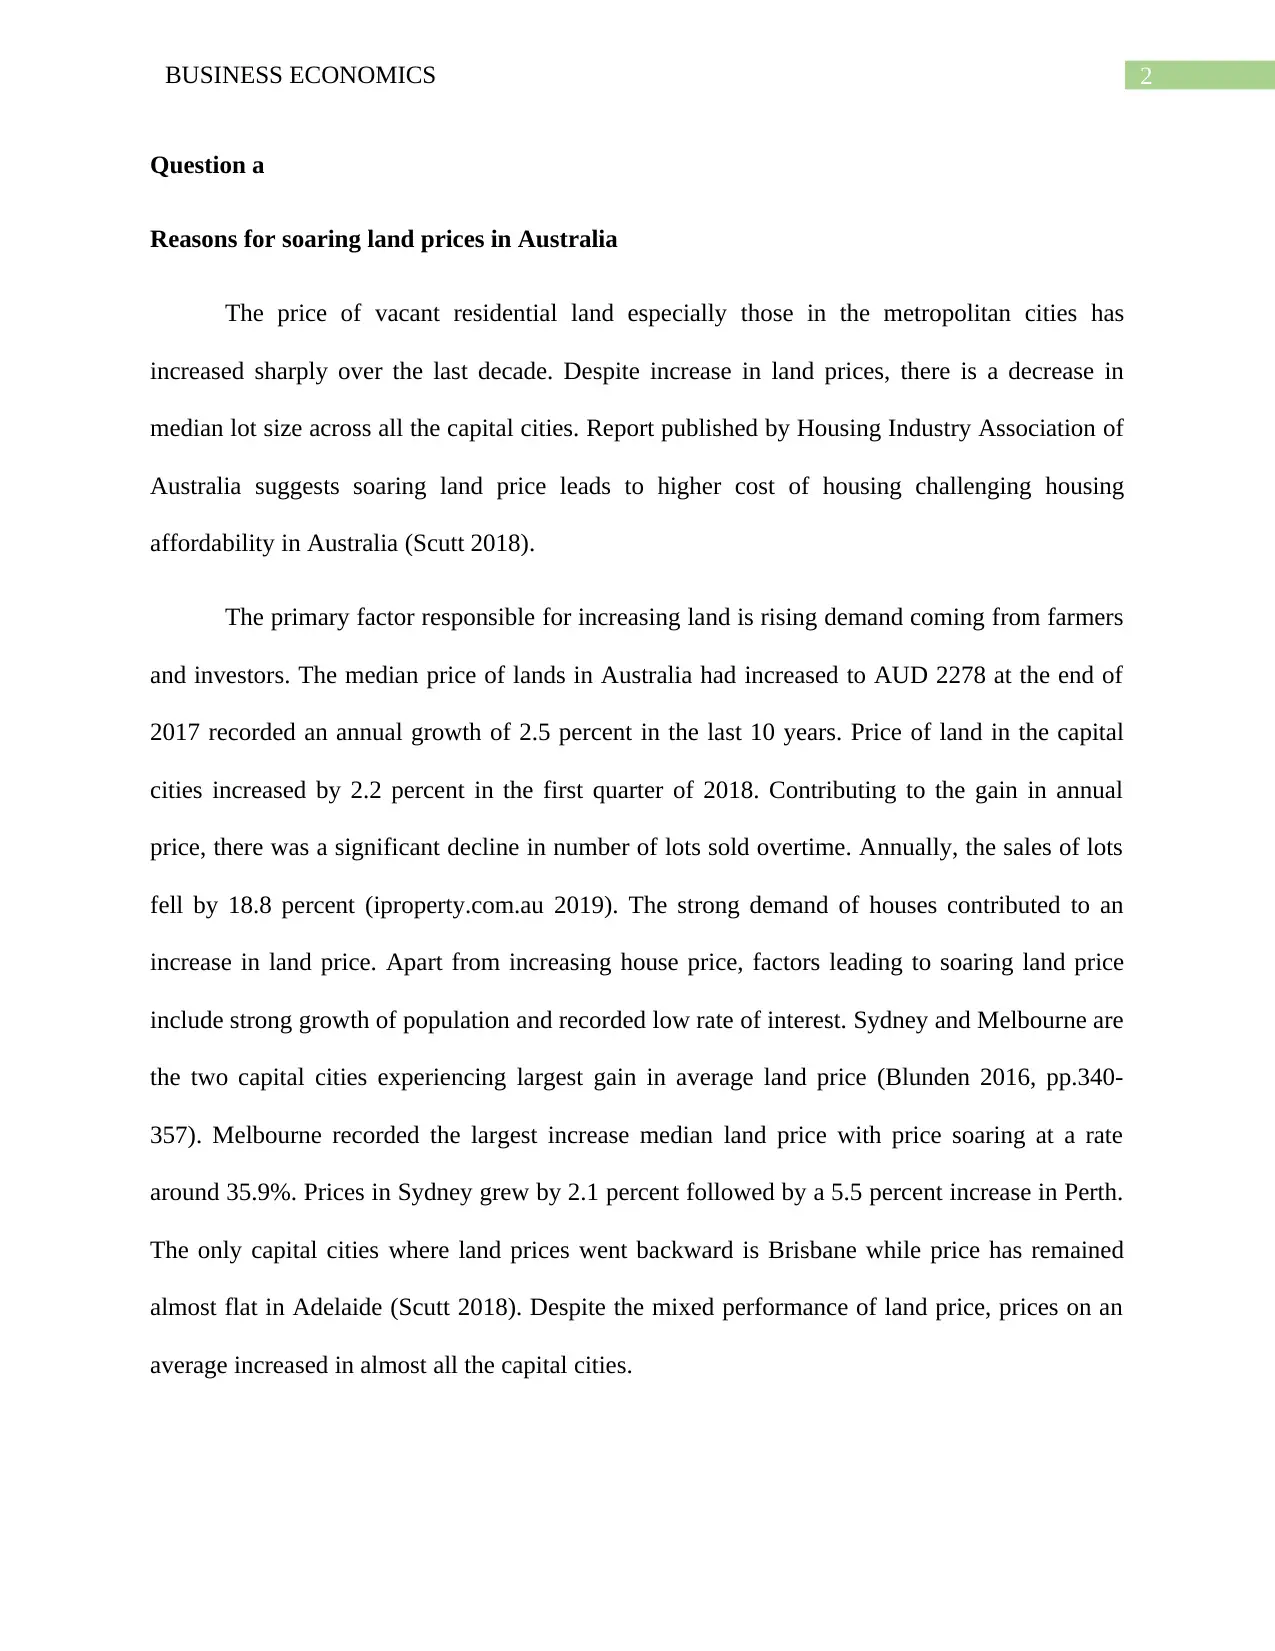
2BUSINESS ECONOMICS
Question a
Reasons for soaring land prices in Australia
The price of vacant residential land especially those in the metropolitan cities has
increased sharply over the last decade. Despite increase in land prices, there is a decrease in
median lot size across all the capital cities. Report published by Housing Industry Association of
Australia suggests soaring land price leads to higher cost of housing challenging housing
affordability in Australia (Scutt 2018).
The primary factor responsible for increasing land is rising demand coming from farmers
and investors. The median price of lands in Australia had increased to AUD 2278 at the end of
2017 recorded an annual growth of 2.5 percent in the last 10 years. Price of land in the capital
cities increased by 2.2 percent in the first quarter of 2018. Contributing to the gain in annual
price, there was a significant decline in number of lots sold overtime. Annually, the sales of lots
fell by 18.8 percent (iproperty.com.au 2019). The strong demand of houses contributed to an
increase in land price. Apart from increasing house price, factors leading to soaring land price
include strong growth of population and recorded low rate of interest. Sydney and Melbourne are
the two capital cities experiencing largest gain in average land price (Blunden 2016, pp.340-
357). Melbourne recorded the largest increase median land price with price soaring at a rate
around 35.9%. Prices in Sydney grew by 2.1 percent followed by a 5.5 percent increase in Perth.
The only capital cities where land prices went backward is Brisbane while price has remained
almost flat in Adelaide (Scutt 2018). Despite the mixed performance of land price, prices on an
average increased in almost all the capital cities.
⊘ This is a preview!⊘
Do you want full access?
Subscribe today to unlock all pages.
Trusted by 1+ million students worldwide
3BUSINESS ECONOMICS
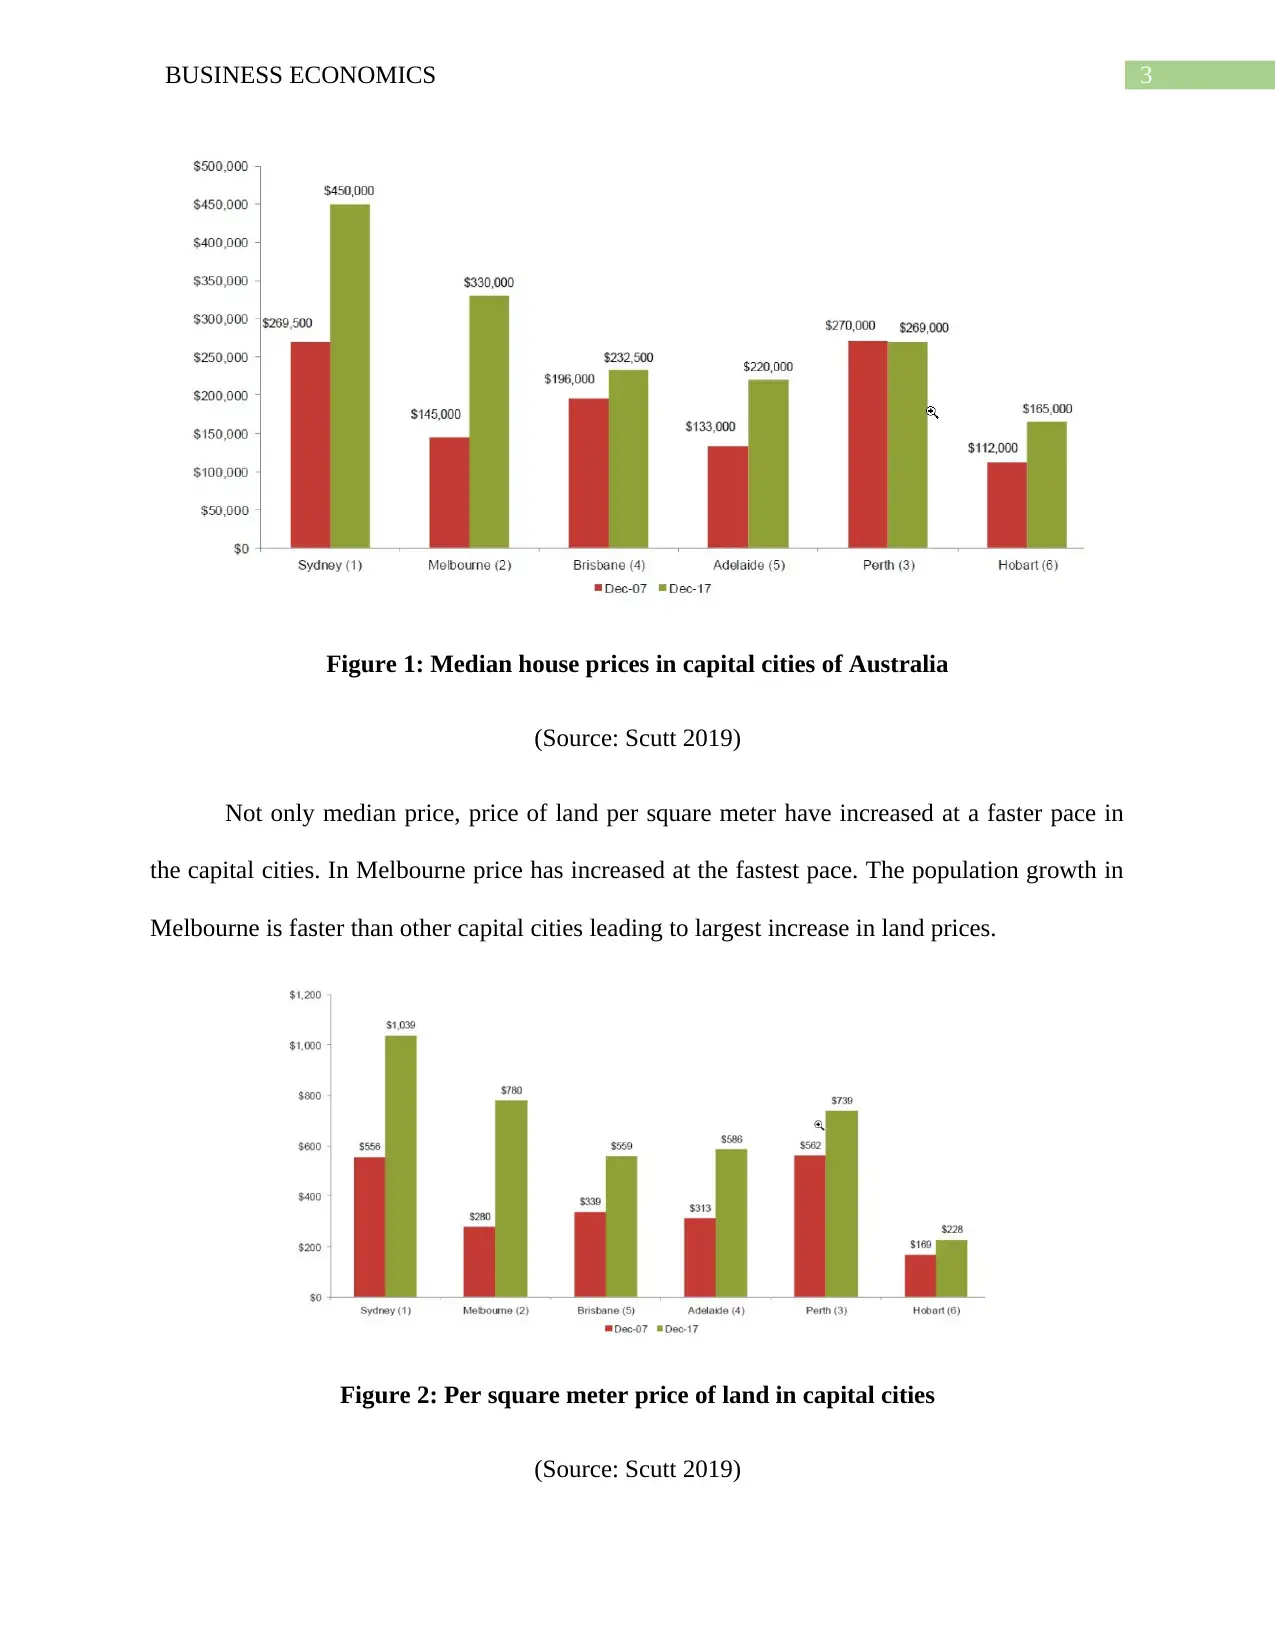
Figure 1: Median house prices in capital cities of Australia
(Source: Scutt 2019)
Not only median price, price of land per square meter have increased at a faster pace in
the capital cities. In Melbourne price has increased at the fastest pace. The population growth in
Melbourne is faster than other capital cities leading to largest increase in land prices.
Figure 2: Per square meter price of land in capital cities
(Source: Scutt 2019)
Paraphrase This Document
Need a fresh take? Get an instant paraphrase of this document with our AI Paraphraser
4BUSINESS ECONOMICS
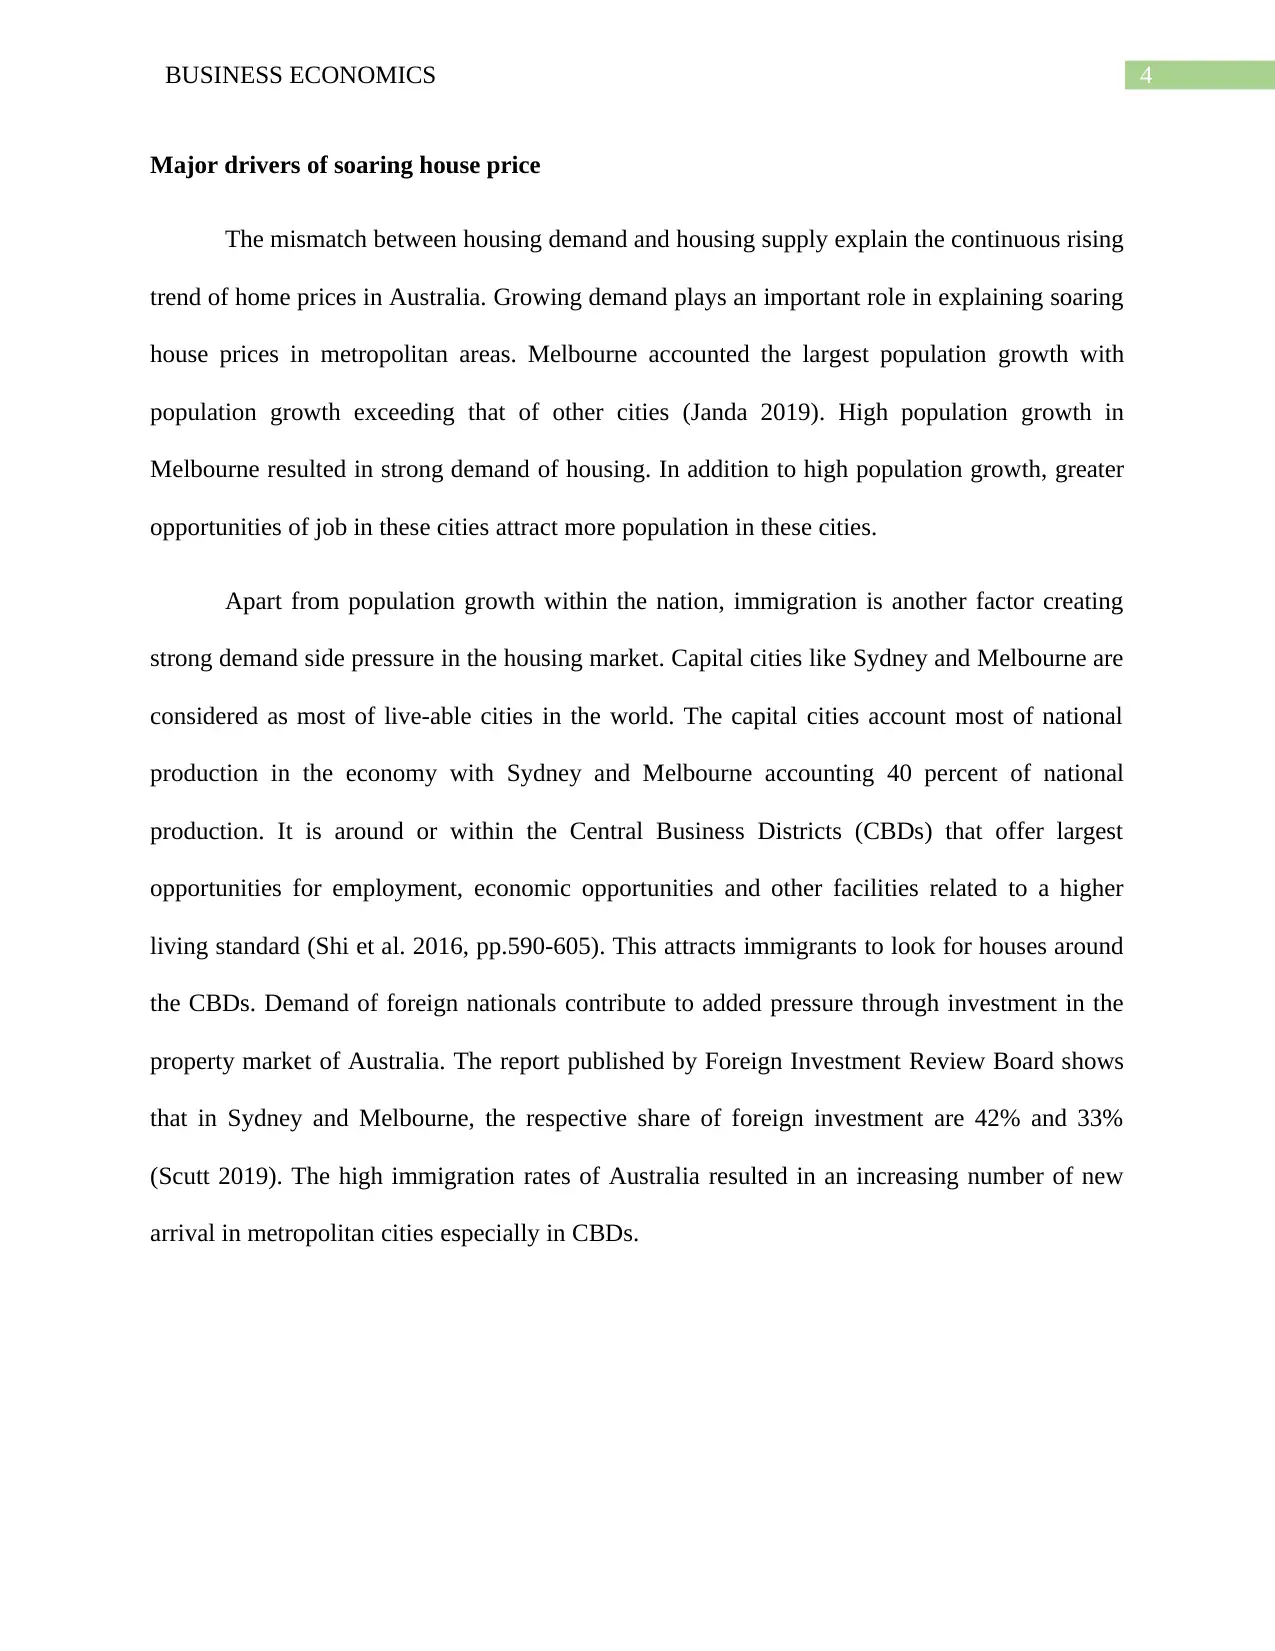
Major drivers of soaring house price
The mismatch between housing demand and housing supply explain the continuous rising
trend of home prices in Australia. Growing demand plays an important role in explaining soaring
house prices in metropolitan areas. Melbourne accounted the largest population growth with
population growth exceeding that of other cities (Janda 2019). High population growth in
Melbourne resulted in strong demand of housing. In addition to high population growth, greater
opportunities of job in these cities attract more population in these cities.
Apart from population growth within the nation, immigration is another factor creating
strong demand side pressure in the housing market. Capital cities like Sydney and Melbourne are
considered as most of live-able cities in the world. The capital cities account most of national
production in the economy with Sydney and Melbourne accounting 40 percent of national
production. It is around or within the Central Business Districts (CBDs) that offer largest
opportunities for employment, economic opportunities and other facilities related to a higher
living standard (Shi et al. 2016, pp.590-605). This attracts immigrants to look for houses around
the CBDs. Demand of foreign nationals contribute to added pressure through investment in the
property market of Australia. The report published by Foreign Investment Review Board shows
that in Sydney and Melbourne, the respective share of foreign investment are 42% and 33%
(Scutt 2019). The high immigration rates of Australia resulted in an increasing number of new
arrival in metropolitan cities especially in CBDs.
5BUSINESS ECONOMICS
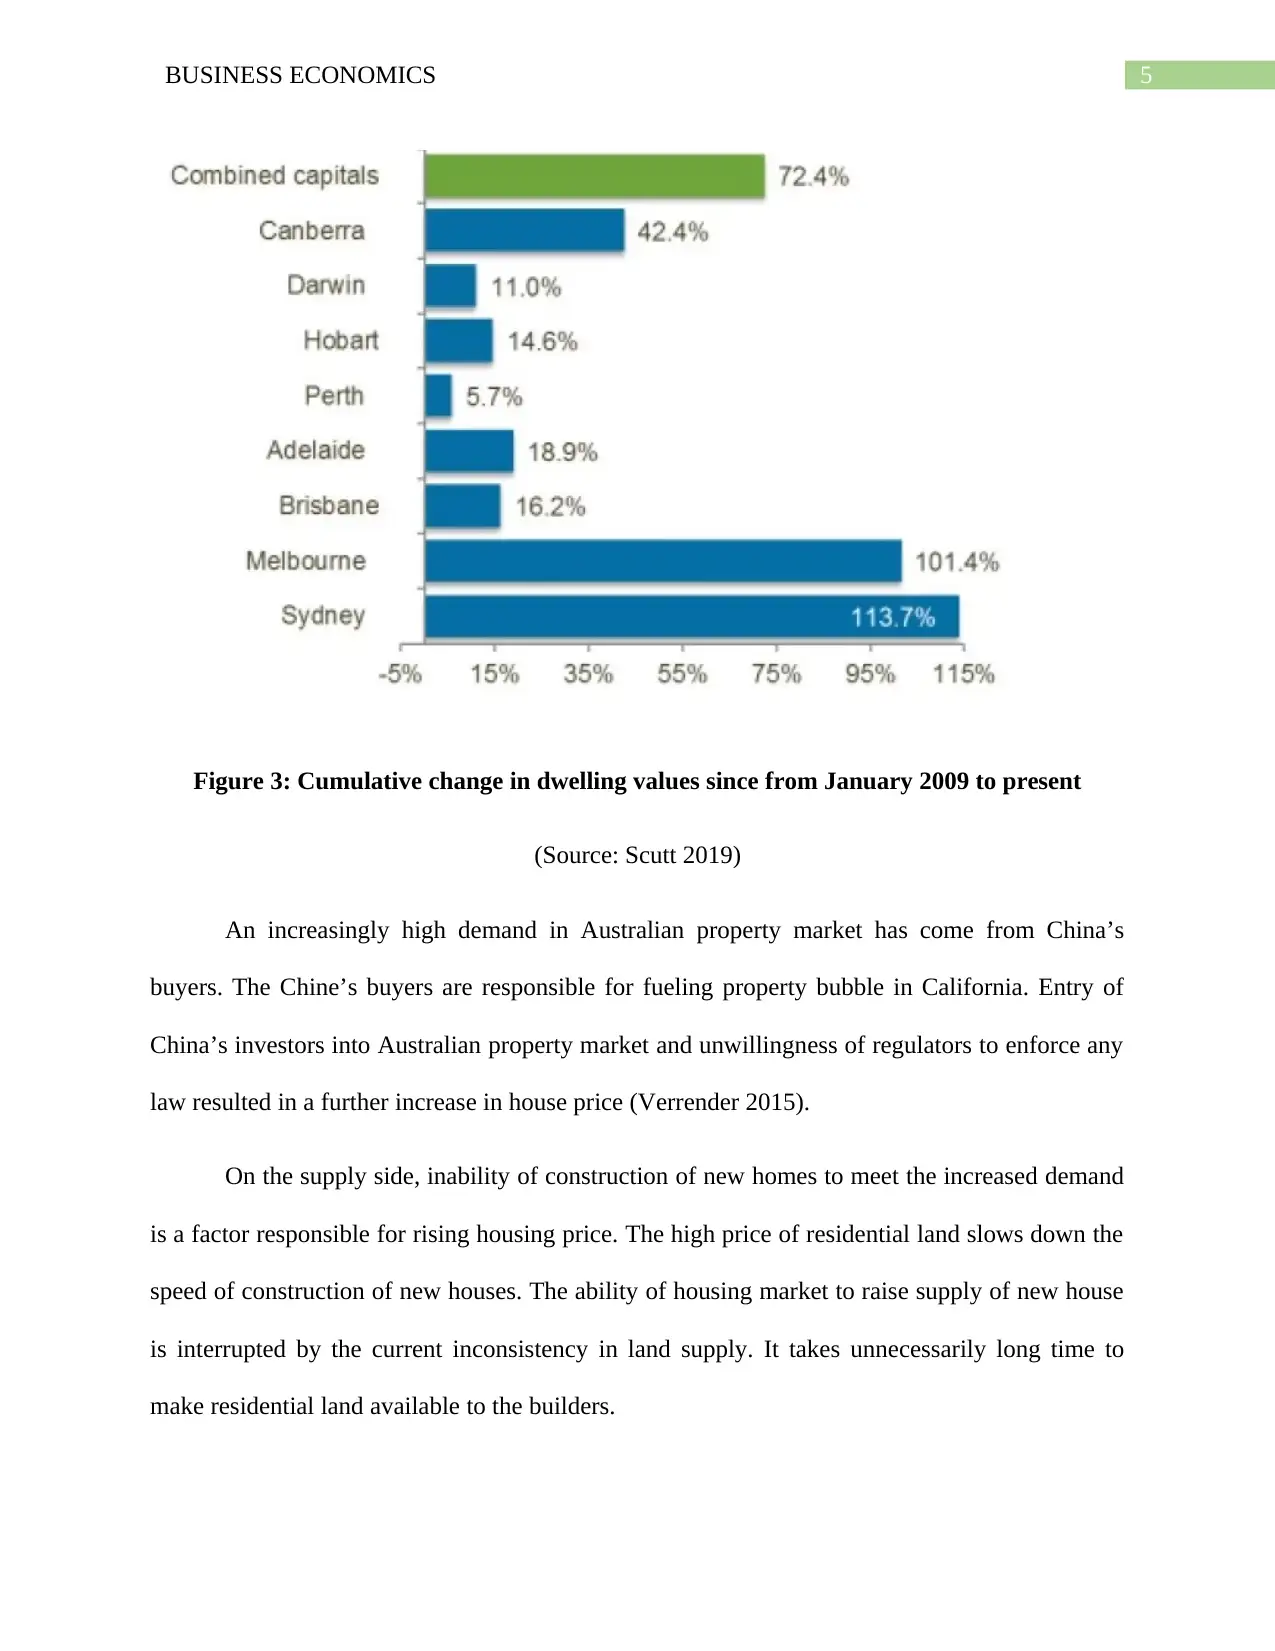
Figure 3: Cumulative change in dwelling values since from January 2009 to present
(Source: Scutt 2019)
An increasingly high demand in Australian property market has come from China’s
buyers. The Chine’s buyers are responsible for fueling property bubble in California. Entry of
China’s investors into Australian property market and unwillingness of regulators to enforce any
law resulted in a further increase in house price (Verrender 2015).
On the supply side, inability of construction of new homes to meet the increased demand
is a factor responsible for rising housing price. The high price of residential land slows down the
speed of construction of new houses. The ability of housing market to raise supply of new house
is interrupted by the current inconsistency in land supply. It takes unnecessarily long time to
make residential land available to the builders.
⊘ This is a preview!⊘
Do you want full access?
Subscribe today to unlock all pages.
Trusted by 1+ million students worldwide
6BUSINESS ECONOMICS
The rising demand of houses in these cities along with a slowdown in housing
construction are together responsible for rapidly increasing housing price over the last decade.
Question b
The economic theory suggests that demand and supply of a particular commodity
depends on the condition of demand and supply of the particular commodity. Demand and
supply determine the equilibrium in the market and associated equilibrium price and quantity.
Change in the dynamics of demand and supply leads to a change in equilibrium bringing a
change in equilibrium price and quantity (Mankiw, Taylor & Andrew 2016). The fluctuation in
land price in metropolitan cities of Australia is explained by the changing condition of demand
and supply. The demand for land in metropolitan areas are growing at a faster pace. A number
of different factors has attributed increase in demand for land. The first important factor is rising
home price. Supply of land is an important determinant of housing supply. More the availability
of land, larger is the supply of new dwellings. Higher house price encourages constructors to
build new houses. The increased demand from builders’ increase demand for land. Population
growth another important factor that creates pressure on demand for land. Population in the
metropolitan cities are growing at a faster pace. The population growth increases the demand for
houses, which in turns leads to an increase in demand for land. The third factor contributing to an
increase in land demand is the low interest rate. In order to stimulate economic activity, the
Reserve Bank of Australia has set the interest rate to the lowest level. The low rate of mortgage
interest encourages people to take more loans. Property market is an attractive area of
investment. Low mortgage interest rate by making loans available at a cheaper rate further
creates a pressure on land demand (Yates 2016, pp.328-339). Increase in demand for land given
Paraphrase This Document
Need a fresh take? Get an instant paraphrase of this document with our AI Paraphraser
7BUSINESS ECONOMICS
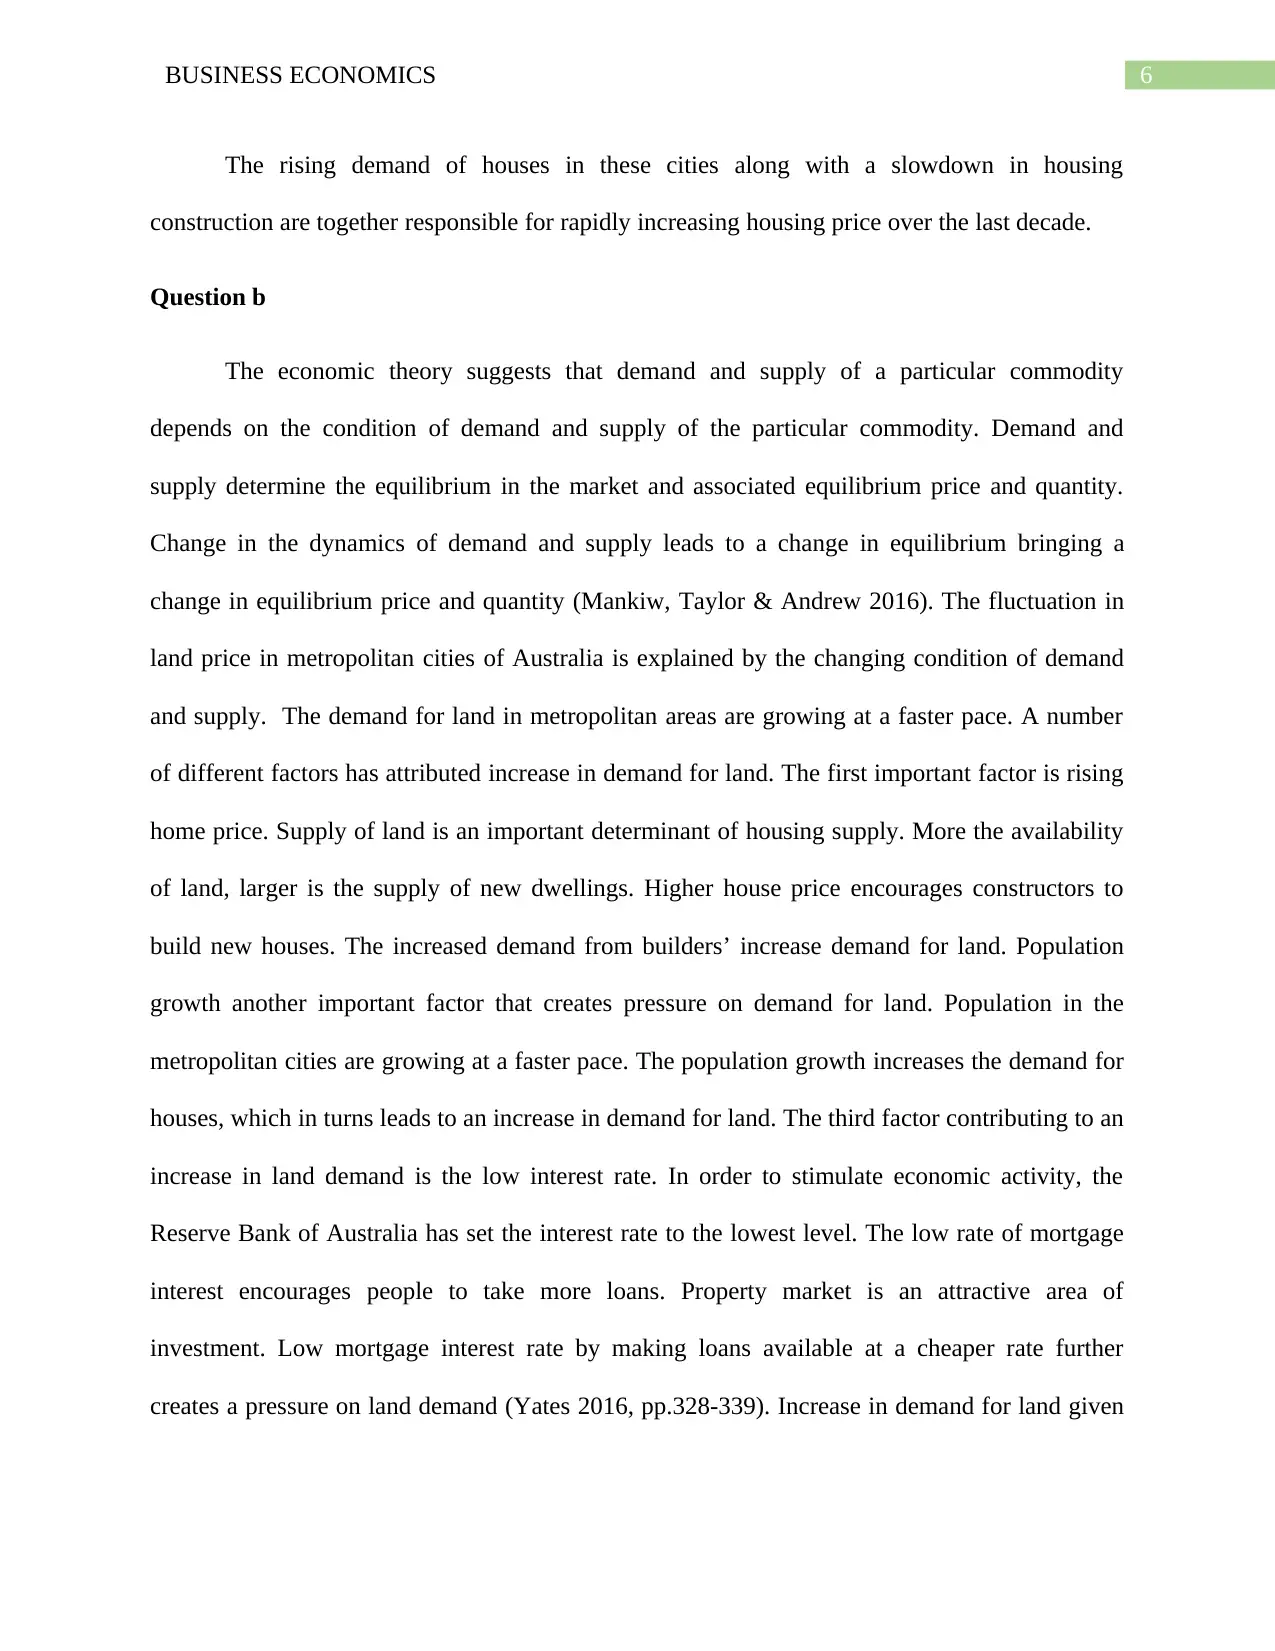
the supply pushes land prices upward. The figure explains soaring land price using demand and
supply framework.
Figure 3: Effect of increased demand on land price
(as created by Author)
In the above figure, the demand and supply of land is given as DD and SS respectively.
Equilibrium in the market is at E, corresponding to the point where land demand and supply
curve intersect. Corresponding to the equilibrium, the equilibrium price of land is P* and
equilibrium quantity of land is Q*. Now, consider the impact of an increased demand for land
due to various factors such as increase in housing demand, population growth and low mortgage
interest rate. Increase in demand for land causes a rightward shift in the demand curve from DD
to D1D1. Given the supply of land, increase in demand for land creates a shortage of land in the
8BUSINESS ECONOMICS
market (Kreps 2019). With the new demand curve, equilibrium in the market shifts from E to E1.
The presence of land shortage leads to an increase in price of land from P* to P1.
Question c
Elasticity of land supply
Elasticity of supply captures the relative responsiveness of supply of a particular good or
services for an associated change in price. It estimates changes in the supply for a given change
in price of the product. Supply is relatively elastic when change in supply is greater than the
associated change in price (Cowell 2018). In ease of relatively inelastic supply change in supply
is relatively less than the corresponding change in price. Two extreme cases of supply elasticity
are perfectly inelastic supply and perfectly elastic supply. For perfectly inelastic supply, supply
remain almost fixed for any changes in price. The elasticity of supply in this case equals to
infinity. Supply is considered as perfectly elastic if infinitely large amount of supply is available
at a given price. Measure of supply elasticity in this case is zero.
Land is one of the important factors of production. The supply of factors plays an
important role in determining price of the factor (McKenzie & Lee 2016). Land is considered as
the original factor or primary factors of production as it land cannot be produced within the
industry. It is a free gift as given by nature. The total quantity of land thus is fixed by the specific
geographical area. It is not possible to increase supply of land in response to higher demand. At
any level of price or rent land supply remain constant. Supply of land to an area thus does not
depend on price or rent charged on its’ use.
Therefore, when considered from the view point of the entire economy, supply of land is
perfectly inelastic in nature as it is a natural resource. As land is a free gift from nature and is not
⊘ This is a preview!⊘
Do you want full access?
Subscribe today to unlock all pages.
Trusted by 1+ million students worldwide
9BUSINESS ECONOMICS
produced by the producer, cost of production of land does not influence supply of land.
However, supply of land for a single use or land available to the particular industry is not fixed
or perfectly inelastic. It is possible to increase supply of land for a particular industry by shifting
land from one use to another (Baumol & Blinder 2015). By giving a higher or attractive price,
land supply for a particular industry can be increased by shifting away land from competitive
use.
The discussion so far suggests that the supply of land in different metropolitan cities is
perfectly inelastic. That is land supply cannot be changed in response to higher price or higher
demand. Each metropolitan city has fixed amount of land available with quantity being fixed by
the respective geographic areas. The perfectly inelastic supply curve is given by a vertical
straight line having a slope equals 0. When supply of a commodity is fixed, any change in
demand only affects the equilibrium price. There is no change in equilibrium quantity (Cowen &
Tabarrok 2015). The perfectly inelastic supply of land is the main reason for soaring housing
land price in metropolitan cities of Australia. Demand for land in metropolitan cities are
increasing for various reasons such as population growth, increasing demand for housing and
others. Now given fixed supply of land, soaring demand creates a huge pressure on land price.
This is shown in the figure below.
Paraphrase This Document
Need a fresh take? Get an instant paraphrase of this document with our AI Paraphraser
10BUSINESS ECONOMICS
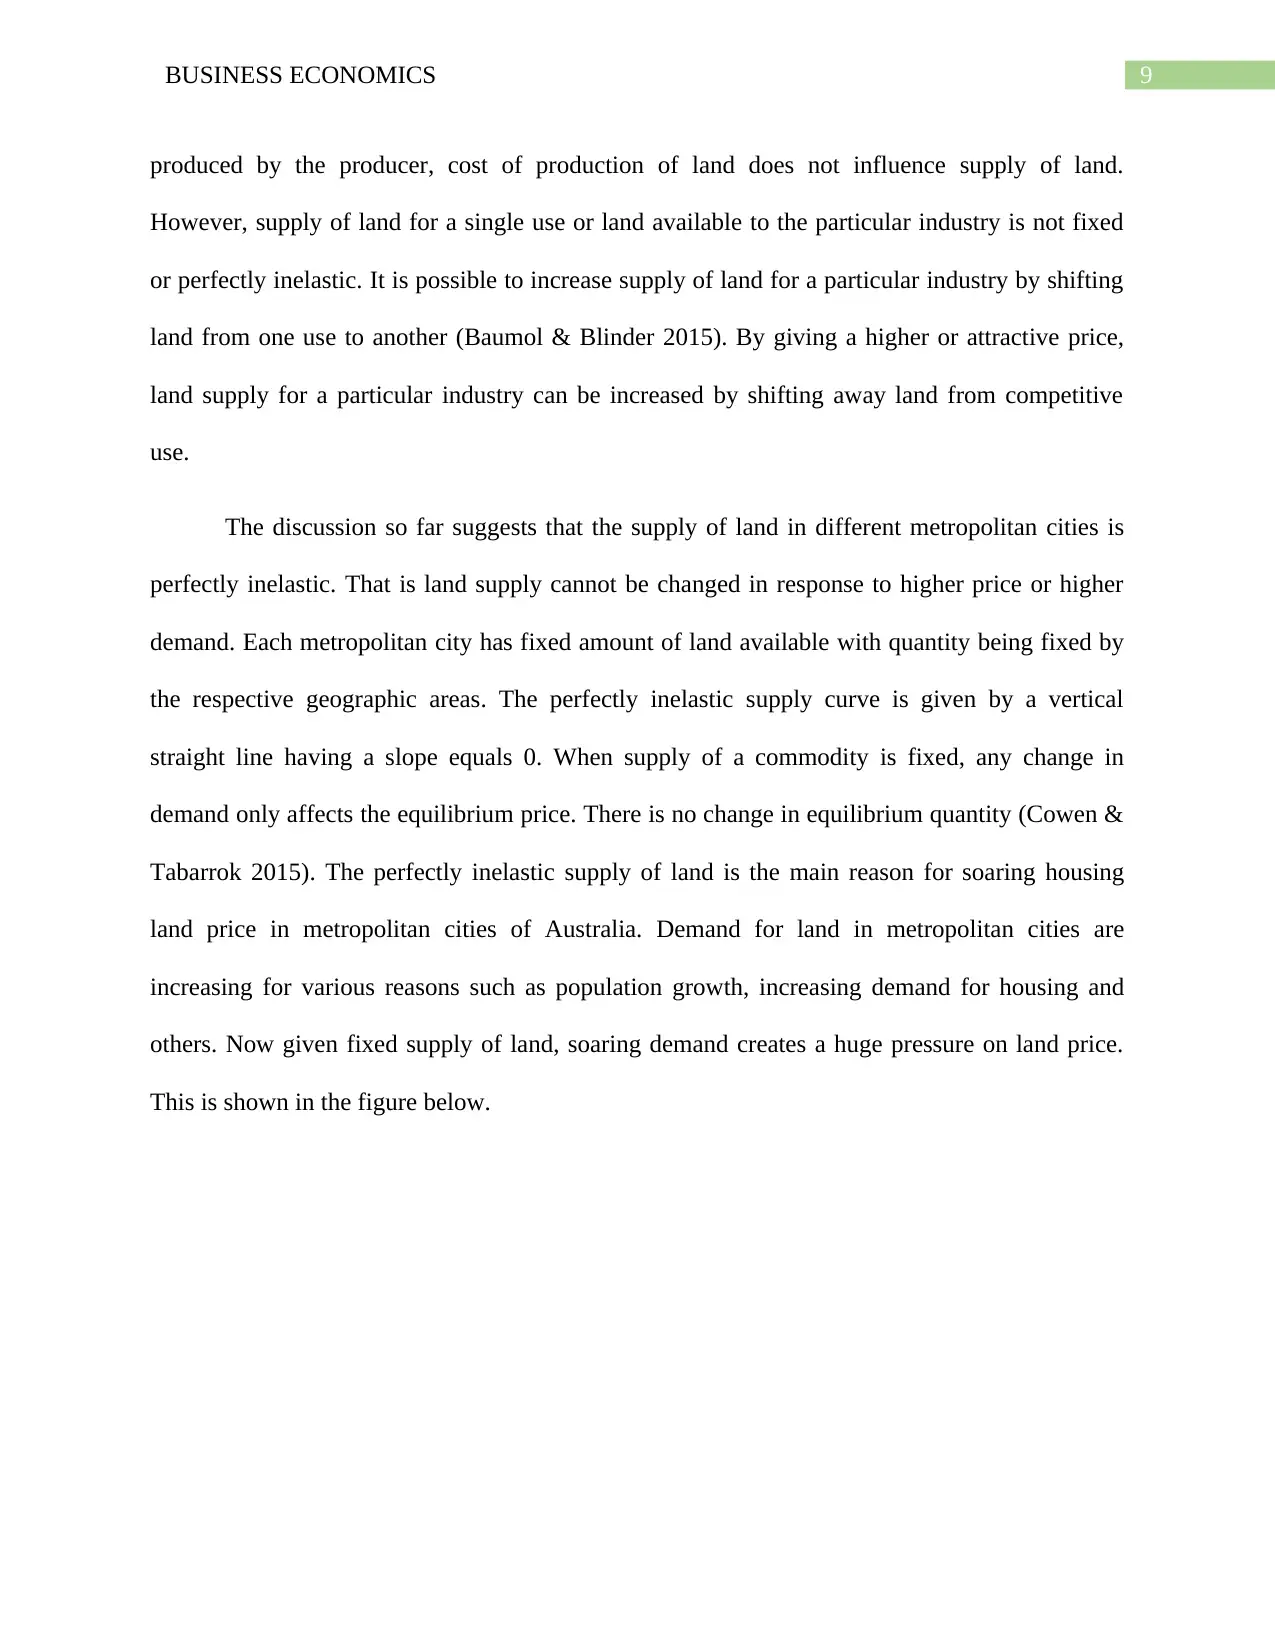
Figure 4: Perfect inelastic supply of land
(as created by author)
In the above figure, the vertical line SS shows the inelastic supply curve. The downward
sloping curve DD shows the demand for land. The initial equilibrium is at E. Corresponding to
the equilibrium, the equilibrium rent is fixed at R* and equilibrium quantity of land is fixed at
Q*. Now, if demand for land increases then the land demand curve will shift to the right. The
new demand curve is D1D1. Equilibrium in the land market shifts from E to E1. This increases
equilibrium rent from R* to R1. The equilibrium quantity of land remains fixed at Q*. An
increase in supply demand for land thus creates a shortage in the market leading to a higher land
price. The growing pressure of demand on land has increased price of land in the metropolitan
cities such as Sydney, Melbourne, Perth, Brisbane and others in the last ten years.
As the supply of land is fixed, an increase in land demand and associated increase in sales
result in a smaller and smaller plot size. The buyers of land in metropolitan areas not only give a
higher price but also get a relatively smaller lot size (Paris 2017). Data shows that median lot
size in capital cities has declined compare to the lot size a decade ago.
11BUSINESS ECONOMICS
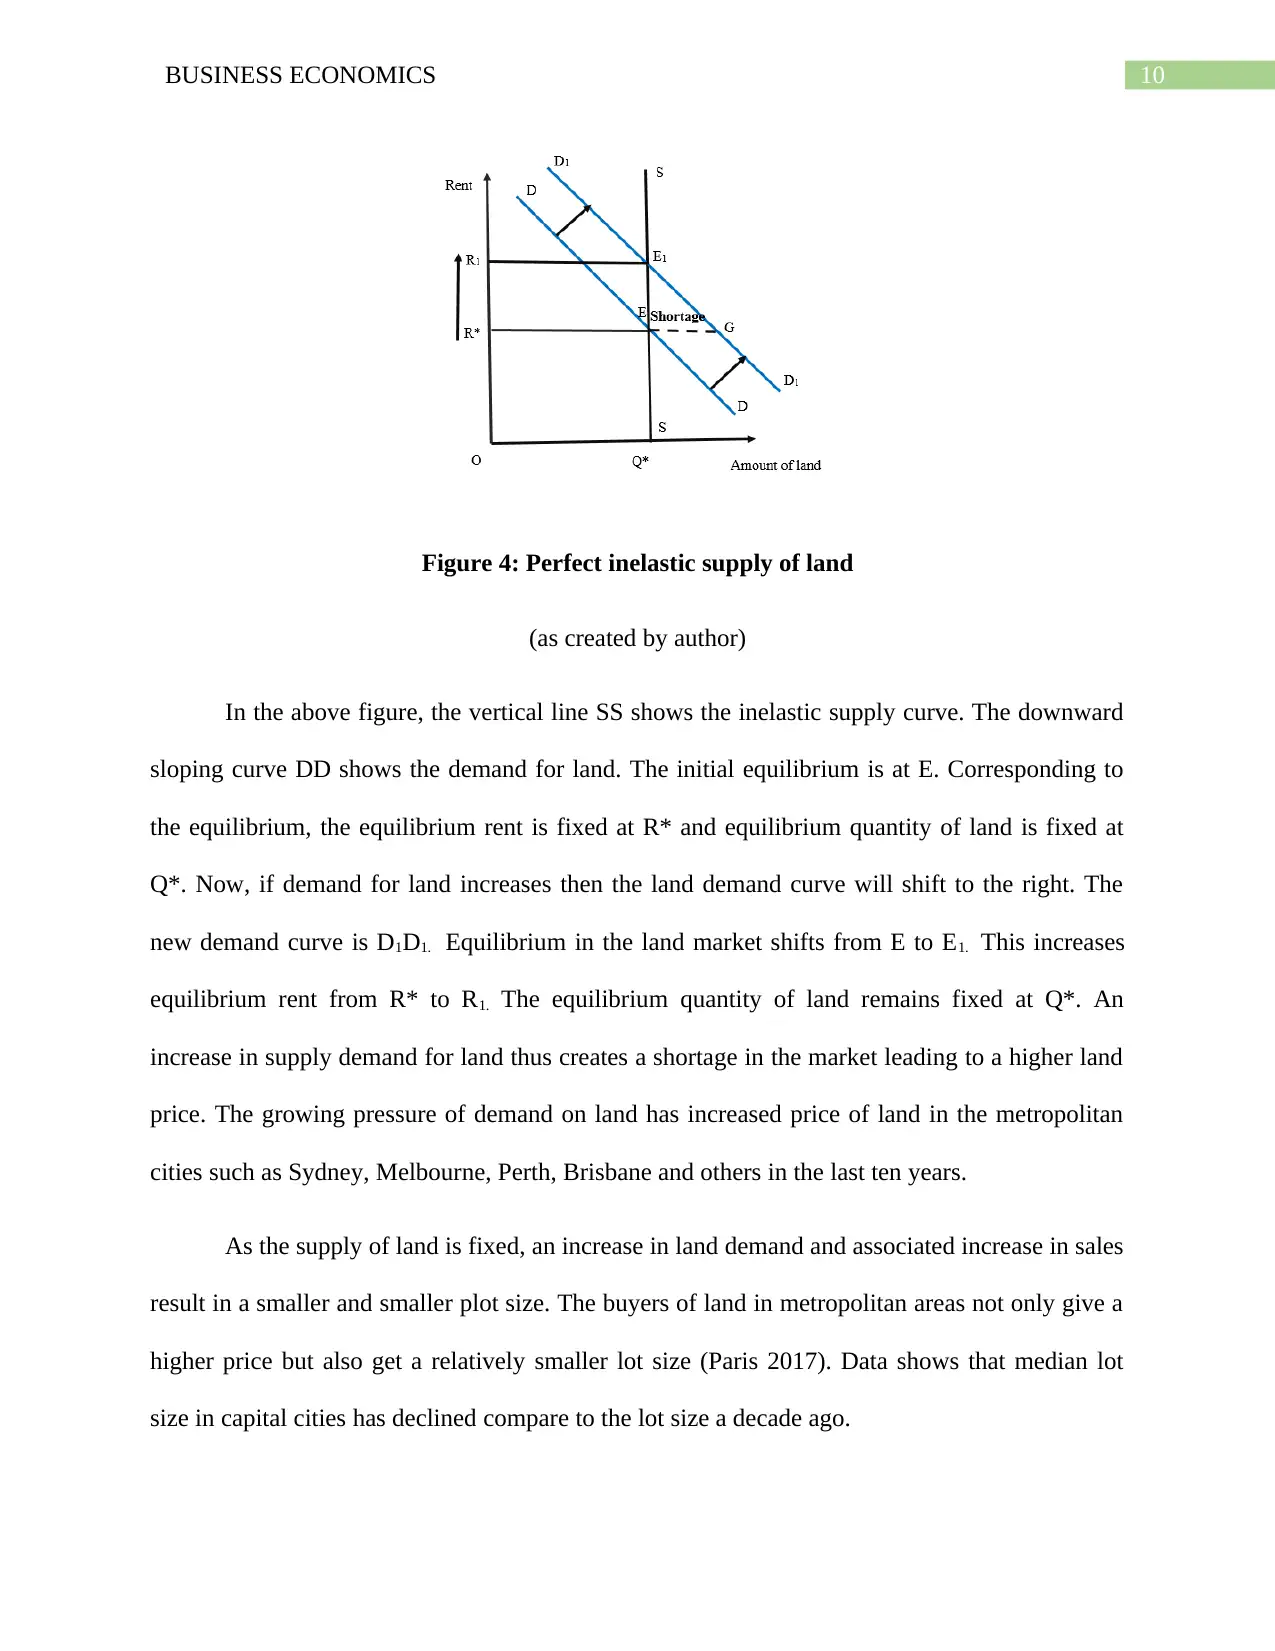
Figure 5: Median lot size in capital cities
(Source: Scutt 2018)
The figure above shows that the lot size has fallen across all the capital cities supporting
the theoretical argument that supply of land is perfectly inelastic.
Figure 5: Median lot size in capital cities
(Source: Scutt 2018)
The figure above shows that the lot size has fallen across all the capital cities supporting
the theoretical argument that supply of land is perfectly inelastic.
⊘ This is a preview!⊘
Do you want full access?
Subscribe today to unlock all pages.
Trusted by 1+ million students worldwide
1 out of 14
Related Documents


Your All-in-One AI-Powered Toolkit for Academic Success.
+13062052269
info@desklib.com
Available 24*7 on WhatsApp / Email
![[object Object]](/_next/static/media/star-bottom.7253800d.svg)
Unlock your academic potential
Copyright © 2020–2026 A2Z Services. All Rights Reserved. Developed and managed by ZUCOL.