Business Economics: Supply, Demand, and Market Equilibrium Analysis
VerifiedAdded on 2023/04/21
|17
|2692
|429
Homework Assignment
AI Summary
This assignment solution delves into various aspects of business economics, starting with an analysis of how changes in oil prices affect the demand for related goods like automobiles, home insulation, coal, tires, and bicycles. It explains concepts such as external costs and benefits, highlighting their impact on resource allocation and market efficiency, and discusses the characteristics of public goods that prevent private markets from supplying them adequately. The solution further explores the concept of opportunity cost using the example of wood and the production possibility frontier, and clarifies why the 'free' car offered with chocolate purchases is not truly free due to hidden costs and opportunity costs. The assignment also examines income and cross-price elasticity of demand to determine the nature of goods and their relationships, and discusses the relevance of perfect competition in the real world. Finally, it explains short-run and long-run equilibrium conditions for firms under perfect competition and differentiates between fixed and variable inputs in production, using a coffee shop as an example.
Running head: BUSINESS ECONOMICS
Business Economics
Name of the Student
Name of the University
Course ID
Business Economics
Name of the Student
Name of the University
Course ID
Paraphrase This Document
Need a fresh take? Get an instant paraphrase of this document with our AI Paraphraser
1BUSINESS ECONOMICS
Table of Contents
Question 1........................................................................................................................................
Question a....................................................................................................................................
Question b....................................................................................................................................
Question c....................................................................................................................................
Question 2........................................................................................................................................
Question a....................................................................................................................................
Question b....................................................................................................................................
Question c....................................................................................................................................
Question 4........................................................................................................................................
Question a....................................................................................................................................
Question b....................................................................................................................................
Question c....................................................................................................................................
Question d....................................................................................................................................
Question 5........................................................................................................................................
Question a....................................................................................................................................
Question b..................................................................................................................................
Question c..................................................................................................................................
Question 6......................................................................................................................................
Question a..................................................................................................................................
Question b..................................................................................................................................
Question c..................................................................................................................................
References......................................................................................................................................
2BUSINESS ECONOMICS
Question 1
Question a
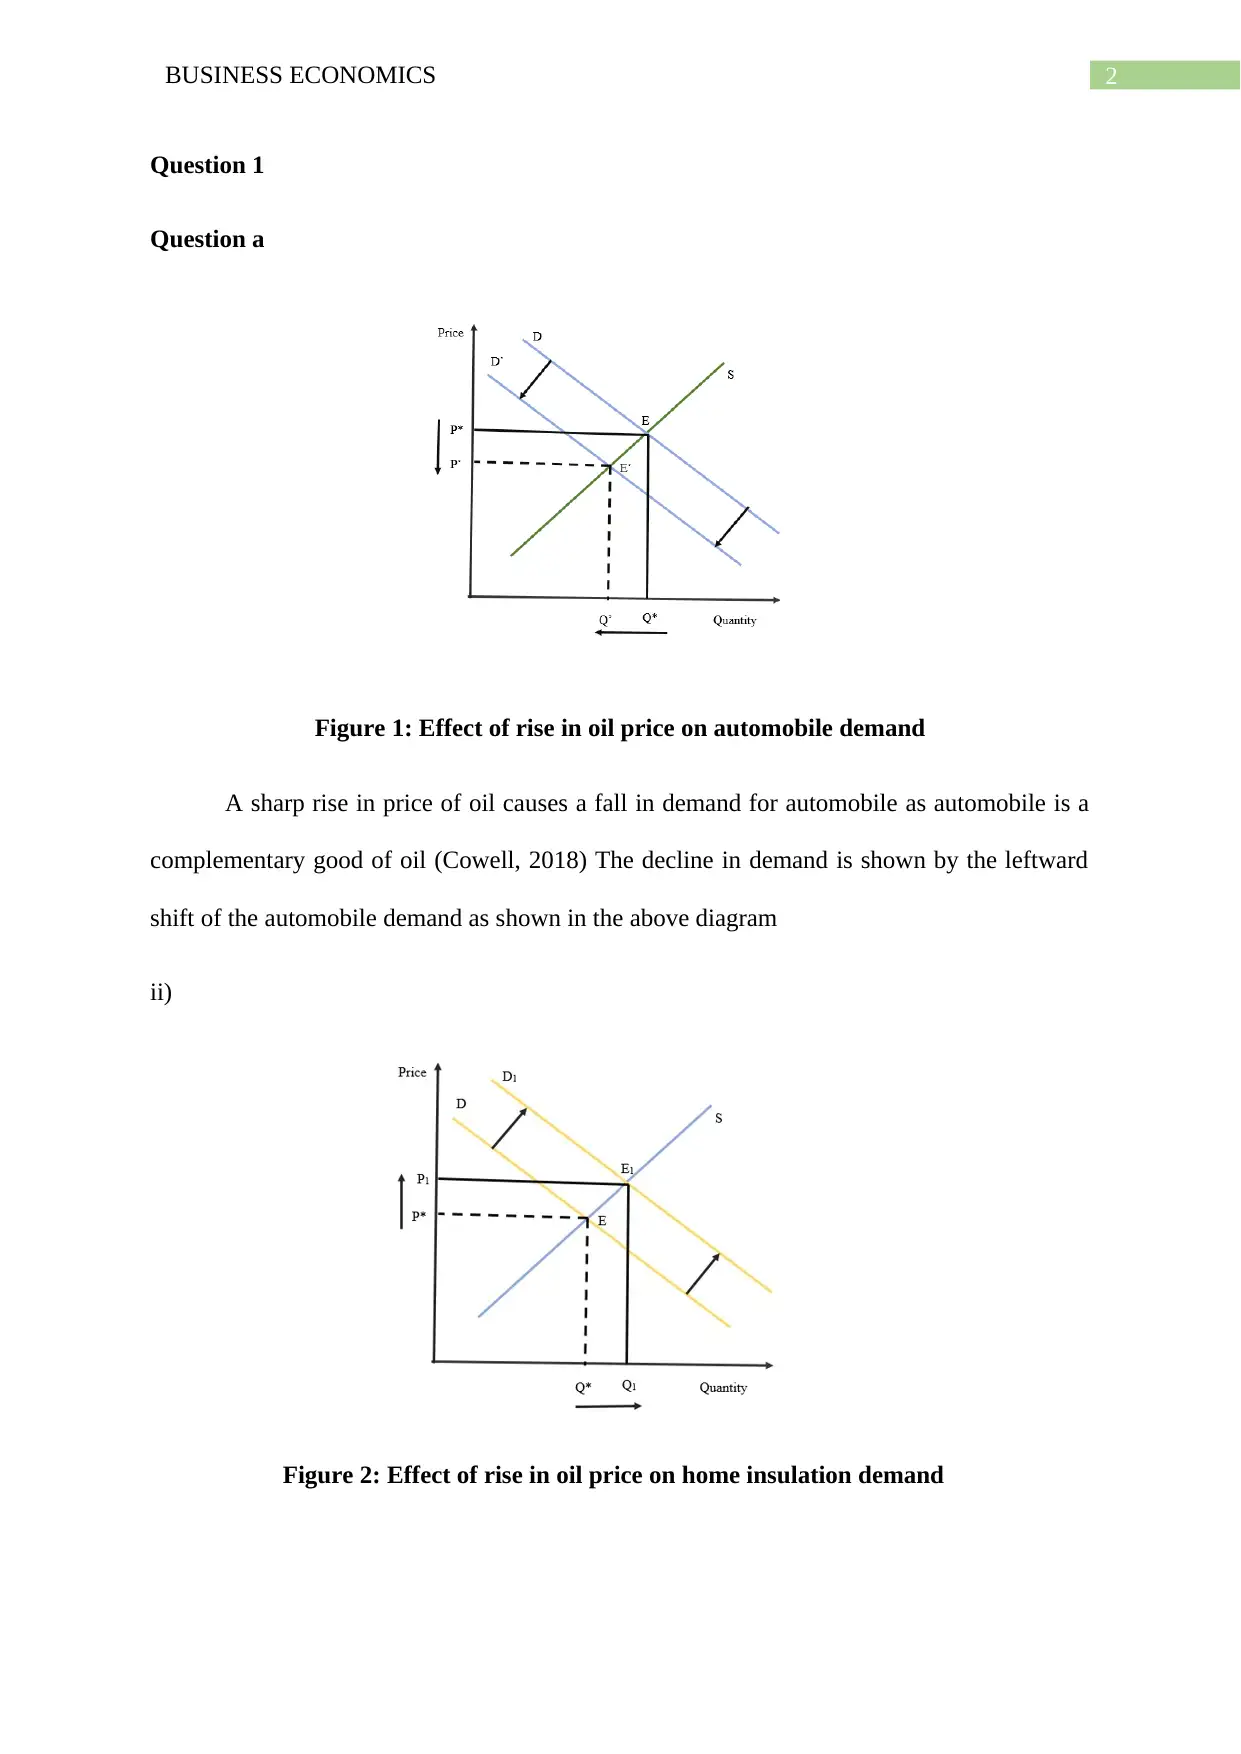
Figure 1: Effect of rise in oil price on automobile demand
A sharp rise in price of oil causes a fall in demand for automobile as automobile is a
complementary good of oil (Cowell, 2018) The decline in demand is shown by the leftward
shift of the automobile demand as shown in the above diagram
ii)
Figure 2: Effect of rise in oil price on home insulation demand
Question 1
Question a
Figure 1: Effect of rise in oil price on automobile demand
A sharp rise in price of oil causes a fall in demand for automobile as automobile is a
complementary good of oil (Cowell, 2018) The decline in demand is shown by the leftward
shift of the automobile demand as shown in the above diagram
ii)
Figure 2: Effect of rise in oil price on home insulation demand
⊘ This is a preview!⊘
Do you want full access?
Subscribe today to unlock all pages.
Trusted by 1+ million students worldwide
3BUSINESS ECONOMICS
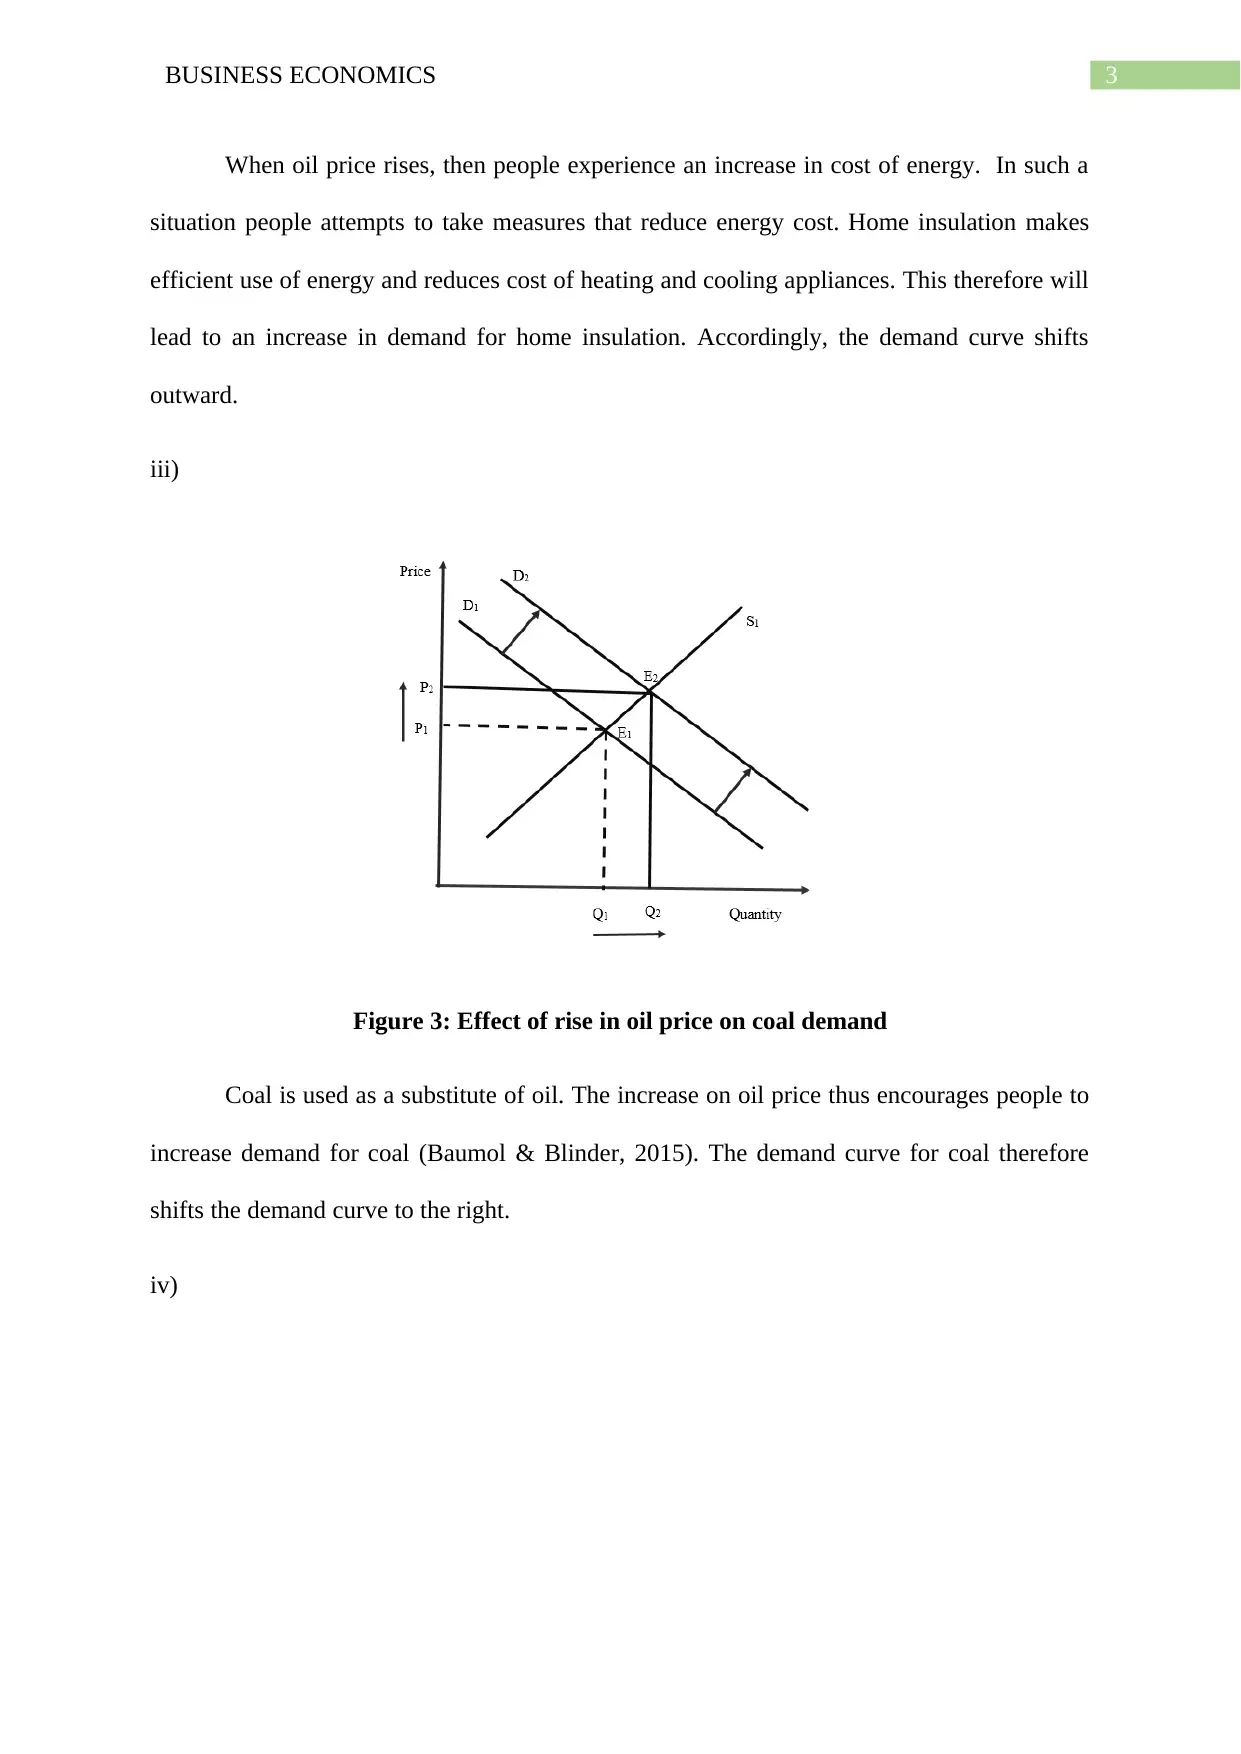
When oil price rises, then people experience an increase in cost of energy. In such a
situation people attempts to take measures that reduce energy cost. Home insulation makes
efficient use of energy and reduces cost of heating and cooling appliances. This therefore will
lead to an increase in demand for home insulation. Accordingly, the demand curve shifts
outward.
iii)
Figure 3: Effect of rise in oil price on coal demand
Coal is used as a substitute of oil. The increase on oil price thus encourages people to
increase demand for coal (Baumol & Blinder, 2015). The demand curve for coal therefore
shifts the demand curve to the right.
iv)
Paraphrase This Document
Need a fresh take? Get an instant paraphrase of this document with our AI Paraphraser
4BUSINESS ECONOMICS
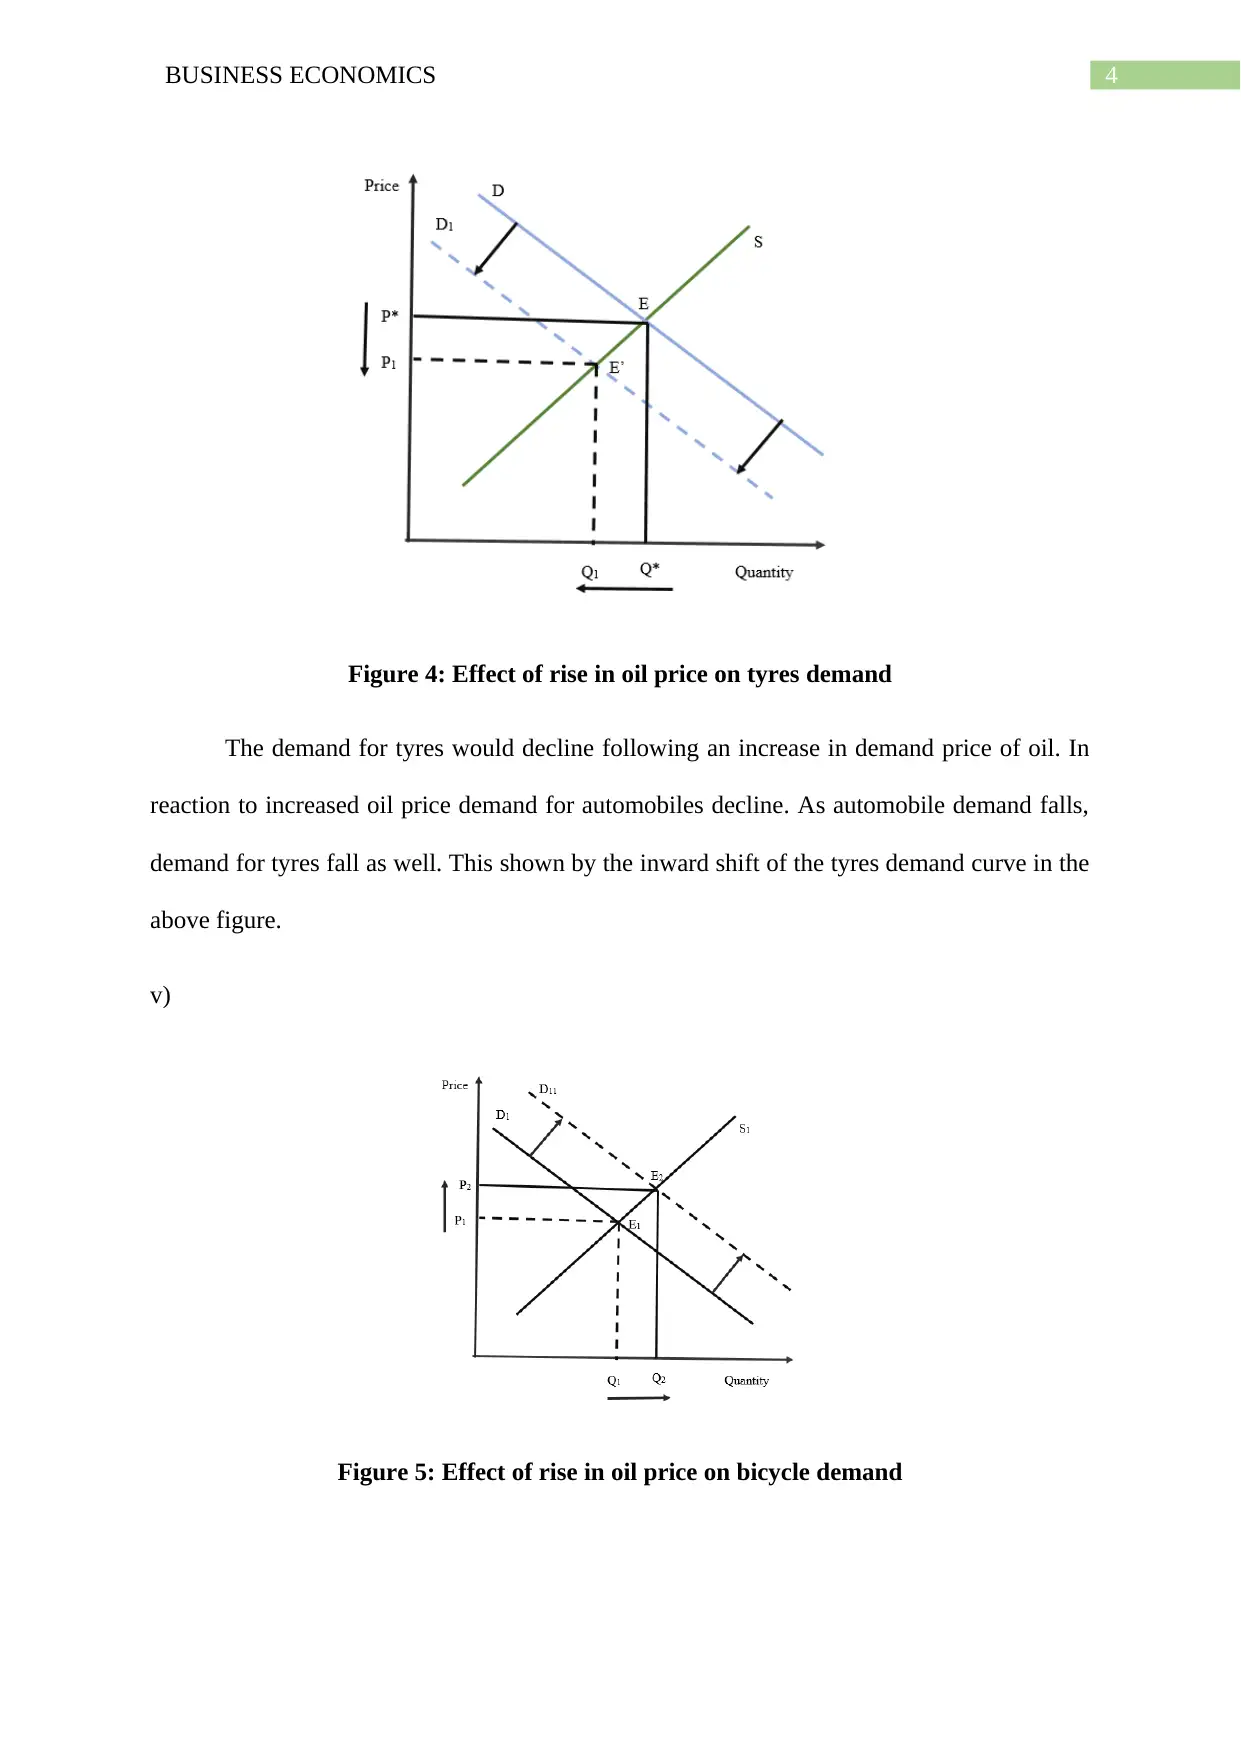
Figure 4: Effect of rise in oil price on tyres demand
The demand for tyres would decline following an increase in demand price of oil. In
reaction to increased oil price demand for automobiles decline. As automobile demand falls,
demand for tyres fall as well. This shown by the inward shift of the tyres demand curve in the
above figure.
v)
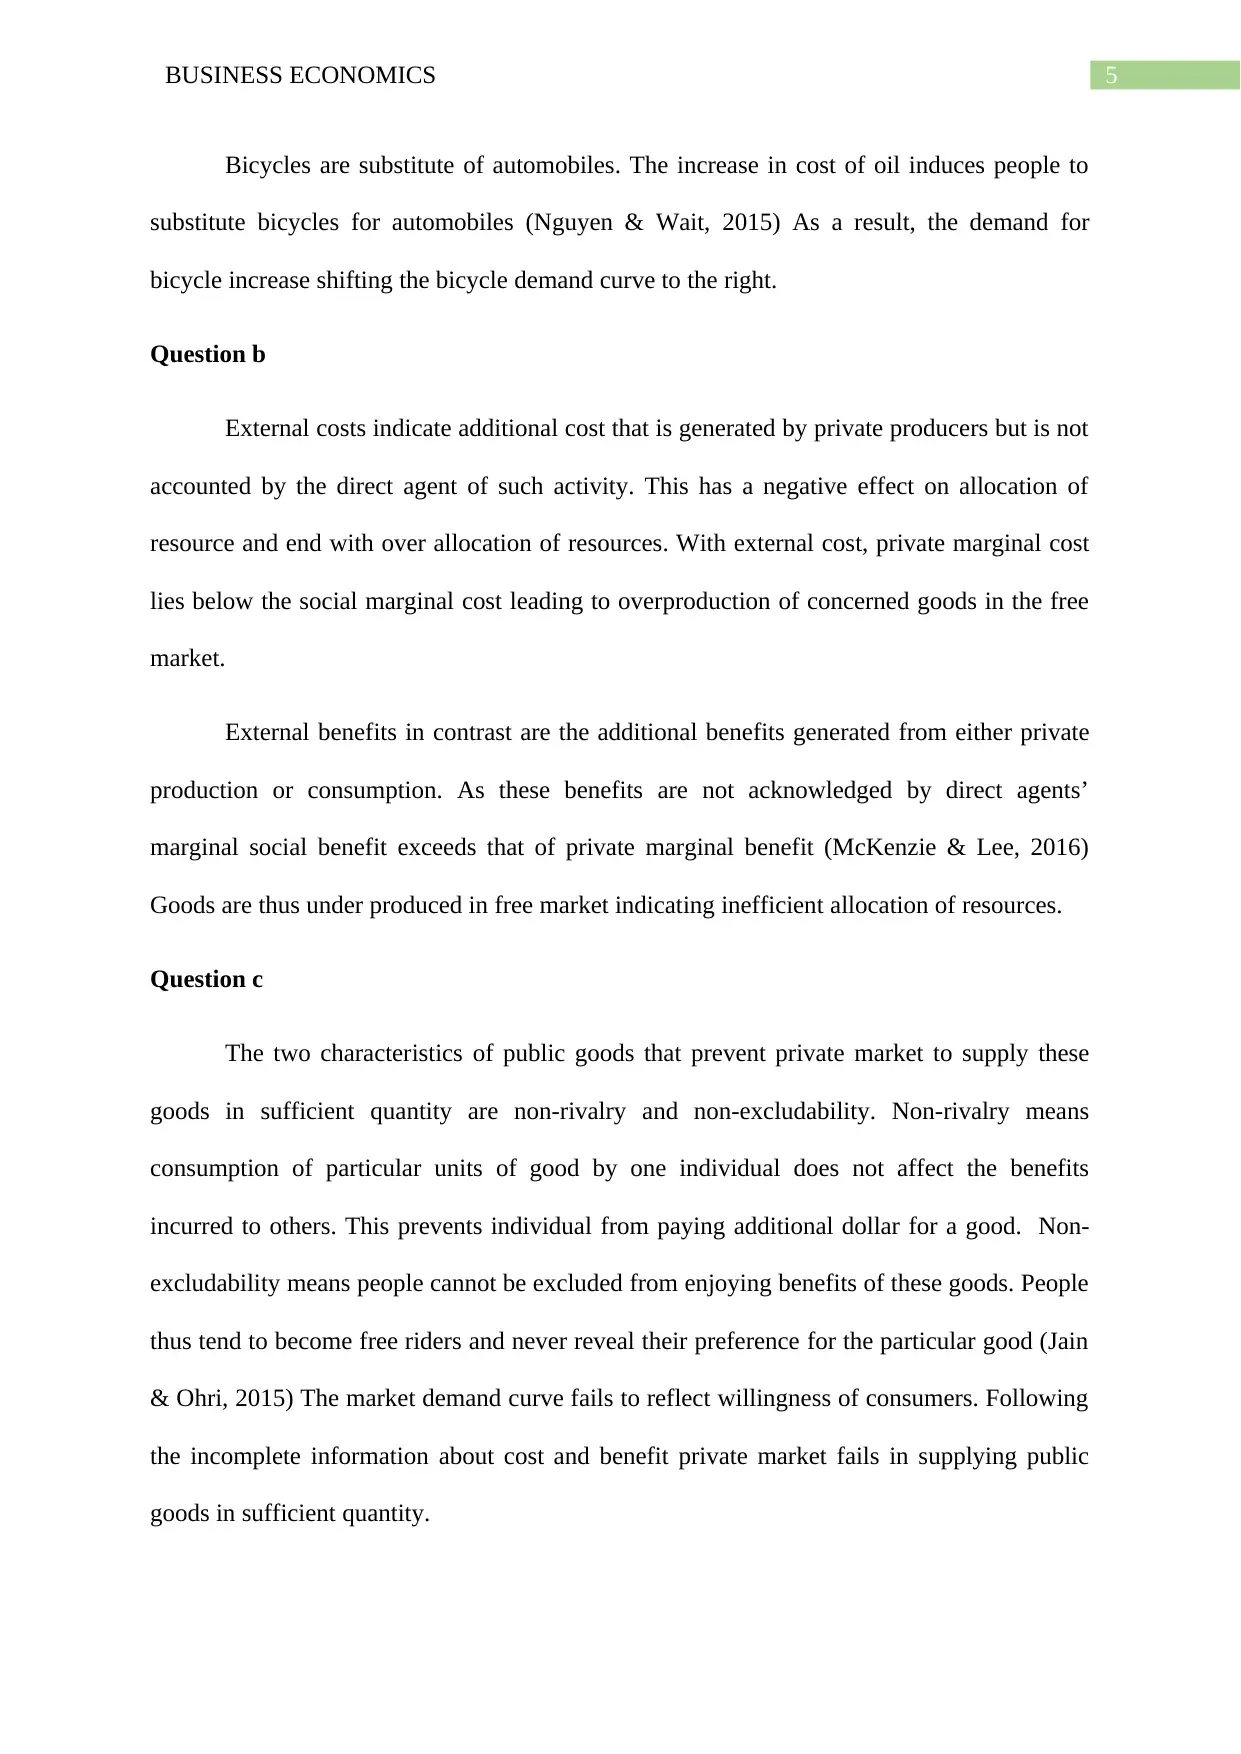
Figure 5: Effect of rise in oil price on bicycle demand
Figure 4: Effect of rise in oil price on tyres demand
The demand for tyres would decline following an increase in demand price of oil. In
reaction to increased oil price demand for automobiles decline. As automobile demand falls,
demand for tyres fall as well. This shown by the inward shift of the tyres demand curve in the
above figure.
v)
Figure 5: Effect of rise in oil price on bicycle demand
5BUSINESS ECONOMICS
Bicycles are substitute of automobiles. The increase in cost of oil induces people to
substitute bicycles for automobiles (Nguyen & Wait, 2015) As a result, the demand for
bicycle increase shifting the bicycle demand curve to the right.
Question b
External costs indicate additional cost that is generated by private producers but is not
accounted by the direct agent of such activity. This has a negative effect on allocation of
resource and end with over allocation of resources. With external cost, private marginal cost
lies below the social marginal cost leading to overproduction of concerned goods in the free
market.
External benefits in contrast are the additional benefits generated from either private
production or consumption. As these benefits are not acknowledged by direct agents’
marginal social benefit exceeds that of private marginal benefit (McKenzie & Lee, 2016)
Goods are thus under produced in free market indicating inefficient allocation of resources.
Question c
The two characteristics of public goods that prevent private market to supply these
goods in sufficient quantity are non-rivalry and non-excludability. Non-rivalry means
consumption of particular units of good by one individual does not affect the benefits
incurred to others. This prevents individual from paying additional dollar for a good. Non-
excludability means people cannot be excluded from enjoying benefits of these goods. People
thus tend to become free riders and never reveal their preference for the particular good (Jain
& Ohri, 2015) The market demand curve fails to reflect willingness of consumers. Following
the incomplete information about cost and benefit private market fails in supplying public
goods in sufficient quantity.
⊘ This is a preview!⊘
Do you want full access?
Subscribe today to unlock all pages.
Trusted by 1+ million students worldwide
6BUSINESS ECONOMICS
Question 2
Question a
In an economy, the availability of resources is limited while wants of people are
unlimited. The unlimited wants of people along with limited supply of resource to fulfill
these wants makes the resources scare. Because of scarcity people face the problem of
making choice. Resources have several alternative usages. When resource in put into use of
producing one particular good it cannot be used for produced other goods. The benefits that
could have been enjoyed thus forgone. This raises the problem of opportunity cost (Hill &
Schiller, 2015) When an individual makes choice from the available alternatives, the cost
incurred due to the fact that alternatives are not selected is the opportunity cost of the specific
choice.
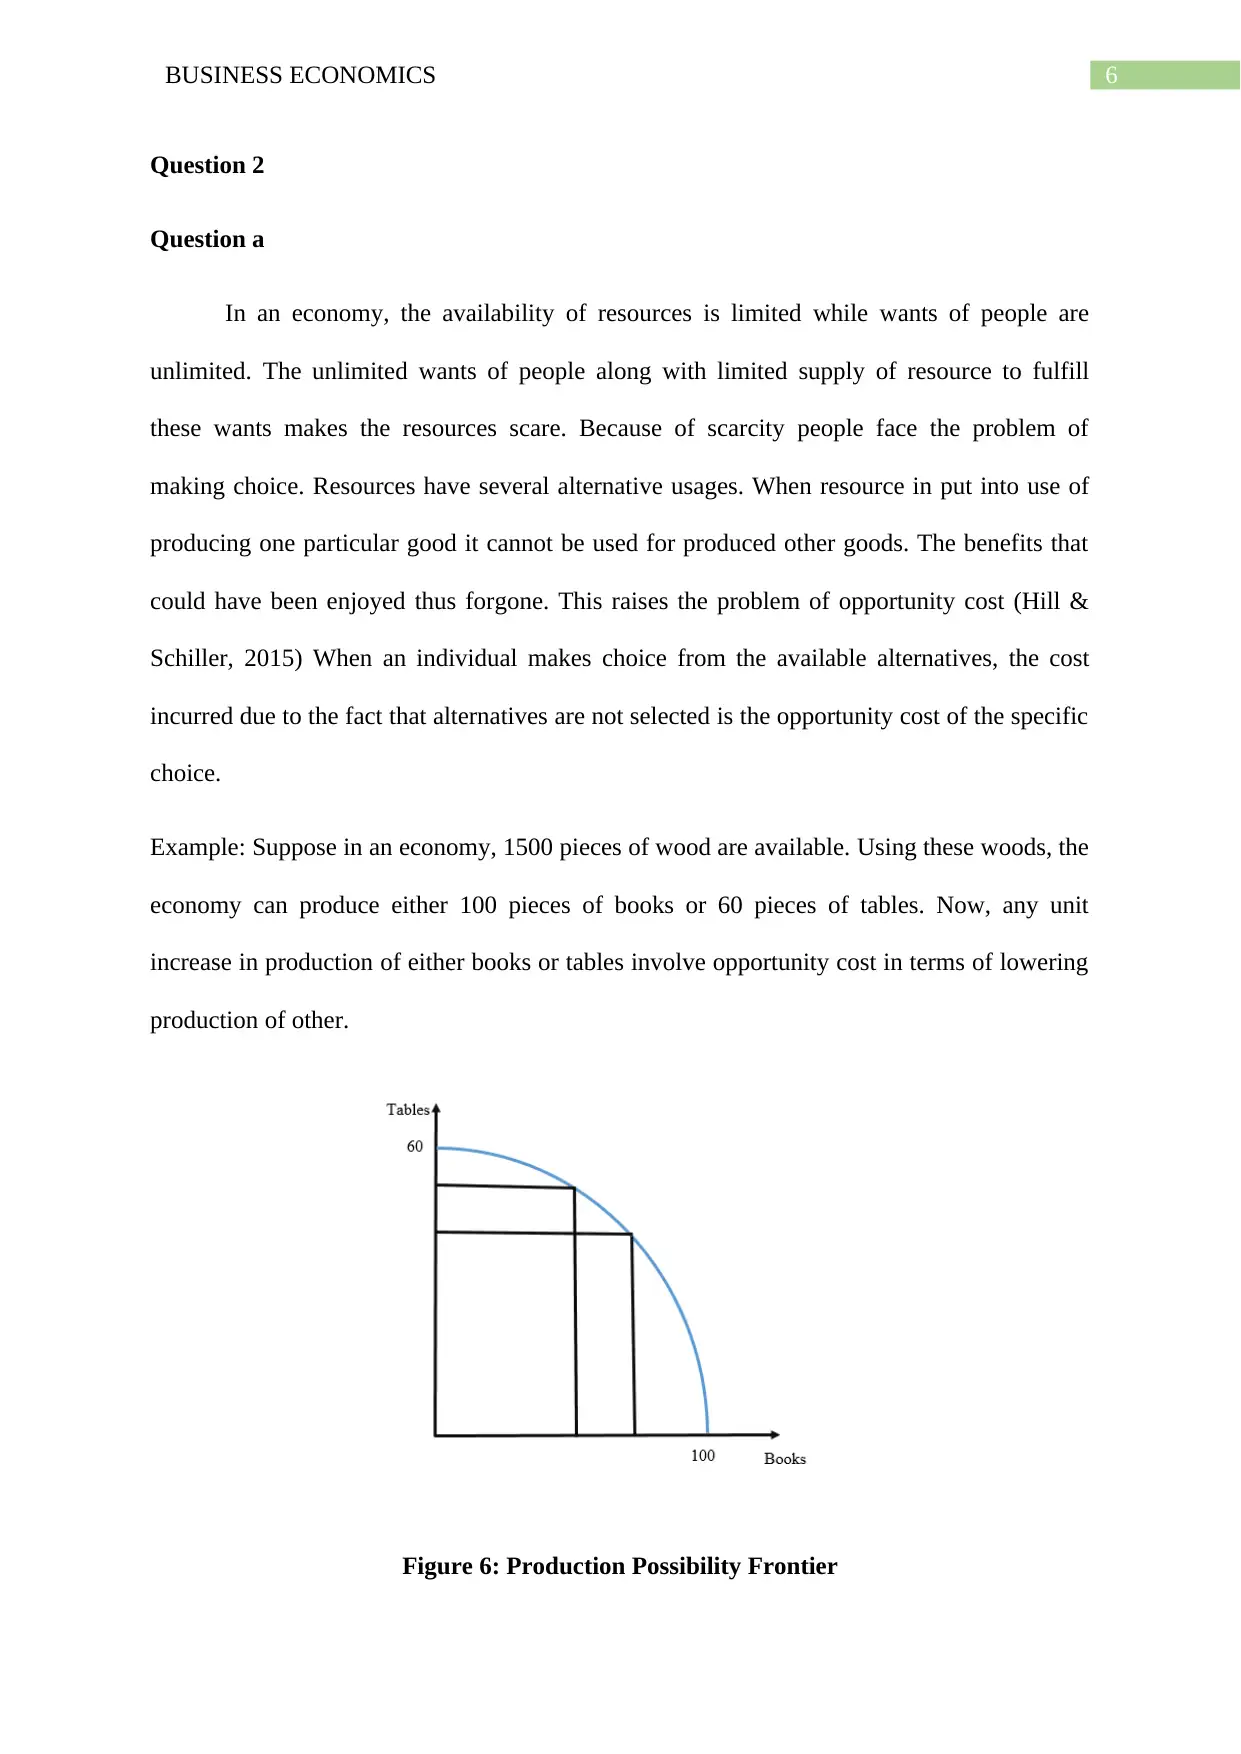
Example: Suppose in an economy, 1500 pieces of wood are available. Using these woods, the
economy can produce either 100 pieces of books or 60 pieces of tables. Now, any unit
increase in production of either books or tables involve opportunity cost in terms of lowering
production of other.
Figure 6: Production Possibility Frontier
Question 2
Question a
In an economy, the availability of resources is limited while wants of people are
unlimited. The unlimited wants of people along with limited supply of resource to fulfill
these wants makes the resources scare. Because of scarcity people face the problem of
making choice. Resources have several alternative usages. When resource in put into use of
producing one particular good it cannot be used for produced other goods. The benefits that
could have been enjoyed thus forgone. This raises the problem of opportunity cost (Hill &
Schiller, 2015) When an individual makes choice from the available alternatives, the cost
incurred due to the fact that alternatives are not selected is the opportunity cost of the specific
choice.
Example: Suppose in an economy, 1500 pieces of wood are available. Using these woods, the
economy can produce either 100 pieces of books or 60 pieces of tables. Now, any unit
increase in production of either books or tables involve opportunity cost in terms of lowering
production of other.
Figure 6: Production Possibility Frontier
Paraphrase This Document
Need a fresh take? Get an instant paraphrase of this document with our AI Paraphraser

7BUSINESS ECONOMICS
8BUSINESS ECONOMICS
Question b
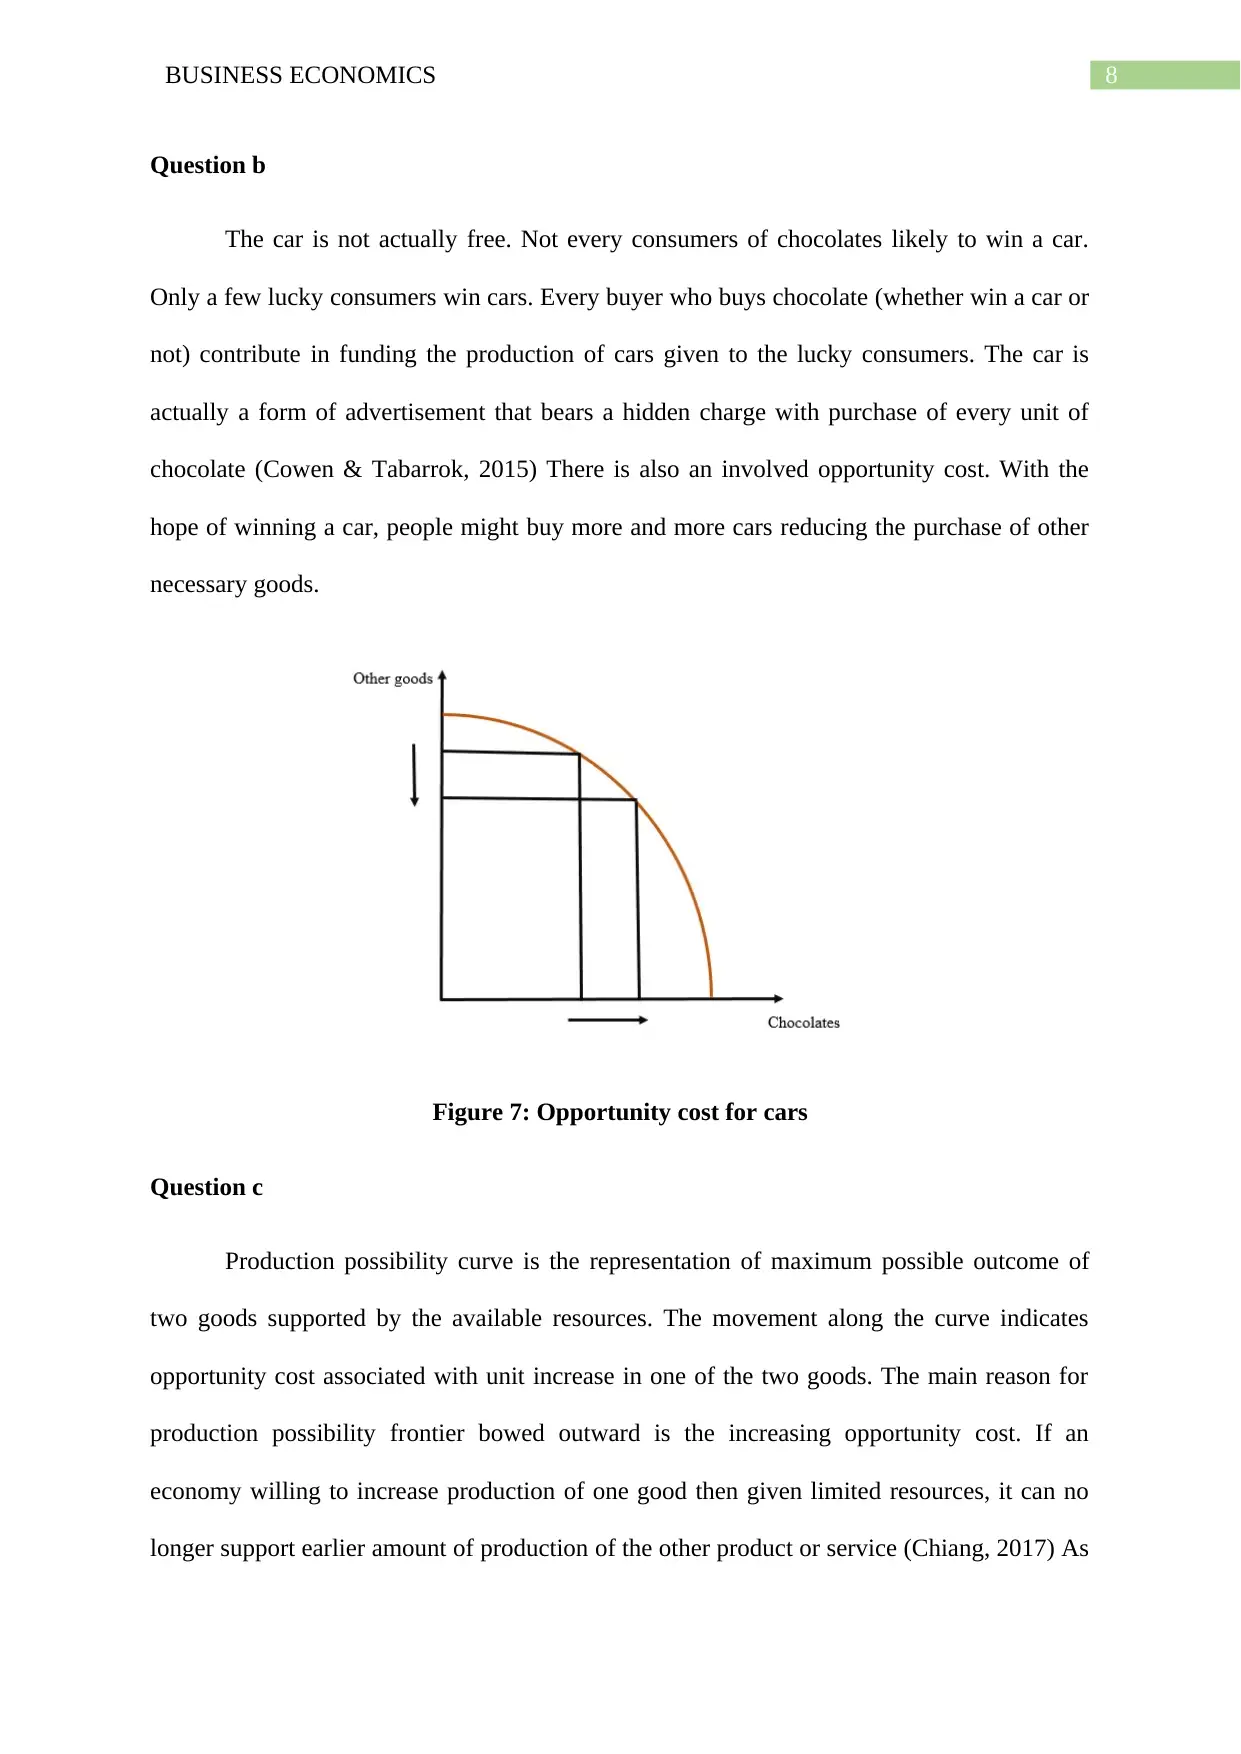
The car is not actually free. Not every consumers of chocolates likely to win a car.
Only a few lucky consumers win cars. Every buyer who buys chocolate (whether win a car or
not) contribute in funding the production of cars given to the lucky consumers. The car is
actually a form of advertisement that bears a hidden charge with purchase of every unit of
chocolate (Cowen & Tabarrok, 2015) There is also an involved opportunity cost. With the
hope of winning a car, people might buy more and more cars reducing the purchase of other
necessary goods.
Figure 7: Opportunity cost for cars
Question c
Production possibility curve is the representation of maximum possible outcome of
two goods supported by the available resources. The movement along the curve indicates
opportunity cost associated with unit increase in one of the two goods. The main reason for
production possibility frontier bowed outward is the increasing opportunity cost. If an
economy willing to increase production of one good then given limited resources, it can no
longer support earlier amount of production of the other product or service (Chiang, 2017) As
Question b
The car is not actually free. Not every consumers of chocolates likely to win a car.
Only a few lucky consumers win cars. Every buyer who buys chocolate (whether win a car or
not) contribute in funding the production of cars given to the lucky consumers. The car is
actually a form of advertisement that bears a hidden charge with purchase of every unit of
chocolate (Cowen & Tabarrok, 2015) There is also an involved opportunity cost. With the
hope of winning a car, people might buy more and more cars reducing the purchase of other
necessary goods.
Figure 7: Opportunity cost for cars
Question c
Production possibility curve is the representation of maximum possible outcome of
two goods supported by the available resources. The movement along the curve indicates
opportunity cost associated with unit increase in one of the two goods. The main reason for
production possibility frontier bowed outward is the increasing opportunity cost. If an
economy willing to increase production of one good then given limited resources, it can no
longer support earlier amount of production of the other product or service (Chiang, 2017) As
⊘ This is a preview!⊘
Do you want full access?
Subscribe today to unlock all pages.
Trusted by 1+ million students worldwide
9BUSINESS ECONOMICS
more and more of one good is produced, economy needs to sacrifice more and more of other
cost and hence opportunity cost increases. This increases gradient of PPF and makes it
concave.
Question 4
Question a
The income elasticity of demand captures proportionate change in demand for a
corresponding proportionate change in income (Baumol & Blinder, 2015) Due to recession
demand of consumers reduces by 10 percent. Given the income elasticity of pre-recorded
music compact is +7, the 10 percent decline in consumers’ income reduces demand for pre-
recorded compact disc by (10*7) = 70 percent. for cabinet maker’s work, the income
elasticity of demand is given as +0.7. That means a decline in income by 10 percent reduces
demand for cabinet maker’s work by (0.7*10) = 7 percent. Due to a higher income elasticity
of demand for pre-recorded compact disc, the recession has a higher impact on compact disc
than that of cabinet maker’s work
Question b
With accomplish the purpose of determining whether MP3 music players and pre-
recorded music compacts discs are in competition with each other the cross price elasticity of
demand needs to be determined. If cross price elasticity is negative, then this means goods
are complementary and hence, there would be no competition between goods (Jain & Ohri,
2015) The positive value of cross price elasticity implies two goods are substitute. In this
case, there are intense rivalry between the two goods as they compete against each other.
Paraphrase This Document
Need a fresh take? Get an instant paraphrase of this document with our AI Paraphraser
10BUSINESS ECONOMICS
Question c
YED = +0.8. The value of income elasticity indicates that as income increase by 1 percent
demand for the particular good increases by 0.8 percent. As demand increase with increase in
income the good is a normal good.
YED = -2.4. The value of income elasticity indicates that as income increase by 1 percent
demand for the particular good decreases by 2.4 percent. As demand decreases with increase
in income the good is inferior good.
Question d
XED = + 0.85. The specific value of cross price elasticity implies as price one good increases
by 1 percent, demand for the related good increases by 0.85 percent. The positive relation
between price and demand of the related good implies the two goods are substitute goods
(Hill & Schiller, 2015)
XED = - 0.85. The specific value of cross price elasticity implies as price one good increases
by 1 percent, demand for the related good lowers by 4.5 percent. The negative relation
between price and demand of the related good implies the two goods are complementary
goods.
Question 5
Question a
Economists rarely believe perfect competition to exist in real world. The main
characteristics of perfectly competitive markets include firms sell homogenous products,
forms are price takers, individual firm has a very small market share, buyers have perfect
knowledge about the market and there is free entry or exit of firms. In real world, these five
characteristics are rarely found together in one industry. Most of the products sold today
11BUSINESS ECONOMICS
show some degree of differentiation. Products differ in terms of quality, size of the product,
brand identity and other parameters. Imperfectly competitive markets are more relevant form
of market structure (Cowen & Tabarrok, 2015) Perfectly competitive market thus though has
huge theoretical implication and used as benchmark of analyzing other markets, the concept
has little practical value.
Question b
Short run equilibrium under perfect competition
Short run is defined as a period during which firms can only change variable inputs to
maximize profit or minimize loss. Number of firms in the industry remain fixed as firms
neither leave or enter the industry in the short run.
i)Firm
There are two condition for firms to attain short run equilibrium under perfect
competition.
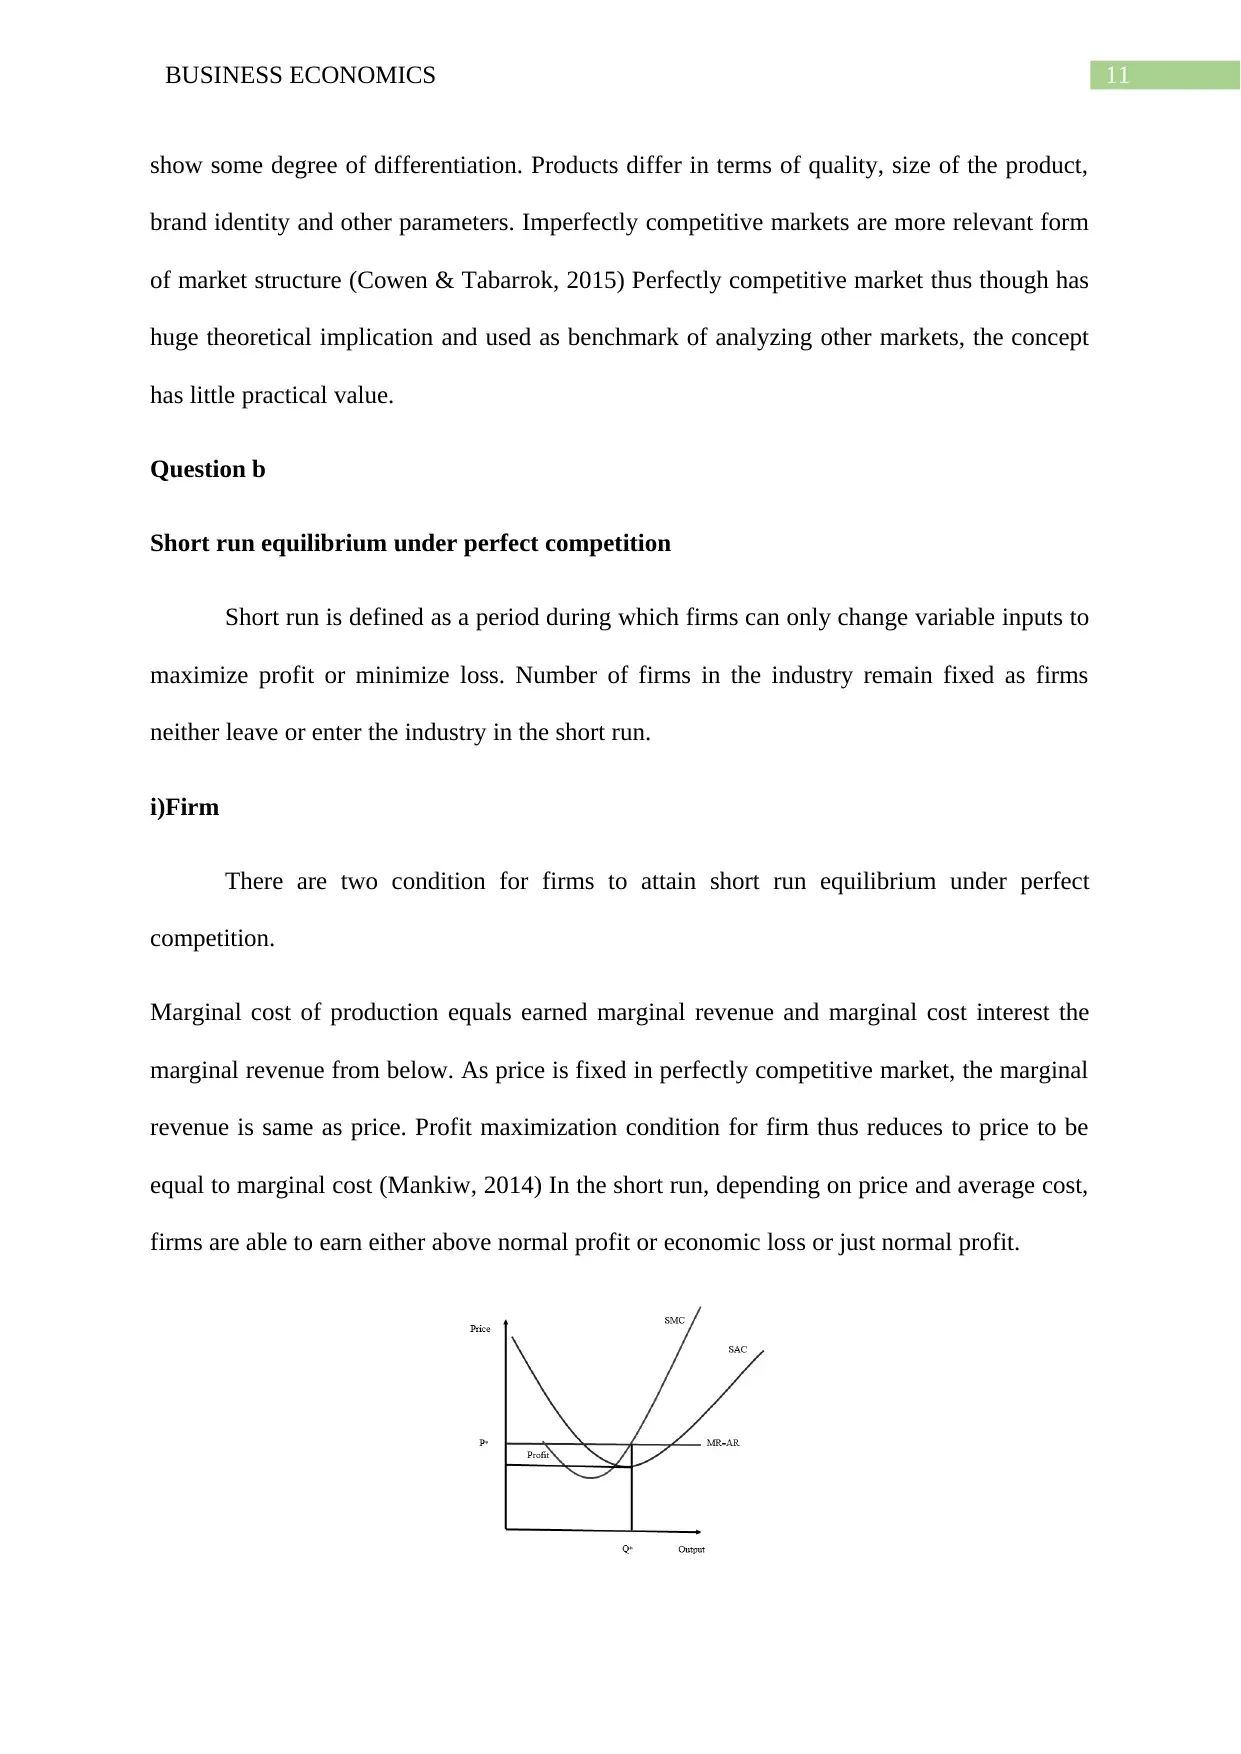
Marginal cost of production equals earned marginal revenue and marginal cost interest the
marginal revenue from below. As price is fixed in perfectly competitive market, the marginal
revenue is same as price. Profit maximization condition for firm thus reduces to price to be
equal to marginal cost (Mankiw, 2014) In the short run, depending on price and average cost,
firms are able to earn either above normal profit or economic loss or just normal profit.
show some degree of differentiation. Products differ in terms of quality, size of the product,
brand identity and other parameters. Imperfectly competitive markets are more relevant form
of market structure (Cowen & Tabarrok, 2015) Perfectly competitive market thus though has
huge theoretical implication and used as benchmark of analyzing other markets, the concept
has little practical value.
Question b
Short run equilibrium under perfect competition
Short run is defined as a period during which firms can only change variable inputs to
maximize profit or minimize loss. Number of firms in the industry remain fixed as firms
neither leave or enter the industry in the short run.
i)Firm
There are two condition for firms to attain short run equilibrium under perfect
competition.
Marginal cost of production equals earned marginal revenue and marginal cost interest the
marginal revenue from below. As price is fixed in perfectly competitive market, the marginal
revenue is same as price. Profit maximization condition for firm thus reduces to price to be
equal to marginal cost (Mankiw, 2014) In the short run, depending on price and average cost,
firms are able to earn either above normal profit or economic loss or just normal profit.
⊘ This is a preview!⊘
Do you want full access?
Subscribe today to unlock all pages.
Trusted by 1+ million students worldwide
1 out of 17
Related Documents


Your All-in-One AI-Powered Toolkit for Academic Success.
+13062052269
info@desklib.com
Available 24*7 on WhatsApp / Email
![[object Object]](/_next/static/media/star-bottom.7253800d.svg)
Unlock your academic potential
Copyright © 2020–2026 A2Z Services. All Rights Reserved. Developed and managed by ZUCOL.