Monitoring Profitability and Production: Business Economics
VerifiedAdded on 2020/05/28
|10
|2494
|129
Report
AI Summary
This report analyzes business economics, focusing on monitoring and charting profitability and production. It begins with an introduction emphasizing the importance of profitability reporting strategies. The report then explores supply and demand diagrams, illustrating the effects of changes in petrol prices, incomes, and wages on car sales. It explains how firms maximize profits using marginal cost and marginal revenue, and delves into short-run production decisions in perfect competition. Additionally, the report examines the welfare loss associated with monopolies compared to perfectly competitive markets, providing diagrams and explanations to support its arguments. The report concludes by highlighting the significance of charting sales, productivity, and profitability for business success. It references key economic concepts and provides a comprehensive overview of business economics principles.
1/12/2018
Student Name
Business Economics: Monitoring and Charting Profitability and Production
Student Name
Business Economics: Monitoring and Charting Profitability and Production
Paraphrase This Document
Need a fresh take? Get an instant paraphrase of this document with our AI Paraphraser
Contents
Introduction.................................................................................................................................................1
supply and demand diagrams show the effects of the following changes in the price and quantity of cars: 2
An increase in the price of petrol.............................................................................................................3
A rise in incomes.....................................................................................................................................3
A rise in wages for care workers and a fall in the price of bus tickets (both at the same time)................3
Explain, using a diagram (or diagrams), why firms maximize profits where marginal cost equals marginal
revenue........................................................................................................................................................4
Short run production decision - Perfect Competition...................................................................................6
Explain why monopoly results in a welfare loss compared to a perfectly competitive market....................7
Conclusion...................................................................................................................................................8
References:..................................................................................................................................................9
Introduction
As the number of businesses increases, the demand for businesses to determine their profitability
is also rising. This makes it important for the businesses to adopt and use suitable sales,
production and profitability reporting strategies which will ensure the business secures the most
profit from the transaction (Shaw, 2014). The following report shall highlight different charting
techniques a business can utilize to improve its profitability and allow the businesses secure the
best returns on its transactions and sales.
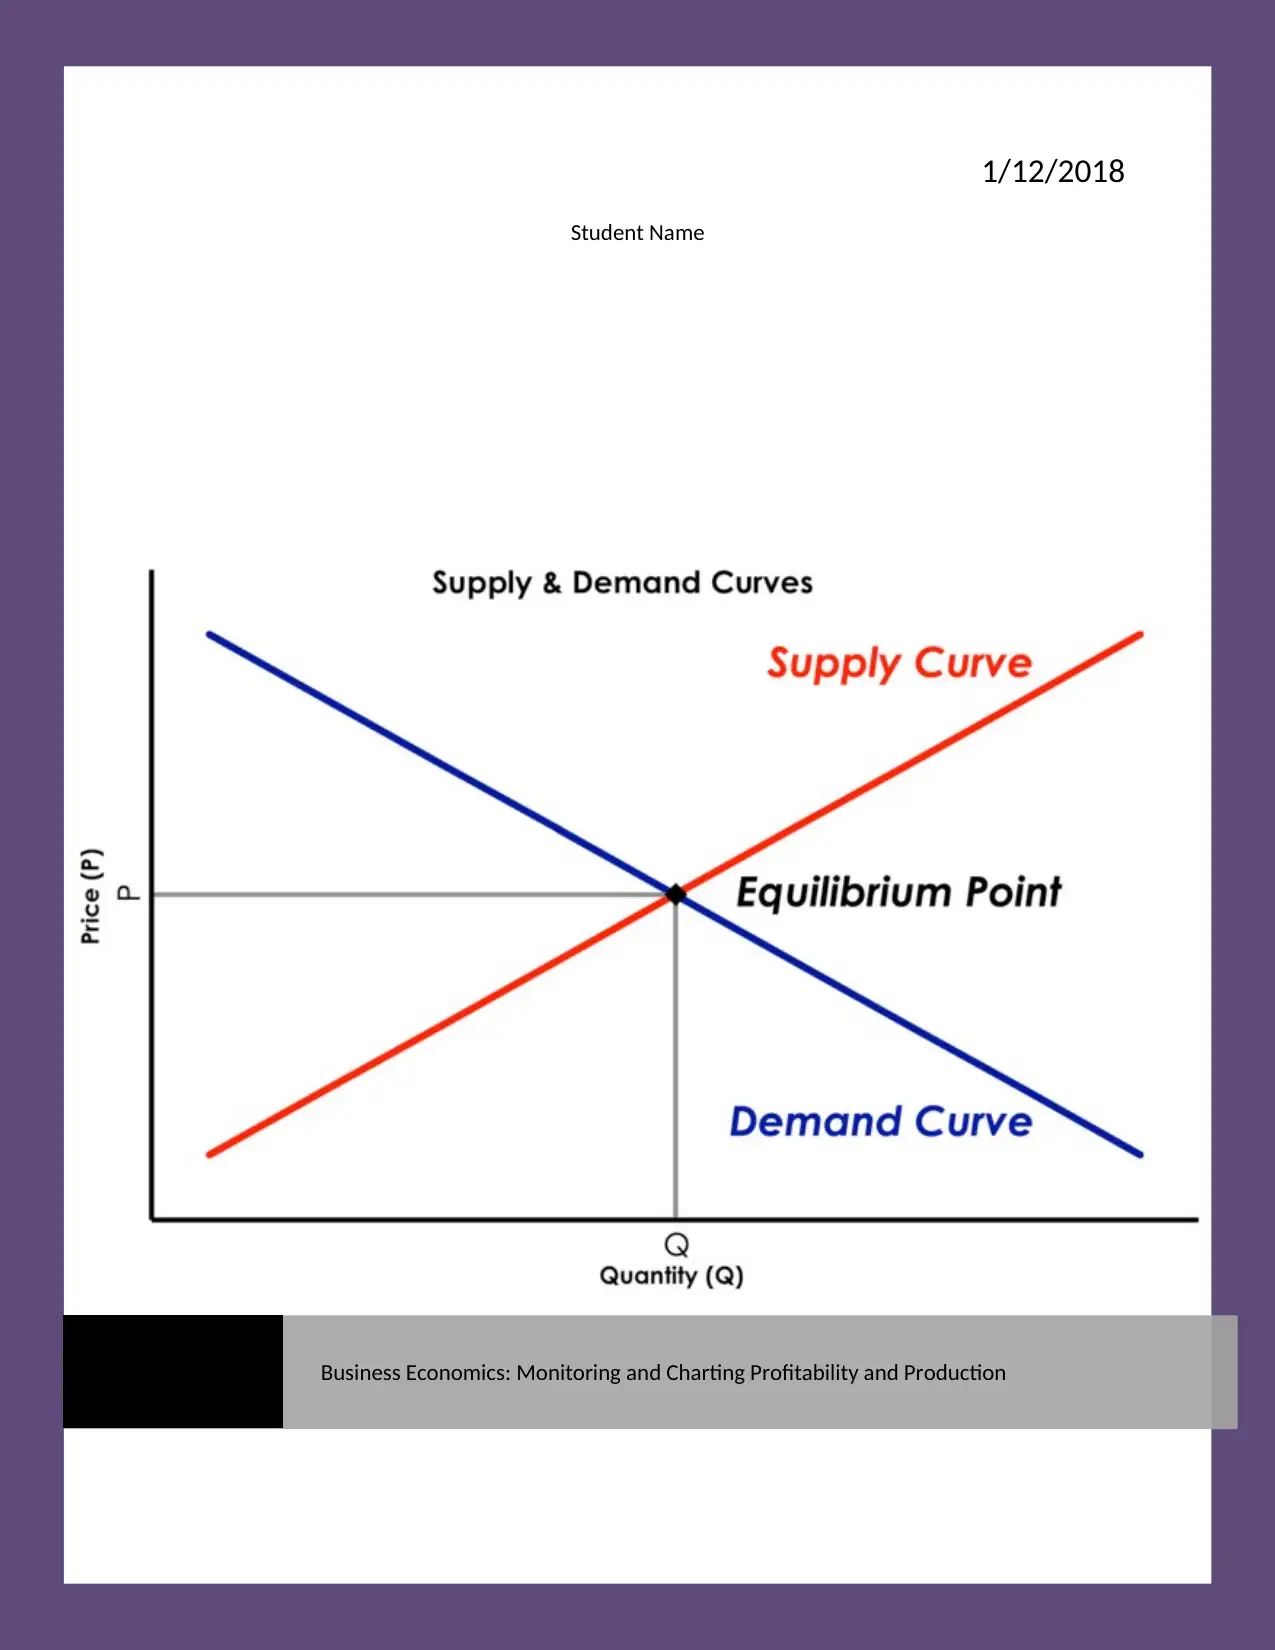
Supply and demand diagrams show the effects of the following changes in the price and
quantity of cars:
The supply and demand curve is the important indicator and delivers a direct visual correlation
between the effects of rising prices on the number of products demanded by the customer. As the
product cost and maintenance increase, the demand for the products will automatically reduce
(Hirshleifer, Glazer, & Hirshleifer, 2005). Supply and demand curves also have a tendency of
increasing or reducing in demand based on certain influencing factors also known as shifters.
The following factors have been directly associated with the shift in demand:
1. taste and preference for products and services
2. number of consumers in the market
3. price of related products and services
4. consumer income levels
5. consumer expectations
Each of these shifters will have a direct effect on the supply and demand curve and result in the
increase or decrease in demand for the products or services.
As the number of businesses increases, the demand for businesses to determine their profitability
is also rising. This makes it important for the businesses to adopt and use suitable sales,
production and profitability reporting strategies which will ensure the business secures the most
profit from the transaction (Shaw, 2014). The following report shall highlight different charting
techniques a business can utilize to improve its profitability and allow the businesses secure the
best returns on its transactions and sales.
Supply and demand diagrams show the effects of the following changes in the price and
quantity of cars:
The supply and demand curve is the important indicator and delivers a direct visual correlation
between the effects of rising prices on the number of products demanded by the customer. As the
product cost and maintenance increase, the demand for the products will automatically reduce
(Hirshleifer, Glazer, & Hirshleifer, 2005). Supply and demand curves also have a tendency of
increasing or reducing in demand based on certain influencing factors also known as shifters.
The following factors have been directly associated with the shift in demand:
1. taste and preference for products and services
2. number of consumers in the market
3. price of related products and services
4. consumer income levels
5. consumer expectations
Each of these shifters will have a direct effect on the supply and demand curve and result in the
increase or decrease in demand for the products or services.
⊘ This is a preview!⊘
Do you want full access?
Subscribe today to unlock all pages.
Trusted by 1+ million students worldwide
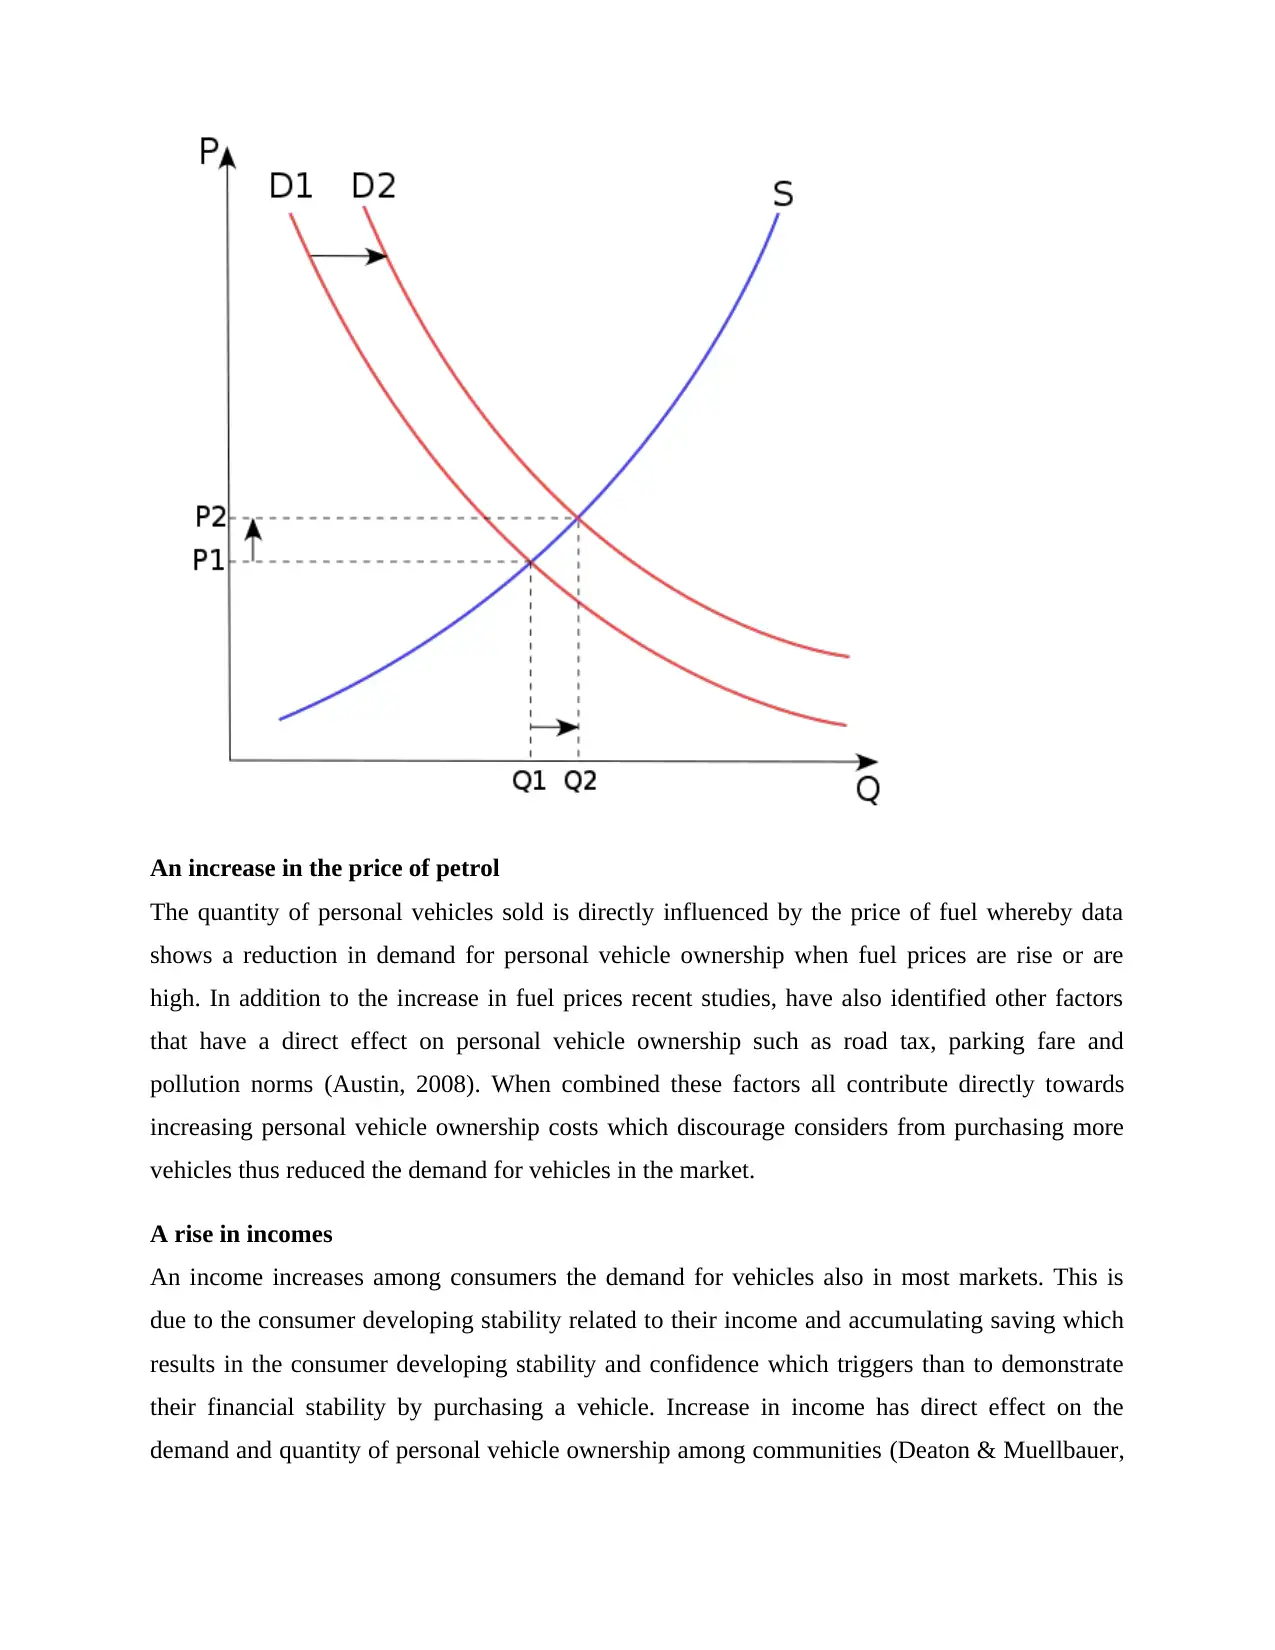
An increase in the price of petrol
The quantity of personal vehicles sold is directly influenced by the price of fuel whereby data
shows a reduction in demand for personal vehicle ownership when fuel prices are rise or are
high. In addition to the increase in fuel prices recent studies, have also identified other factors
that have a direct effect on personal vehicle ownership such as road tax, parking fare and
pollution norms (Austin, 2008). When combined these factors all contribute directly towards
increasing personal vehicle ownership costs which discourage considers from purchasing more
vehicles thus reduced the demand for vehicles in the market.
A rise in incomes
An income increases among consumers the demand for vehicles also in most markets. This is
due to the consumer developing stability related to their income and accumulating saving which
results in the consumer developing stability and confidence which triggers than to demonstrate
their financial stability by purchasing a vehicle. Increase in income has direct effect on the
demand and quantity of personal vehicle ownership among communities (Deaton & Muellbauer,
Paraphrase This Document
Need a fresh take? Get an instant paraphrase of this document with our AI Paraphraser
1980). As the individual grows most financially stable they are encouraged to demotivate their
stability by adopting more luxurious and private lives. This results in a gradual increase in
demand to purchase branded products and investment on personal conveyance which helps the
individual standout in the community.
A rise in wages for care workers and a fall in the price of bus tickets (both at the same
time).
When compared there is no difference or influencing factors on the scenario involving a rise in
wages of car users and reduction in prices of bus tickets. This is due to car users having already
dedicated certain among of money towards their conveyance and are not directly influenced by
the cost-cutting strategies. Instead, they are more influenced by maintaining a higher social status
in the community thus reduction in bust ticket prices is unlikely to have an effect on their
preference to use their personal vehicle (Loudon, 2001). On the other hand, the car worker will
also have secured a rise in wages of which a certain percentage can be dedicated to fueling and
maintain their personal vehicle. The above scenario is thus unlikely to trigger an increase or
decrease of demand on the supply and demand curves as the individuals are have already
dedicated their income towards the lifestyle and unlikely to influenced by reductions in bus ticket
prices.
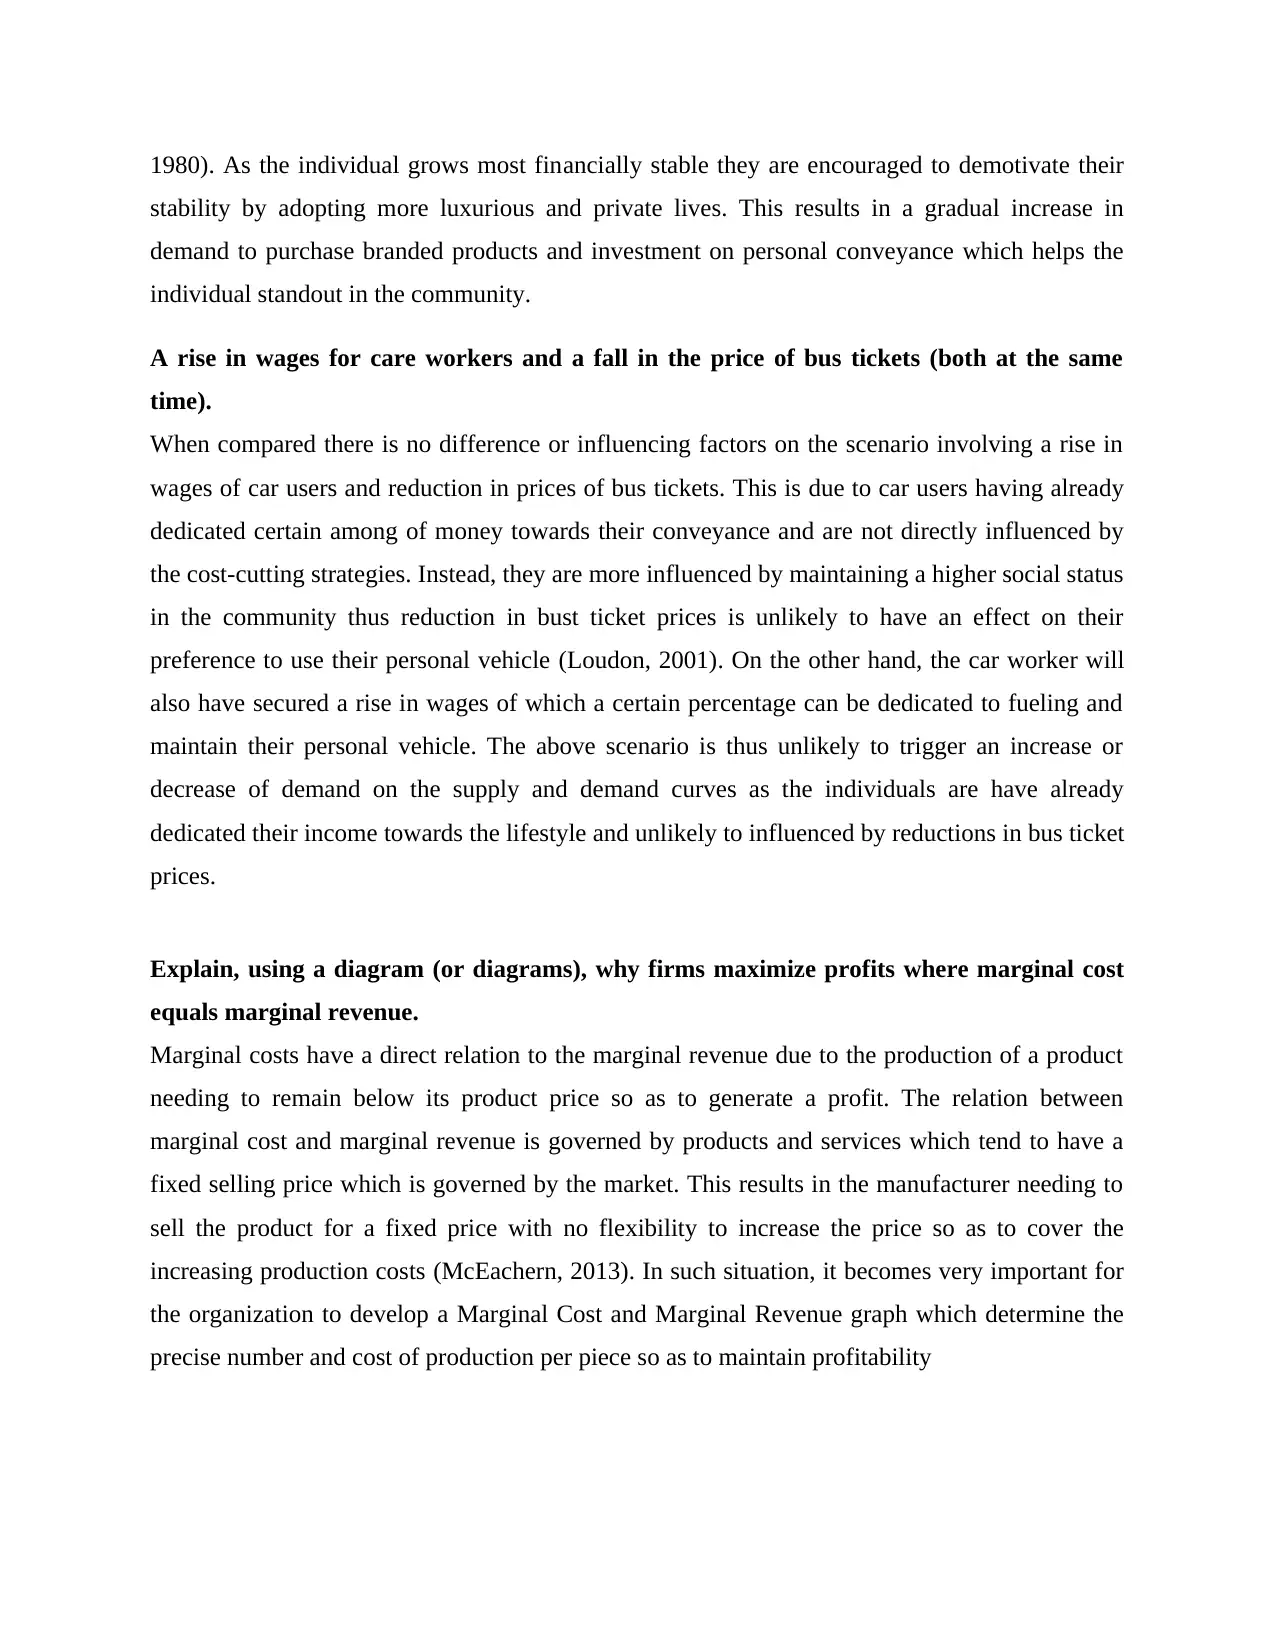
Explain, using a diagram (or diagrams), why firms maximize profits where marginal cost
equals marginal revenue.
Marginal costs have a direct relation to the marginal revenue due to the production of a product
needing to remain below its product price so as to generate a profit. The relation between
marginal cost and marginal revenue is governed by products and services which tend to have a
fixed selling price which is governed by the market. This results in the manufacturer needing to
sell the product for a fixed price with no flexibility to increase the price so as to cover the
increasing production costs (McEachern, 2013). In such situation, it becomes very important for
the organization to develop a Marginal Cost and Marginal Revenue graph which determine the
precise number and cost of production per piece so as to maintain profitability
stability by adopting more luxurious and private lives. This results in a gradual increase in
demand to purchase branded products and investment on personal conveyance which helps the
individual standout in the community.
A rise in wages for care workers and a fall in the price of bus tickets (both at the same
time).
When compared there is no difference or influencing factors on the scenario involving a rise in
wages of car users and reduction in prices of bus tickets. This is due to car users having already
dedicated certain among of money towards their conveyance and are not directly influenced by
the cost-cutting strategies. Instead, they are more influenced by maintaining a higher social status
in the community thus reduction in bust ticket prices is unlikely to have an effect on their
preference to use their personal vehicle (Loudon, 2001). On the other hand, the car worker will
also have secured a rise in wages of which a certain percentage can be dedicated to fueling and
maintain their personal vehicle. The above scenario is thus unlikely to trigger an increase or
decrease of demand on the supply and demand curves as the individuals are have already
dedicated their income towards the lifestyle and unlikely to influenced by reductions in bus ticket
prices.
Explain, using a diagram (or diagrams), why firms maximize profits where marginal cost
equals marginal revenue.
Marginal costs have a direct relation to the marginal revenue due to the production of a product
needing to remain below its product price so as to generate a profit. The relation between
marginal cost and marginal revenue is governed by products and services which tend to have a
fixed selling price which is governed by the market. This results in the manufacturer needing to
sell the product for a fixed price with no flexibility to increase the price so as to cover the
increasing production costs (McEachern, 2013). In such situation, it becomes very important for
the organization to develop a Marginal Cost and Marginal Revenue graph which determine the
precise number and cost of production per piece so as to maintain profitability
On the above graph, P can be considered as the fixed market price for products and services.
This means business will have to manufacture their products for less than P so as to maintain
profitability. Y viewing the horizontal axis it is clear that Q1 would be the perfect point at which
all businesses would maximize their production and profitability due to the quantity being
produced costing below 50% of the selling price. This would result in the business, therefore,
being able to maximize its profits and secure 50%+ on each product sold at Q1. As the number
of products sold increase and moved towards Q the business e refused reduced portability and
will eventually result in equilibrium once production cost arrives at the Q axis. At this stage “Q”
the business would be manufacturing the products and service at the sales cost thus profit would
be generated from the products (Richard Lipsey, 2015). The production costs further increases
and moved towards Q2 the product is classified as no longer being profitable as its production
costs are higher than the selling price thus resulting in the business registering a loss on any
product manufactured at production costs beyond Q.
⊘ This is a preview!⊘
Do you want full access?
Subscribe today to unlock all pages.
Trusted by 1+ million students worldwide
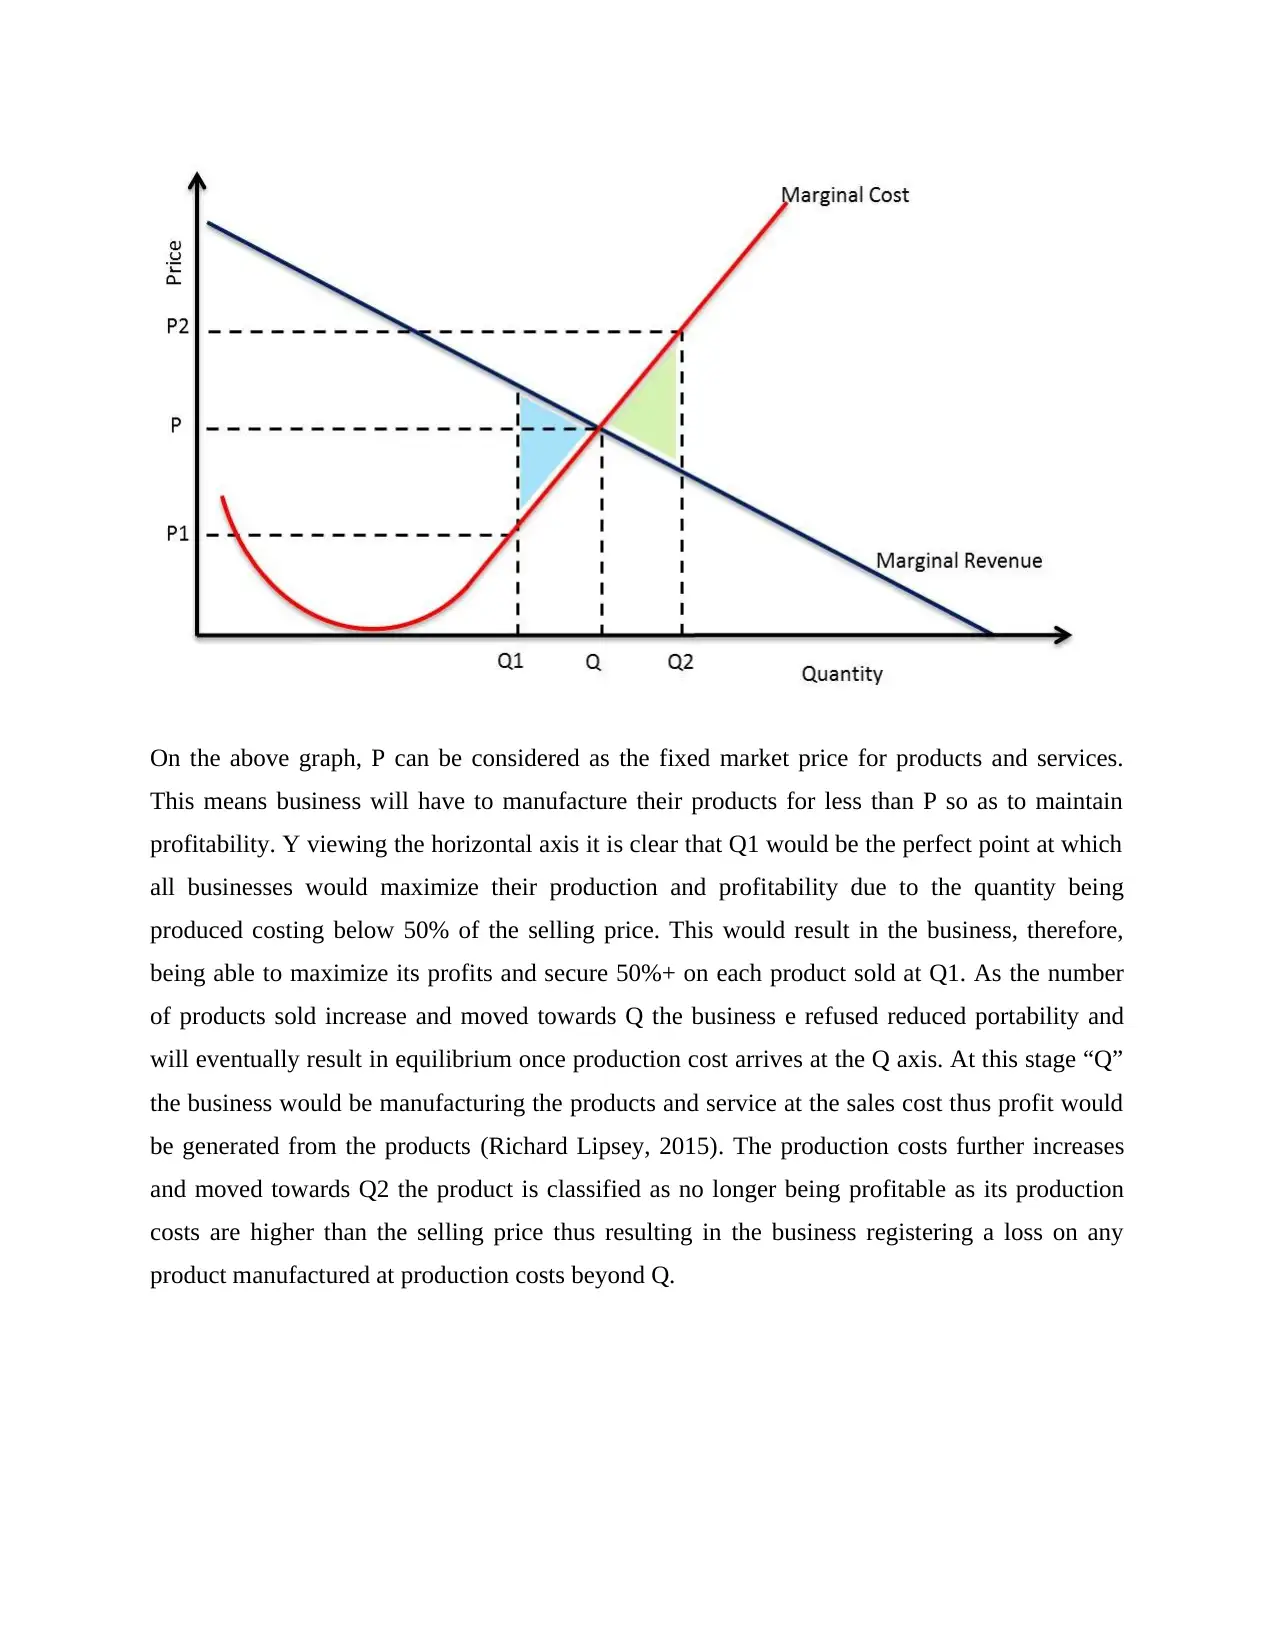
Short run production decision - Perfect Competition
the short run production decision also known as perfect competition is a graph which utilizes a
products marginal costs, the products fixed the market price and the TC carve to help determine
the optimum number of products to be sold so as to maintain the highest profitability. This
perfect competitive threshold is determined by establishing the maximum number of fixed of
exact price products a business needs to sell so as to secure the maximum profitability. This
short-run production decision strategy limits the number of products or services a business can
sell while maintaining the maximum amount of profit after which the amount of profit being
generated by each additional product is lower than the number falling within the threshold thus
reducing product profitability (Machover, 2002). This makes perfect competition are pricing
calculations which utilizes the MC and ATC curved and will use the Fixed market price that
determine the intersection point in this cash which is A. A refers to the ideas and maximum
number of product or services to be sold by the business which will generate the maximum
amount of profit the point where the ATC intersects Q will help determine the cost of the
products. A-b will, therefore, be the maximum amount of profit generated by the business for the
product. It is important to understand that surpassing this amount will result in the business
registering reduced profits which would result in increasing the overhead costs incurred by the
business while attempting to make the additional sales.
By having an optimum profitability range and target the business will be able to establish the
number of products they
need to sell on a daily,
monthly or years bass and
secure the maximum amount
of profit after which the
profitability per product
gradually reduces due to
increasing overhead costs.
It’s important to note that
Perfect Competition can
only be calculated and is
only applicable to products and services which attract a fixed retail price in the market (Hall &
Paraphrase This Document
Need a fresh take? Get an instant paraphrase of this document with our AI Paraphraser
Lieberman, 2007). In this situation the business does not have any flexibility to increase the price
and the businesses is likely to experience reductions in the number of ales and customers move
turn to purchase similar products from the neighboring retailers and suppliers. There is also no
scope for reducing the price to attract more customers as this would result in hurting the
businesses profit margin yet customers are prepared and willing to purchase the product for the
stipulated fixed price. In this situation, the business must be able to develop a short run
production decision chart so as to determine the Perfect Competition range thus allowing the
business secure the maximum amount of profit from the sale of the products and services.
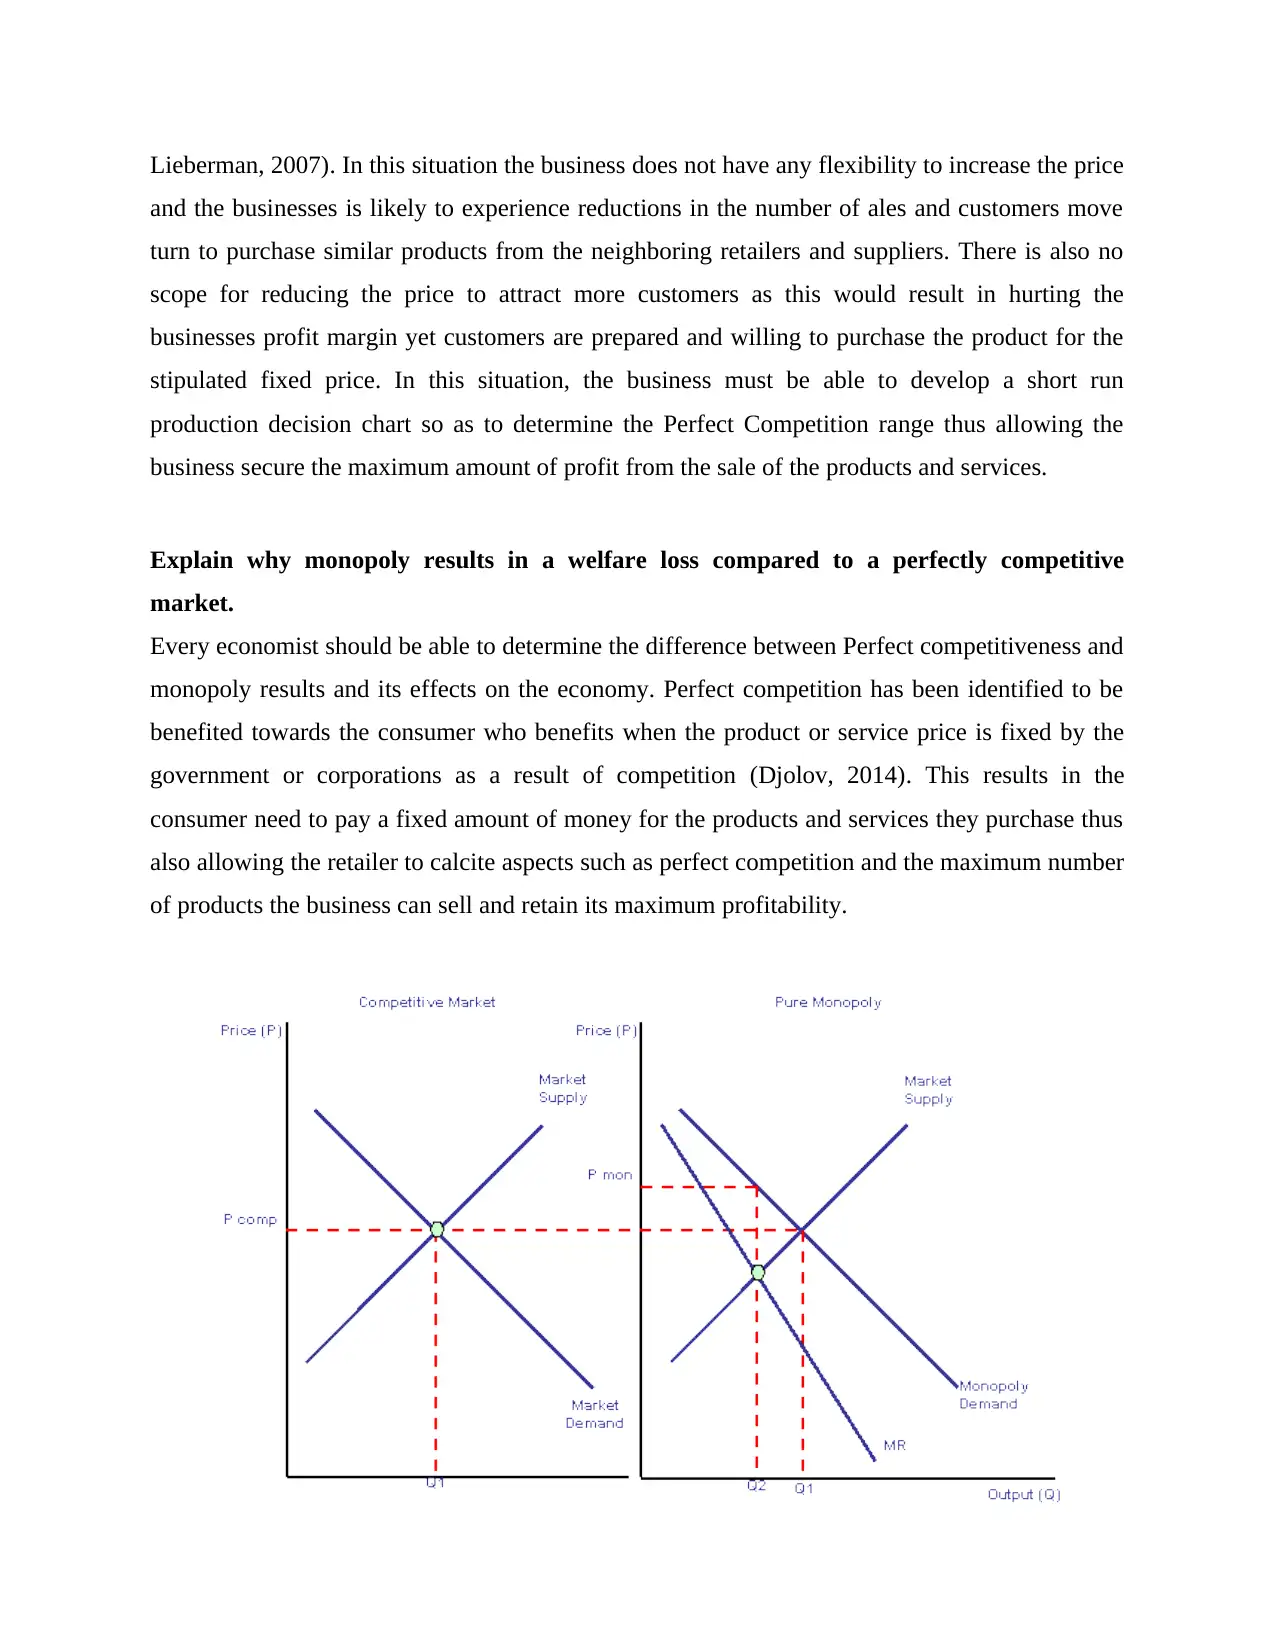
Explain why monopoly results in a welfare loss compared to a perfectly competitive
market.
Every economist should be able to determine the difference between Perfect competitiveness and
monopoly results and its effects on the economy. Perfect competition has been identified to be
benefited towards the consumer who benefits when the product or service price is fixed by the
government or corporations as a result of competition (Djolov, 2014). This results in the
consumer need to pay a fixed amount of money for the products and services they purchase thus
also allowing the retailer to calcite aspects such as perfect competition and the maximum number
of products the business can sell and retain its maximum profitability.
and the businesses is likely to experience reductions in the number of ales and customers move
turn to purchase similar products from the neighboring retailers and suppliers. There is also no
scope for reducing the price to attract more customers as this would result in hurting the
businesses profit margin yet customers are prepared and willing to purchase the product for the
stipulated fixed price. In this situation, the business must be able to develop a short run
production decision chart so as to determine the Perfect Competition range thus allowing the
business secure the maximum amount of profit from the sale of the products and services.
Explain why monopoly results in a welfare loss compared to a perfectly competitive
market.
Every economist should be able to determine the difference between Perfect competitiveness and
monopoly results and its effects on the economy. Perfect competition has been identified to be
benefited towards the consumer who benefits when the product or service price is fixed by the
government or corporations as a result of competition (Djolov, 2014). This results in the
consumer need to pay a fixed amount of money for the products and services they purchase thus
also allowing the retailer to calcite aspects such as perfect competition and the maximum number
of products the business can sell and retain its maximum profitability.
Monopoly, on the other hand, are products and services which are not restricted as a result of
high demand which results in the manufacturer and retailer manipulating the product or service
price as per their requirement without taking into consideration the consumer’s outlook. This will
in most situation results in the products developing an erratic pricing which in most situations
will gradually increase as and the demand surpasses the supply which bad for the community
(McKenzie & Lee, 2008). This s due to the product or service entering into a monopoly state
which results in hurting the common man who may be living at a low budget and therefore
cannot afford to spend extra money to purchase the product or service.
From an economist’s point of view, the monopolistic market also delivers more challenges for
business managers and accountants who need to constantly update their products process so as to
remain within the set profitability and growth threshold. This would require for the business to
generate a report on a monthly basis highlighting the number of sales and profitability which
constantly differ from month to month due to the number and price for the products also being
flexible. In monopoly markets, the profitability (MC) continues increasing as the number of
products sold increase due to there not being any fixed price for the products or services thus
allowing the business to secure unlimited profits from each sale (Mankiw, 2011). On the other
hand, the cost of managing and monitoring the increasing sales and production also increase as
the number of sales increases due to the organization require extra manpower and equipment
which may require being purchases without any long-term planning so as to cover the production
deficit which may occur during periods of high demand.
Conclusion
Charting of sales, productivity and profitability play an important role for every business thus it’s
important for each business to adopt a suitable framework which would allow the business owner
determine the number of products the businesses need to sell so as to secure the maximum
profits. Profitability remains the primary requirement for any businesses thus it's critical to be
able to calcite these aspects which will allow the businesses plan development and expansions in
an organized manner thus helping the businesses secure the highest restores as well as stability in
the market.
⊘ This is a preview!⊘
Do you want full access?
Subscribe today to unlock all pages.
Trusted by 1+ million students worldwide
References:
Austin, D. (2008). Effects of Gasoline Prices on Driving Behavior and Vehicle Markets. Congress of the
U.S., Congressional Budget Office.
Deaton, A., & Muellbauer, J. (1980). Economics and Consumer Behavior. Cambridge University Press.
Djolov, G. G. (2014). The Economics of Competition: The Race to Monopoly. Oxon: Routledge.
Hall, R., & Lieberman, M. (2007). Microeconomics: Principles and Applications. Mason: Cengage
Learning.
Hirshleifer, J., Glazer, A., & Hirshleifer, D. (2005). Price Theory and Applications: Decisions, Markets, and
Information. Cambridge University Press.
Loudon. (2001). Consumer Behavior: Concepts And Applications. Tata McGraw-Hill Education.
Machover, F. (2002). Perfect Competition and the Transformation of Economics. Routledge.
Mankiw, N. G. (2011). Principles of Microeconomics. Cengage Learning.
McEachern, W. A. (2013). Economics: A Contemporary Introduction. Cengage Learning,.
McKenzie, R. B., & Lee, D. R. (2008). In Defense of Monopoly: How Market Power Fosters Creative
Production. University of Michigan Press.
Richard Lipsey, A. C. (2015). Economics. Oxford: Oxford University Press.
Shaw, G. (2014). The Art of Business Communication: How to use pictures, charts and graphs to make
your business message stick. Pearson UK.
1 out of 10
Related Documents


Your All-in-One AI-Powered Toolkit for Academic Success.
+13062052269
info@desklib.com
Available 24*7 on WhatsApp / Email
![[object Object]](/_next/static/media/star-bottom.7253800d.svg)
Unlock your academic potential
Copyright © 2020–2026 A2Z Services. All Rights Reserved. Developed and managed by ZUCOL.