Contemporary Business Economics Analysis: Demand, Supply, and Theories
VerifiedAdded on 2023/01/05
|19
|4031
|70
Report
AI Summary
This report provides a comprehensive overview of contemporary business economics, focusing on the laws of demand and supply. It explains the law of demand, movements along the demand curve, and factors causing shifts in the demand curve, supported by diagrams. The report also covers the law of supply, movement along the supply curve, and factors affecting the supply curve. Furthermore, it delves into 20th-century and 21st-century economic theories, including the theories of Karl Marx, the Steady Model, and Neo-Classical Sociology. The analysis includes discussions on behavioral economics and its implications. The report uses the oil industry as a reference point for understanding the concepts of demand, supply, and the application of various economic theories.
Contemporary Business
Economics
Economics
Paraphrase This Document
Need a fresh take? Get an instant paraphrase of this document with our AI Paraphraser
Table of Contents
Introduction......................................................................................................................................3
Task 1...............................................................................................................................................4
EXPLAIN THE LAW OF DEMAND, MOVEMENT ALONG THE SAME DEMAND
CURVE (WITH THE AID OF DIAGRAM) AND CHANGE IN DEMAND CURVE WITH
FACTORS (WITH THE AID OF DIAGRAM)..........................................................................4
EXPLAIN THE LAW OF SUPPLY, MOVEMENT ALONG THE SAME SUPPLYCURVE
AND CHANGES IN SUPPLY CURVE WITH ITS FACTORS................................................8
TASK 2..........................................................................................................................................11
20th century economics theories and 21st century economic theories........................................11
Conclusion.....................................................................................................................................18
Introduction
Economics is a concept that governs the creation, distribution and use of elements of products
and businesses. This idea can be divided into two general classifications; macroeconomics and
microeconomics. It studies the behavior of aggregate economy (Spencer, 1990).
Contemporary business research is characterized by the modernization of business strategies in
the modern world. It involves acquiring cutting-edge strategies to increase the company's profits
(Spencer, 1990).
This assessment is linked to the clarification of the participation law and its flexibility in the
context of the oil industry. Specification 2, as a mirror studied somewhere in the 20th and 21st
centuries, arises from ideas and models. In addition to this view of contemporary financial
aspects, the ideas of the twentieth century were also explored.
In this evaluation, the oil industry was taken as a reference to understand the different notion of
interest and the law of grace.
⊘ This is a preview!⊘
Do you want full access?
Subscribe today to unlock all pages.
Trusted by 1+ million students worldwide
Task 1
EXPLAIN THE LAW OF DEMAND, MOVEMENT ALONG THE SAME DEMAND
CURVE (WITH THE AID OF DIAGRAM) AND CHANGE IN DEMAND CURVE WITH
FACTORS (WITH THE AID OF DIAGRAM)
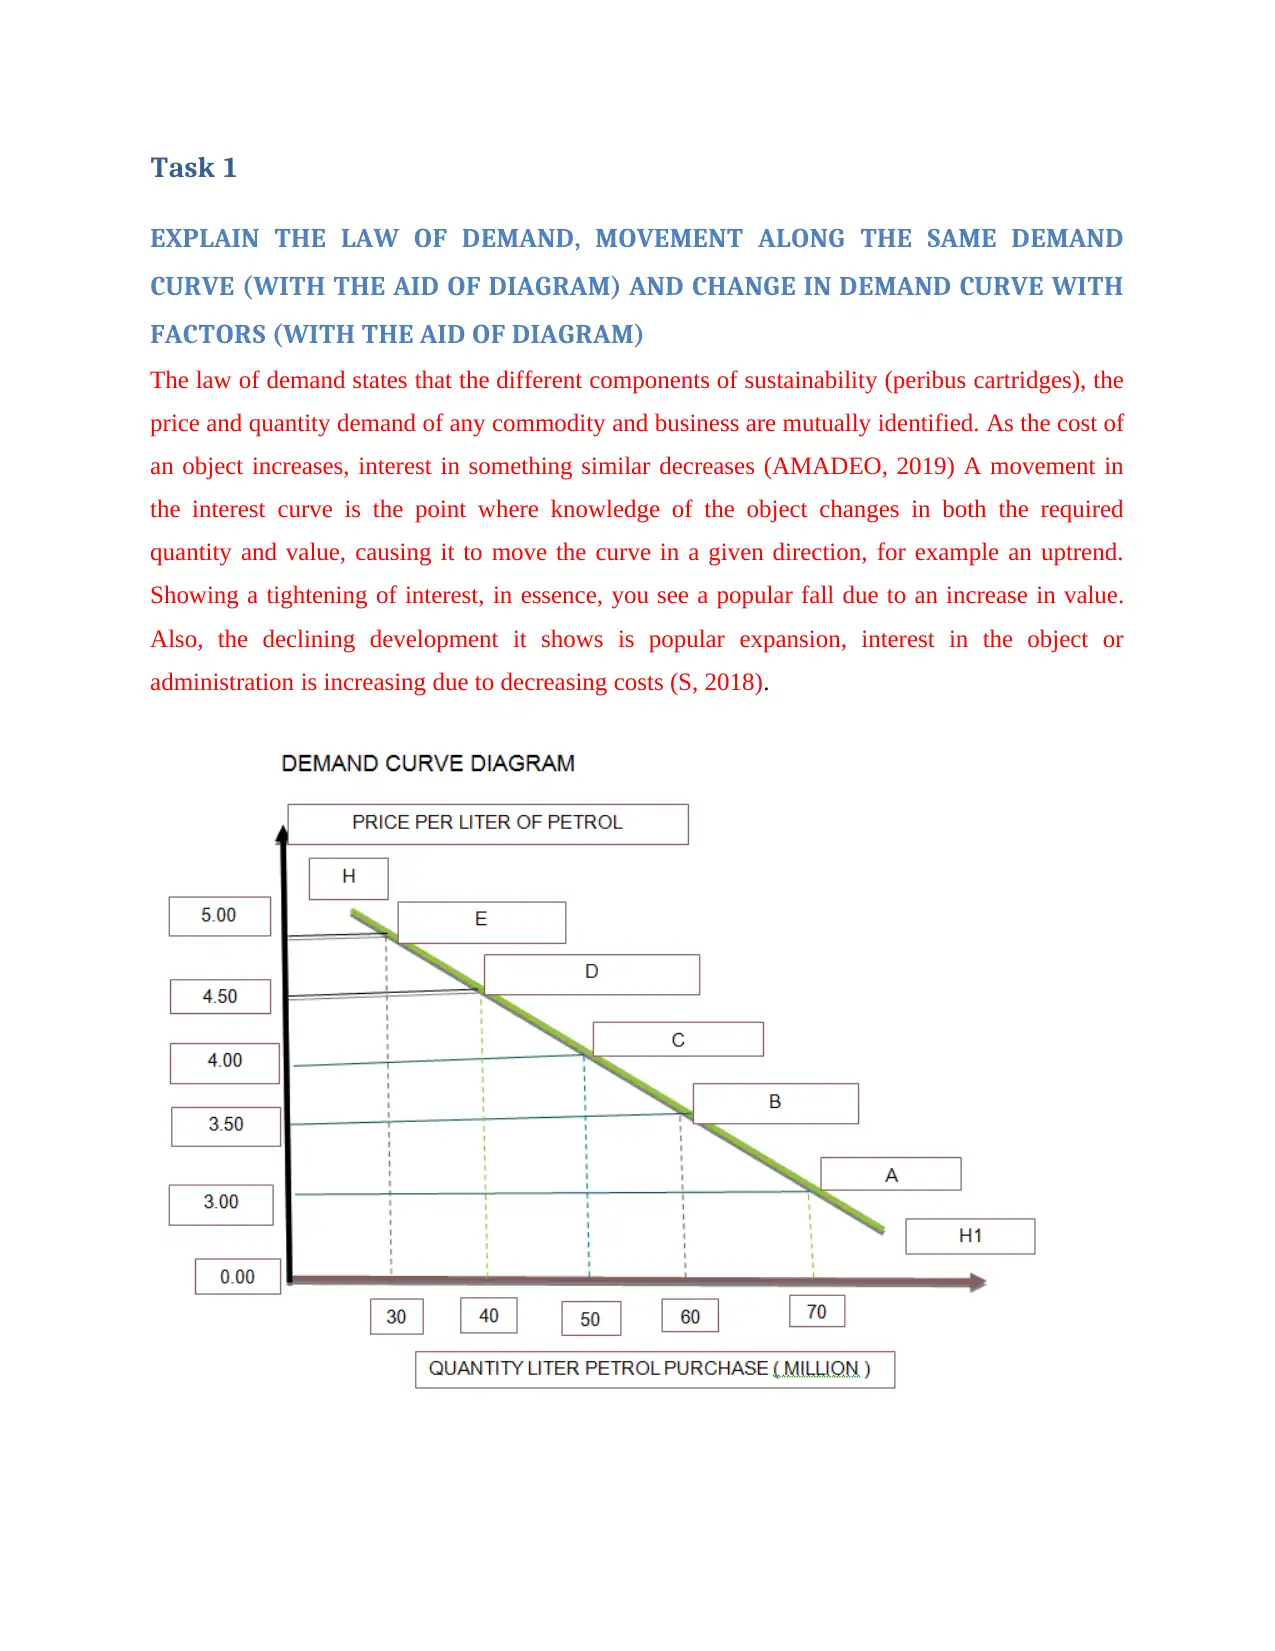
The law of demand states that the different components of sustainability (peribus cartridges), the
price and quantity demand of any commodity and business are mutually identified. As the cost of
an object increases, interest in something similar decreases (AMADEO, 2019) A movement in
the interest curve is the point where knowledge of the object changes in both the required
quantity and value, causing it to move the curve in a given direction, for example an uptrend.
Showing a tightening of interest, in essence, you see a popular fall due to an increase in value.
Also, the declining development it shows is popular expansion, interest in the object or
administration is increasing due to decreasing costs (S, 2018).
EXPLAIN THE LAW OF DEMAND, MOVEMENT ALONG THE SAME DEMAND
CURVE (WITH THE AID OF DIAGRAM) AND CHANGE IN DEMAND CURVE WITH
FACTORS (WITH THE AID OF DIAGRAM)
The law of demand states that the different components of sustainability (peribus cartridges), the
price and quantity demand of any commodity and business are mutually identified. As the cost of
an object increases, interest in something similar decreases (AMADEO, 2019) A movement in
the interest curve is the point where knowledge of the object changes in both the required
quantity and value, causing it to move the curve in a given direction, for example an uptrend.
Showing a tightening of interest, in essence, you see a popular fall due to an increase in value.
Also, the declining development it shows is popular expansion, interest in the object or
administration is increasing due to decreasing costs (S, 2018).
Paraphrase This Document
Need a fresh take? Get an instant paraphrase of this document with our AI Paraphraser
The table above shows that when the cost was £ 5 per liter, 30 liters was required. When you find
that the cost drops to £ 4.50, interest goes up to 40 liters. Also, when the cost drops to £ 3.00,
interest will rise to 70 liters. Contrary to many people's expectations, with costs rising from £
3.00, interest is down from 70 liters (Whelan and Msefer, 1996). In the figure, point E of the
HH1 interest curve shows interest for 30 liters at £ 5.00. When the value falls to £ 4.50, £ 4.00, £
3.50, £ 3.00 the interest will rise to 40, 50, 60, 70 liters as usual. This is evident from the focus of
D, C, B and A. In this way, the decline in interest H, H1 indicates an expansion that oil is
seeking as its costs decline. This illustrates the precarious link between cost and demand.
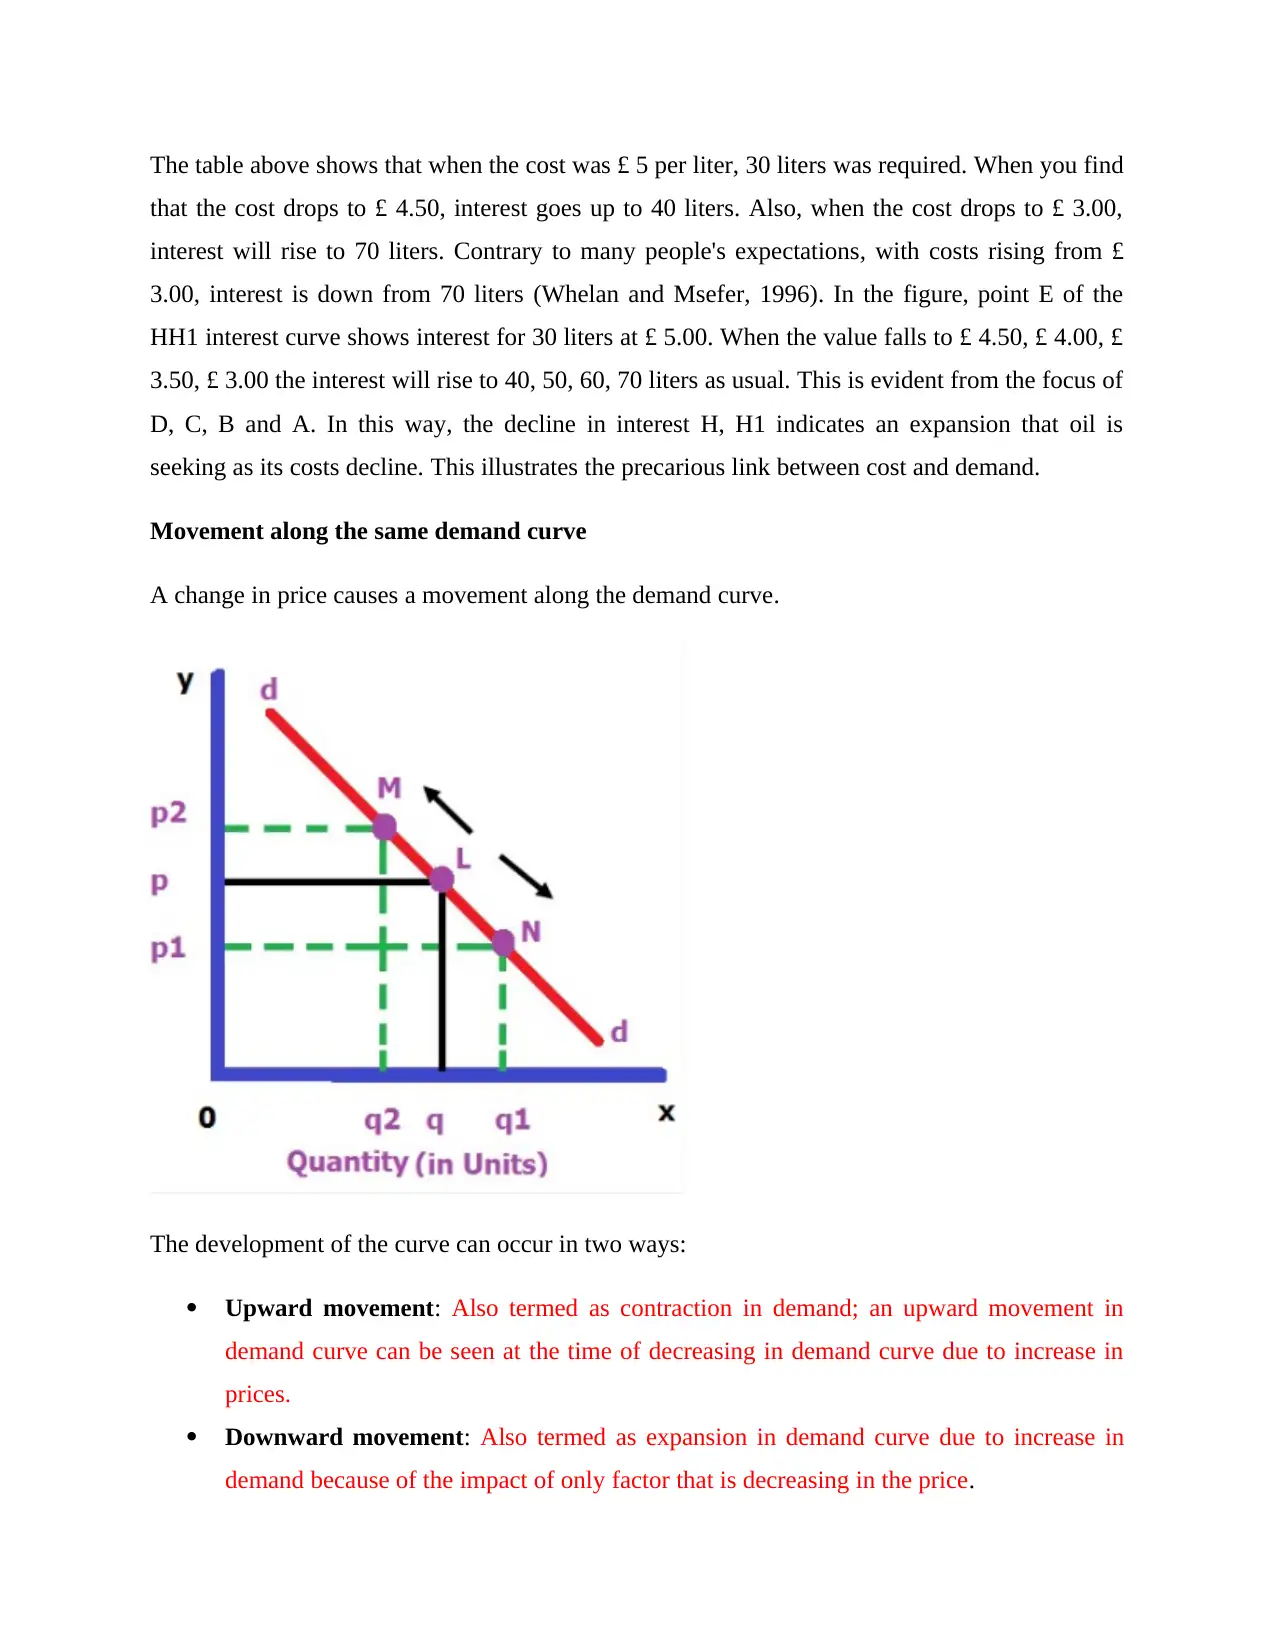
Movement along the same demand curve
A change in price causes a movement along the demand curve.
The development of the curve can occur in two ways:
Upward movement: Also termed as contraction in demand; an upward movement in
demand curve can be seen at the time of decreasing in demand curve due to increase in
prices.
Downward movement: Also termed as expansion in demand curve due to increase in
demand because of the impact of only factor that is decreasing in the price.
that the cost drops to £ 4.50, interest goes up to 40 liters. Also, when the cost drops to £ 3.00,
interest will rise to 70 liters. Contrary to many people's expectations, with costs rising from £
3.00, interest is down from 70 liters (Whelan and Msefer, 1996). In the figure, point E of the
HH1 interest curve shows interest for 30 liters at £ 5.00. When the value falls to £ 4.50, £ 4.00, £
3.50, £ 3.00 the interest will rise to 40, 50, 60, 70 liters as usual. This is evident from the focus of
D, C, B and A. In this way, the decline in interest H, H1 indicates an expansion that oil is
seeking as its costs decline. This illustrates the precarious link between cost and demand.
Movement along the same demand curve
A change in price causes a movement along the demand curve.
The development of the curve can occur in two ways:
Upward movement: Also termed as contraction in demand; an upward movement in
demand curve can be seen at the time of decreasing in demand curve due to increase in
prices.
Downward movement: Also termed as expansion in demand curve due to increase in
demand because of the impact of only factor that is decreasing in the price.
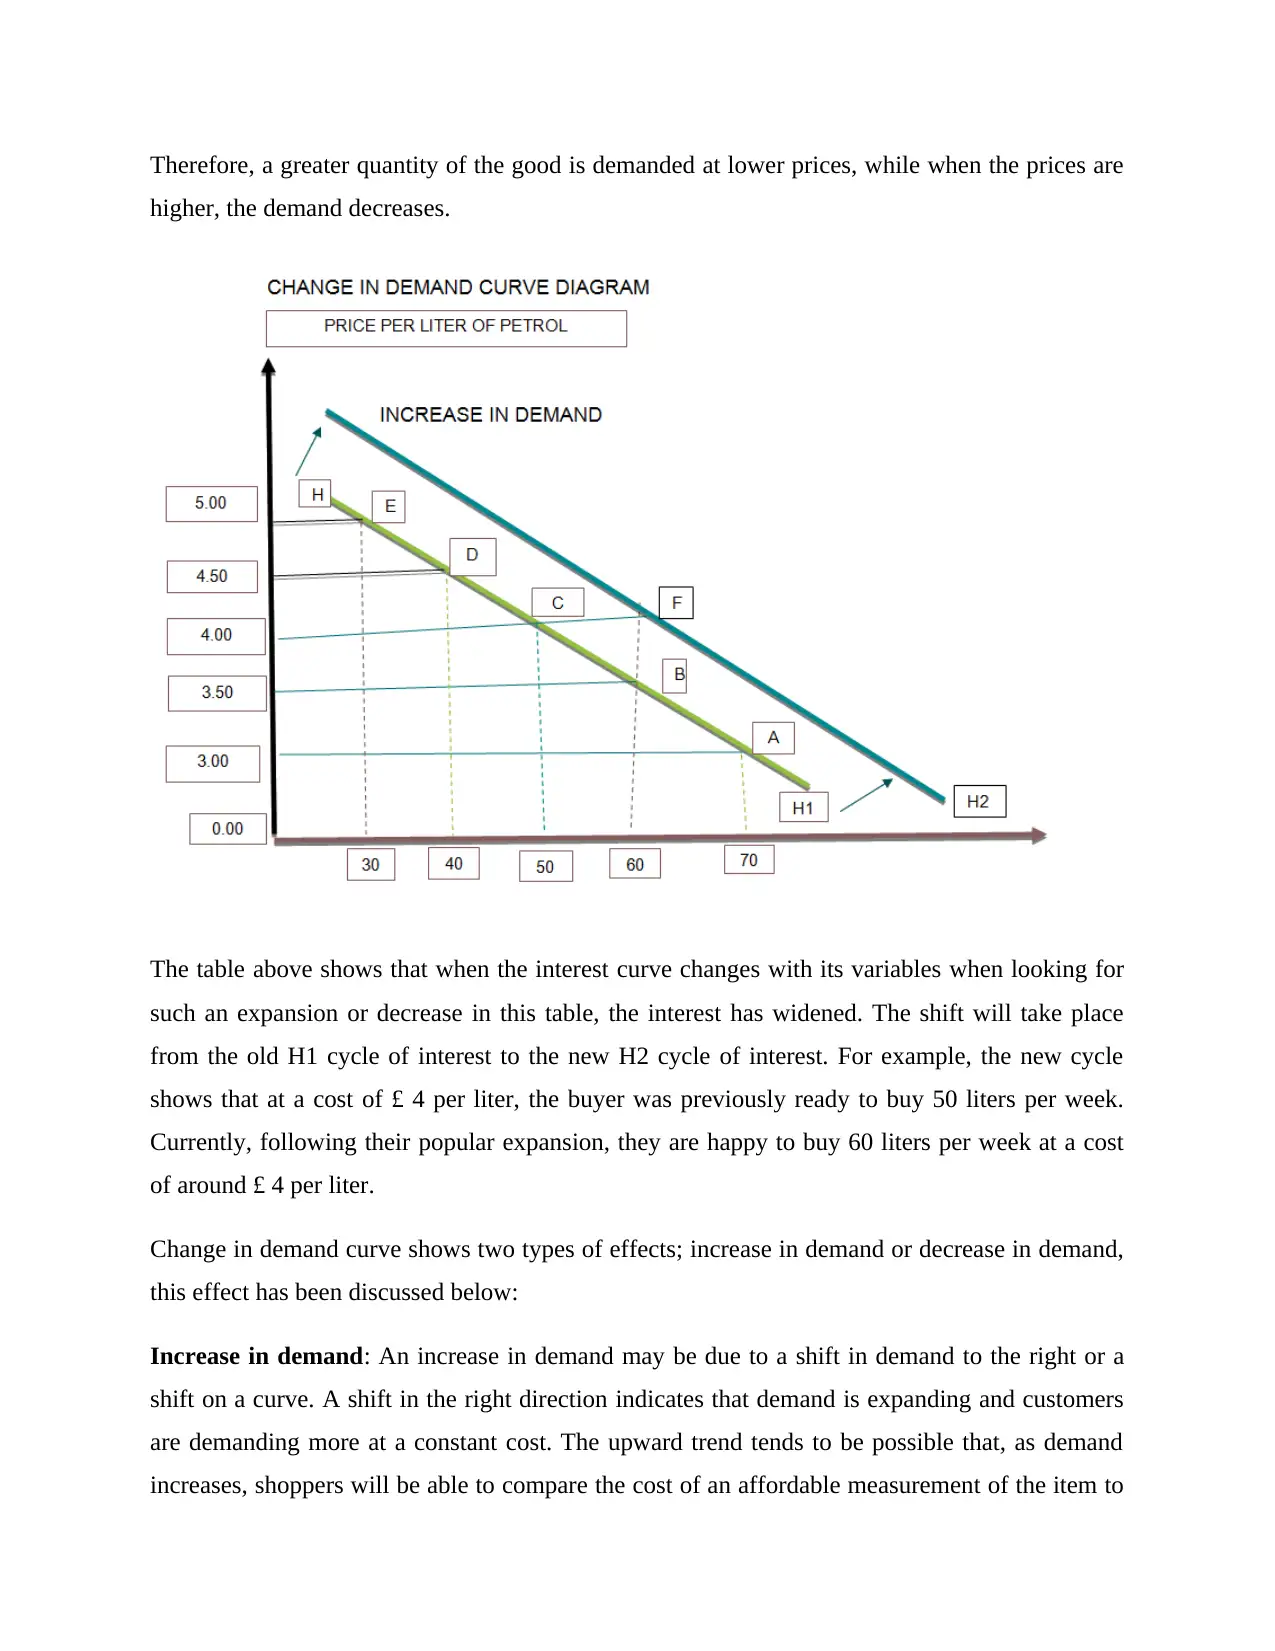
Therefore, a greater quantity of the good is demanded at lower prices, while when the prices are
higher, the demand decreases.
The table above shows that when the interest curve changes with its variables when looking for
such an expansion or decrease in this table, the interest has widened. The shift will take place
from the old H1 cycle of interest to the new H2 cycle of interest. For example, the new cycle
shows that at a cost of £ 4 per liter, the buyer was previously ready to buy 50 liters per week.
Currently, following their popular expansion, they are happy to buy 60 liters per week at a cost
of around £ 4 per liter.
Change in demand curve shows two types of effects; increase in demand or decrease in demand,
this effect has been discussed below:
Increase in demand: An increase in demand may be due to a shift in demand to the right or a
shift on a curve. A shift in the right direction indicates that demand is expanding and customers
are demanding more at a constant cost. The upward trend tends to be possible that, as demand
increases, shoppers will be able to compare the cost of an affordable measurement of the item to
⊘ This is a preview!⊘
Do you want full access?
Subscribe today to unlock all pages.
Trusted by 1+ million students worldwide
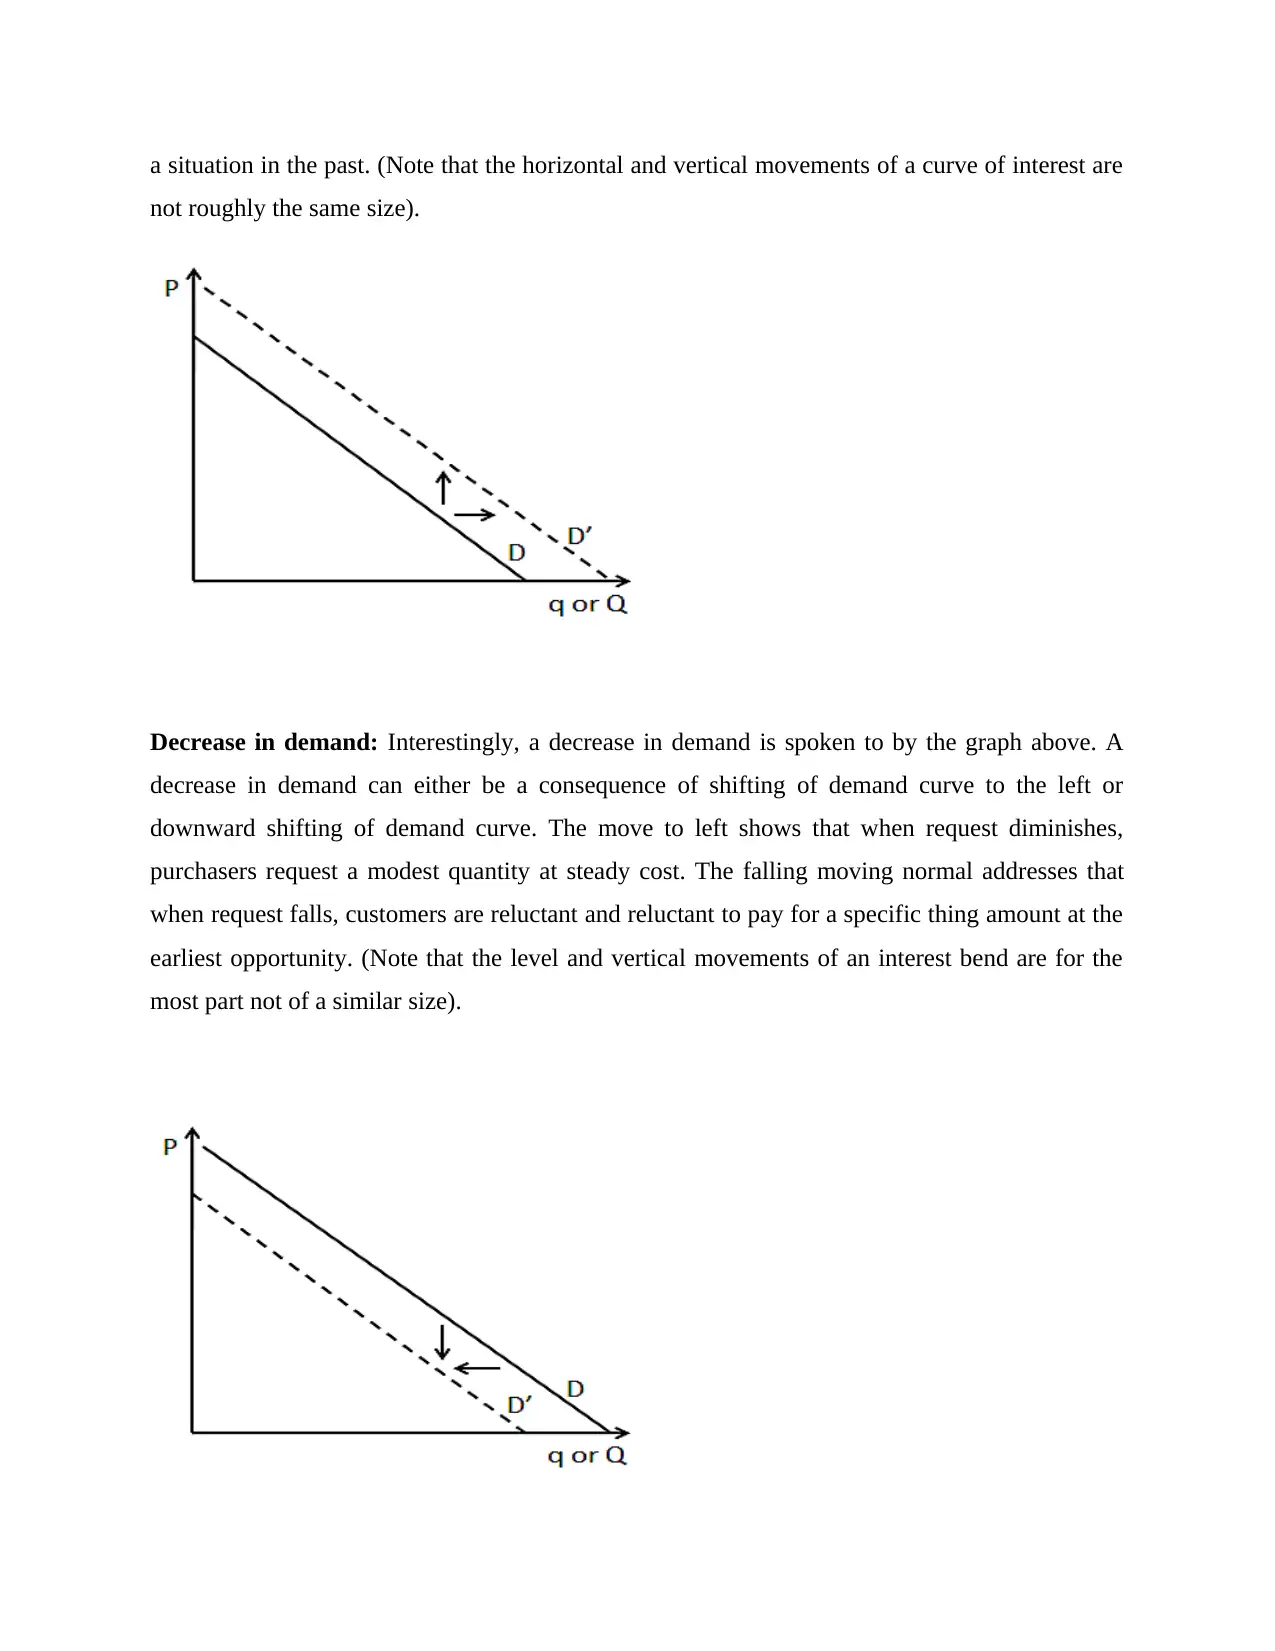
a situation in the past. (Note that the horizontal and vertical movements of a curve of interest are
not roughly the same size).
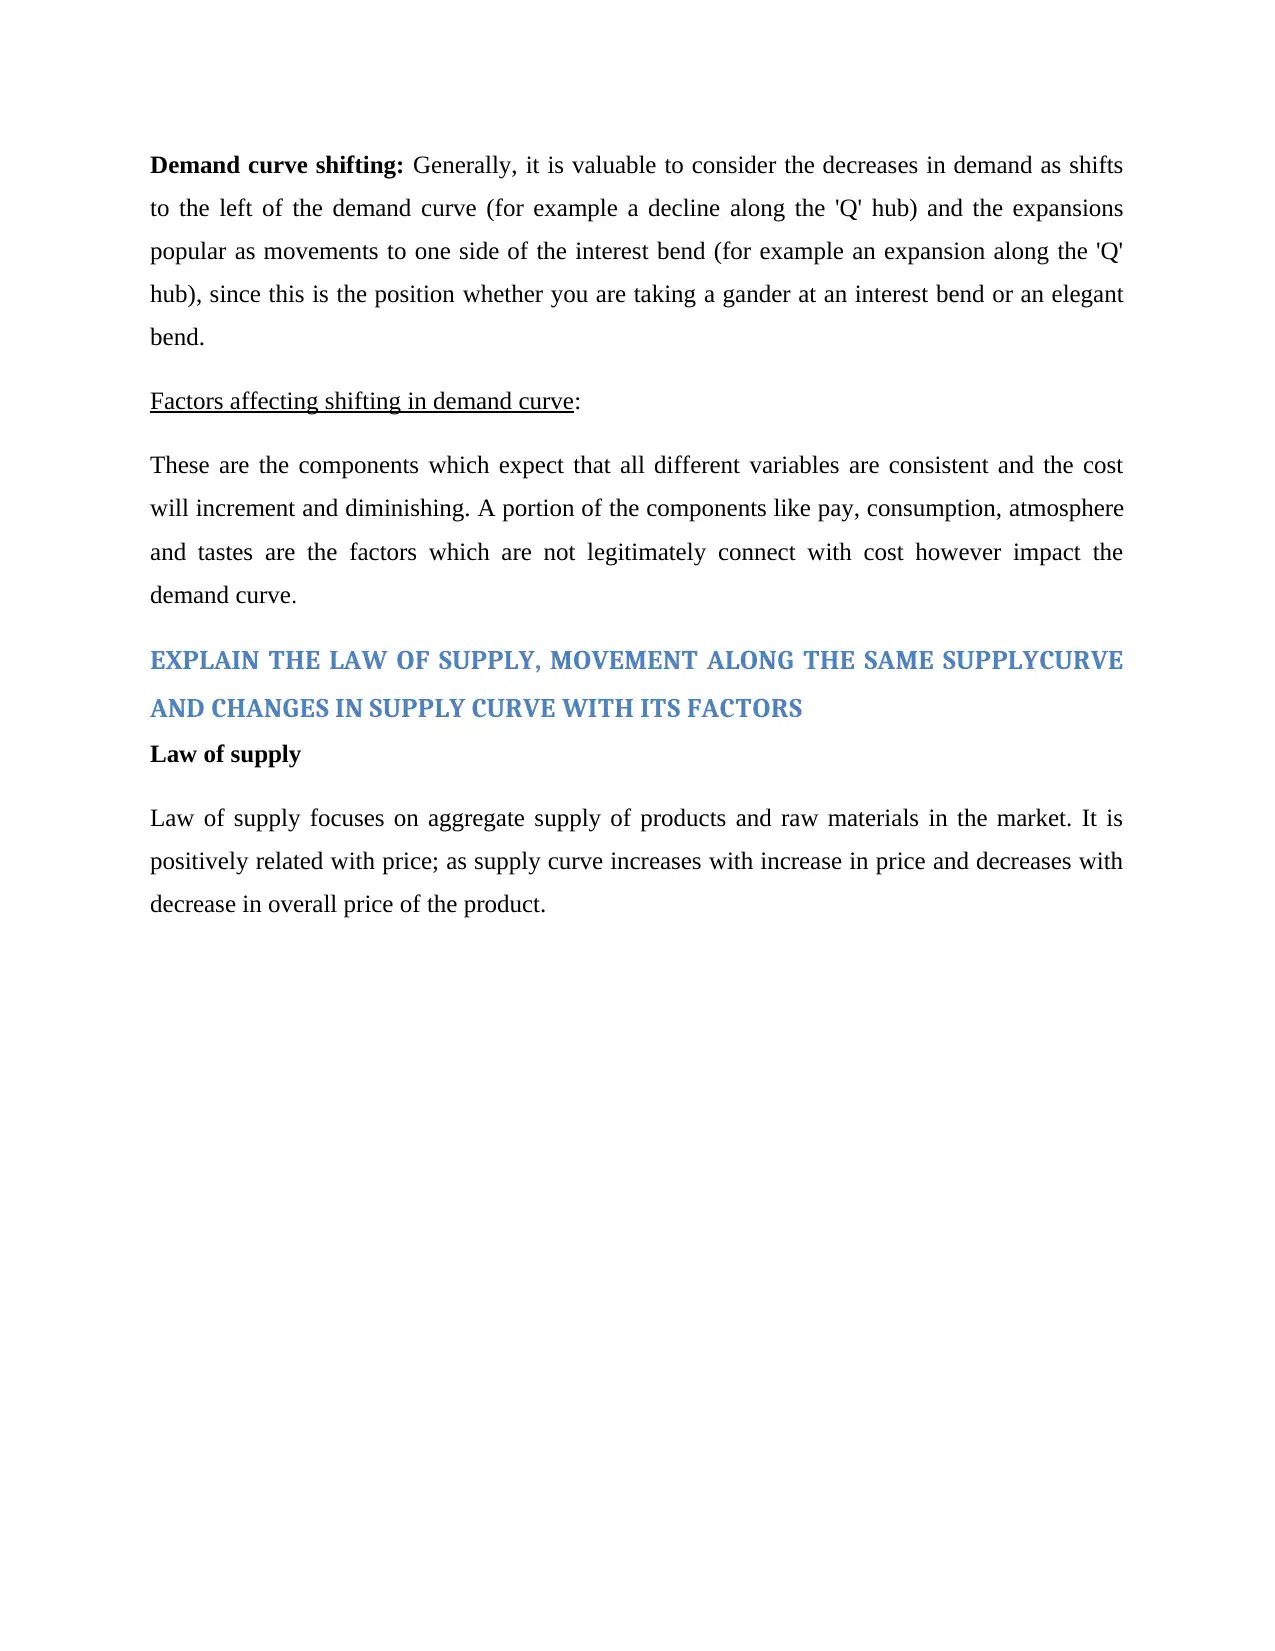
Decrease in demand: Interestingly, a decrease in demand is spoken to by the graph above. A
decrease in demand can either be a consequence of shifting of demand curve to the left or
downward shifting of demand curve. The move to left shows that when request diminishes,
purchasers request a modest quantity at steady cost. The falling moving normal addresses that
when request falls, customers are reluctant and reluctant to pay for a specific thing amount at the
earliest opportunity. (Note that the level and vertical movements of an interest bend are for the
most part not of a similar size).
not roughly the same size).
Decrease in demand: Interestingly, a decrease in demand is spoken to by the graph above. A
decrease in demand can either be a consequence of shifting of demand curve to the left or
downward shifting of demand curve. The move to left shows that when request diminishes,
purchasers request a modest quantity at steady cost. The falling moving normal addresses that
when request falls, customers are reluctant and reluctant to pay for a specific thing amount at the
earliest opportunity. (Note that the level and vertical movements of an interest bend are for the
most part not of a similar size).
Paraphrase This Document
Need a fresh take? Get an instant paraphrase of this document with our AI Paraphraser
Demand curve shifting: Generally, it is valuable to consider the decreases in demand as shifts
to the left of the demand curve (for example a decline along the 'Q' hub) and the expansions
popular as movements to one side of the interest bend (for example an expansion along the 'Q'
hub), since this is the position whether you are taking a gander at an interest bend or an elegant
bend.
Factors affecting shifting in demand curve:
These are the components which expect that all different variables are consistent and the cost
will increment and diminishing. A portion of the components like pay, consumption, atmosphere
and tastes are the factors which are not legitimately connect with cost however impact the
demand curve.
EXPLAIN THE LAW OF SUPPLY, MOVEMENT ALONG THE SAME SUPPLYCURVE
AND CHANGES IN SUPPLY CURVE WITH ITS FACTORS
Law of supply
Law of supply focuses on aggregate supply of products and raw materials in the market. It is
positively related with price; as supply curve increases with increase in price and decreases with
decrease in overall price of the product.
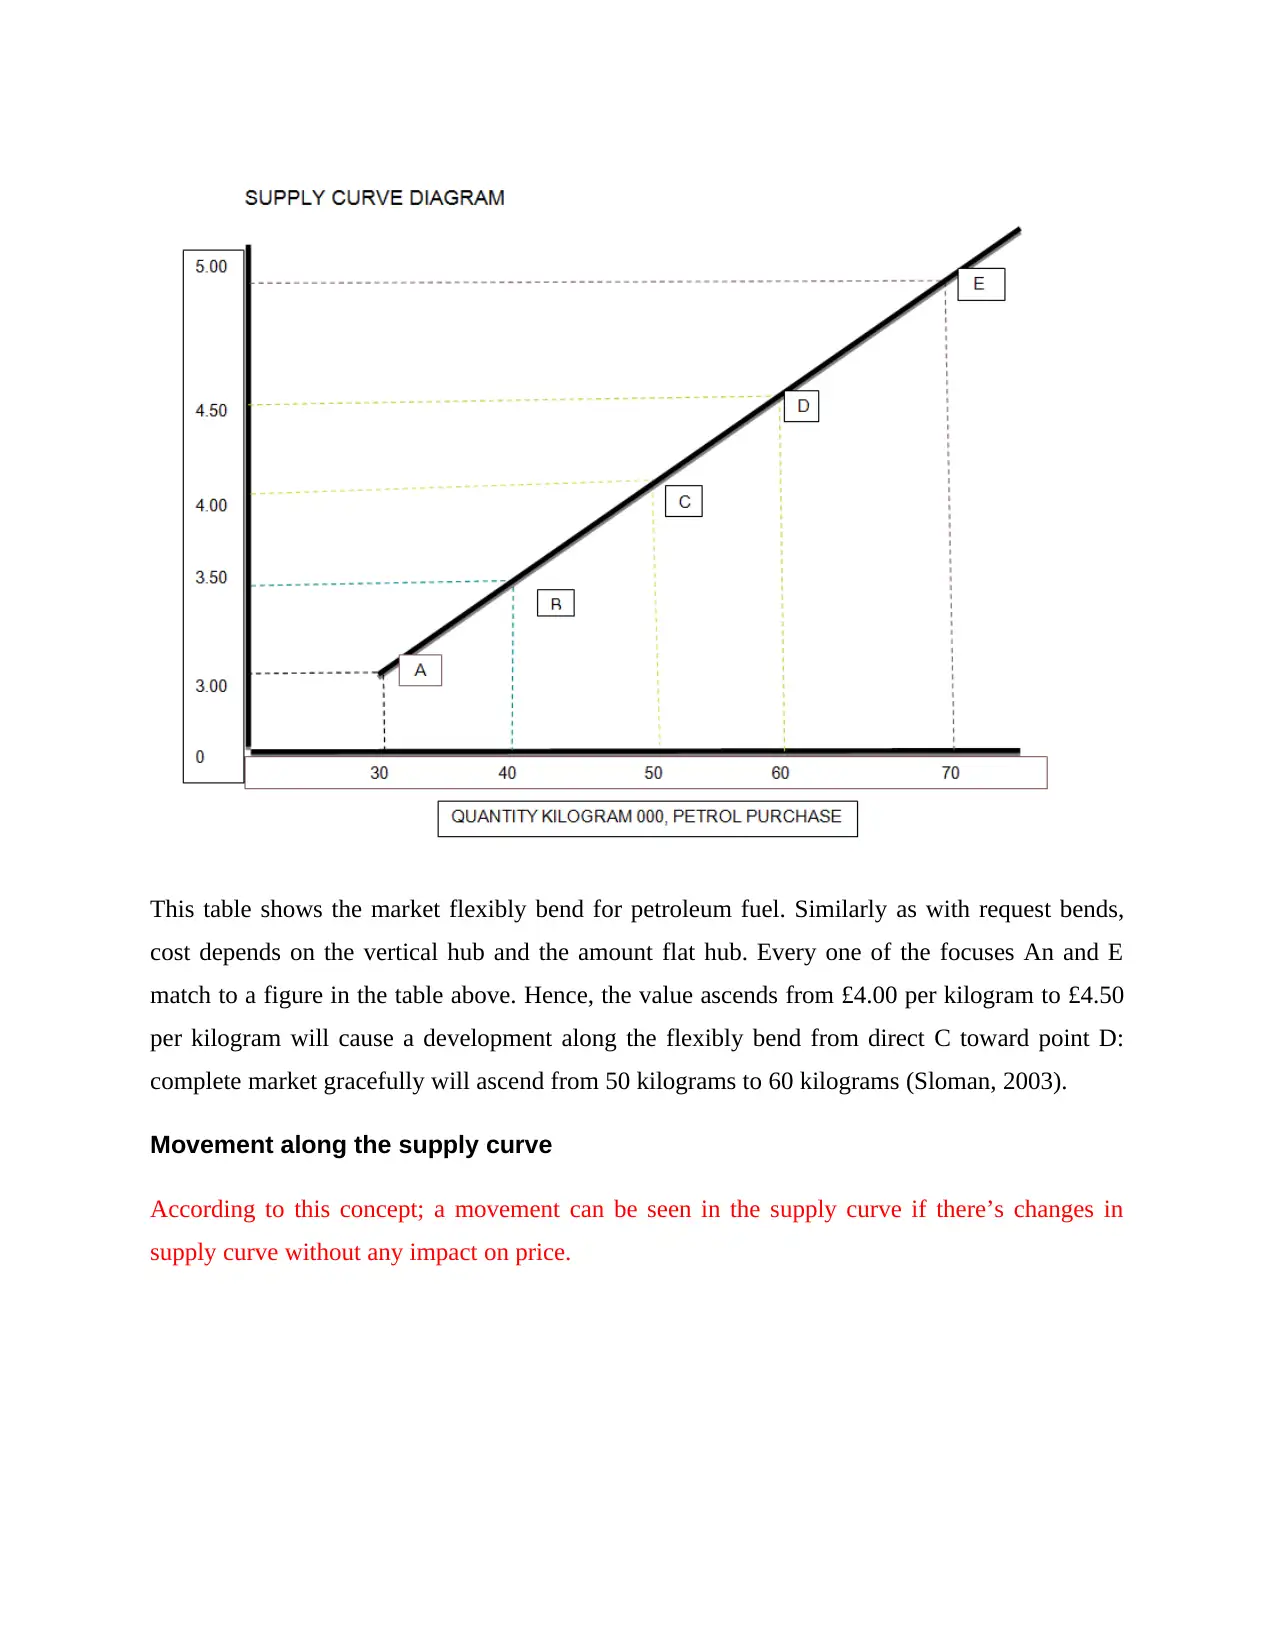
This table shows the market flexibly bend for petroleum fuel. Similarly as with request bends,
cost depends on the vertical hub and the amount flat hub. Every one of the focuses An and E
match to a figure in the table above. Hence, the value ascends from £4.00 per kilogram to £4.50
per kilogram will cause a development along the flexibly bend from direct C toward point D:
complete market gracefully will ascend from 50 kilograms to 60 kilograms (Sloman, 2003).
Movement along the supply curve
According to this concept; a movement can be seen in the supply curve if there’s changes in
supply curve without any impact on price.
⊘ This is a preview!⊘
Do you want full access?
Subscribe today to unlock all pages.
Trusted by 1+ million students worldwide
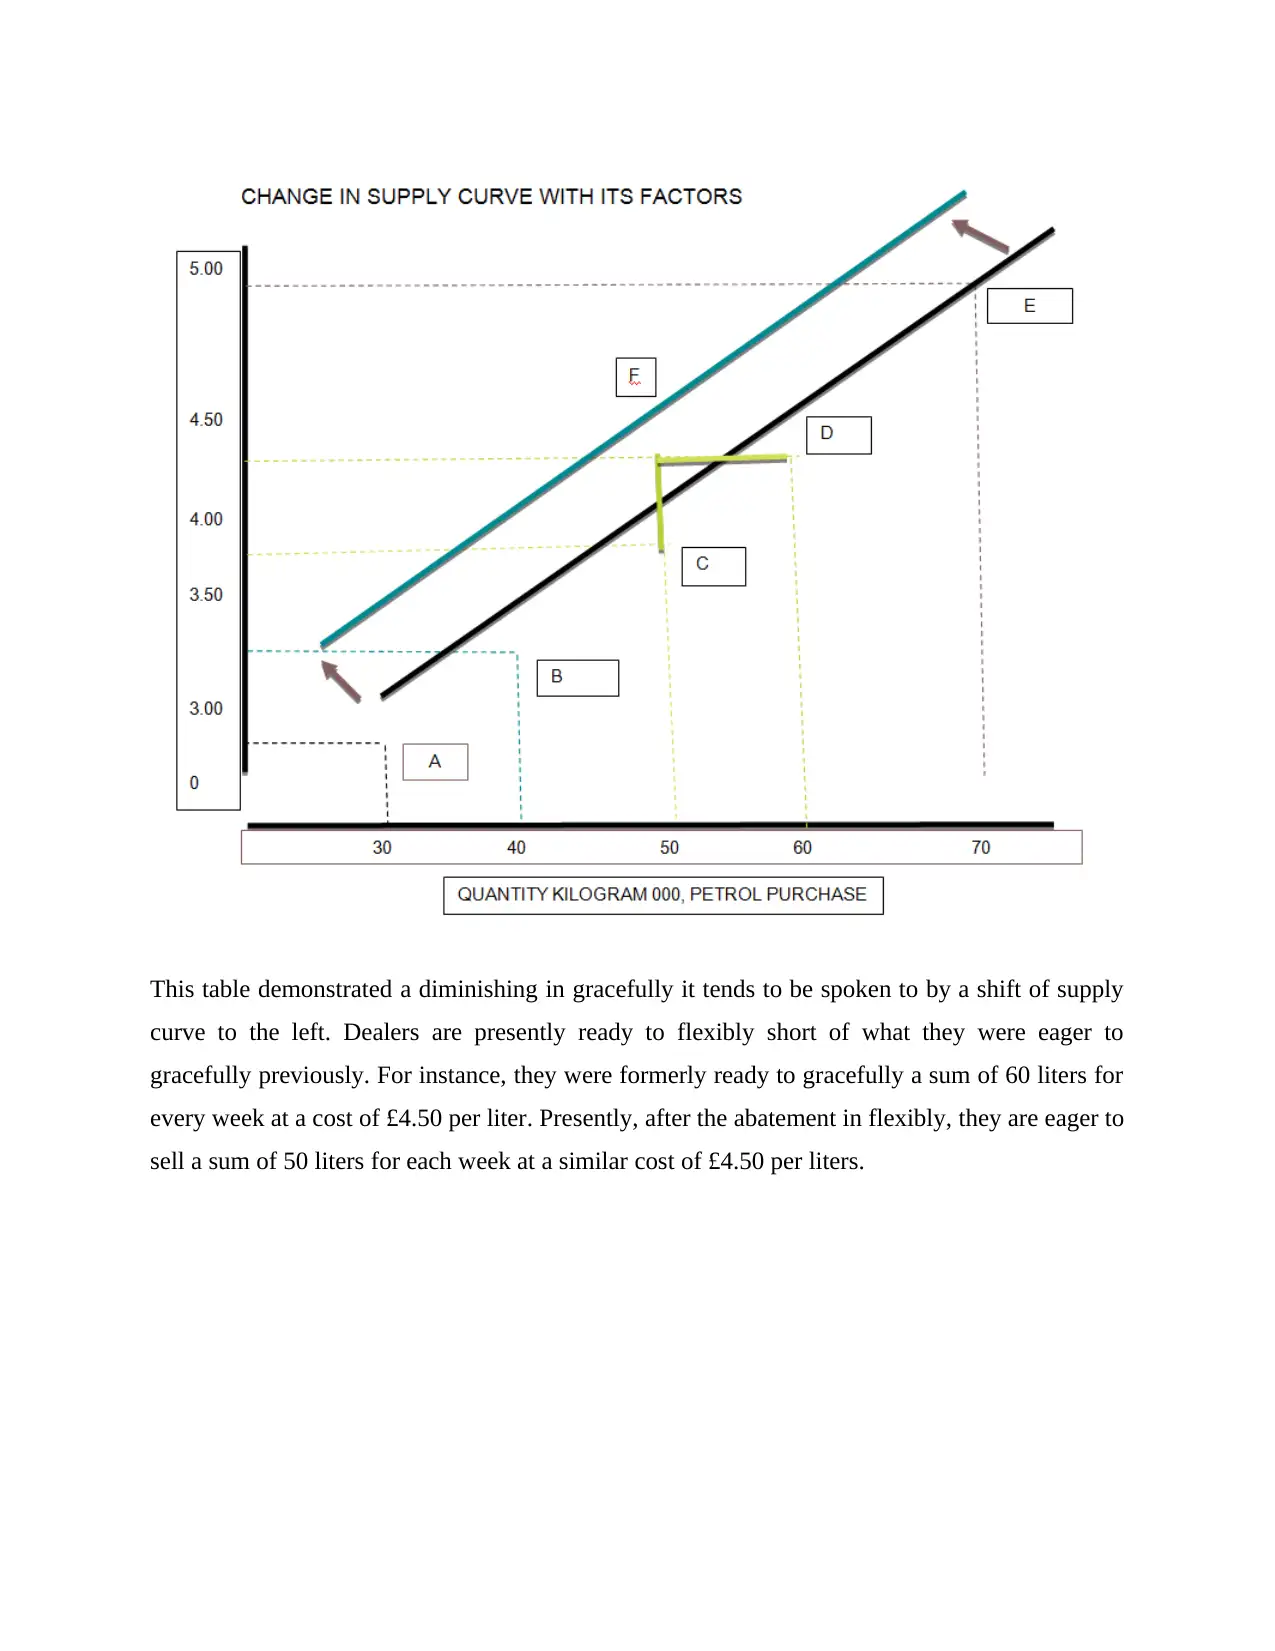
This table demonstrated a diminishing in gracefully it tends to be spoken to by a shift of supply
curve to the left. Dealers are presently ready to flexibly short of what they were eager to
gracefully previously. For instance, they were formerly ready to gracefully a sum of 60 liters for
every week at a cost of £4.50 per liter. Presently, after the abatement in flexibly, they are eager to
sell a sum of 50 liters for each week at a similar cost of £4.50 per liters.
Paraphrase This Document
Need a fresh take? Get an instant paraphrase of this document with our AI Paraphraser
TASK 2
20th century economics theories and 21st century economic theories
Karl Max Theory
Karl Marx in the work hypothesis of significant worth to clarify relative contrasts in market
costs. This thought proposed that a lot of cash produced can be assessed to be estimated fair-
mindedly by the normal number of hours attempted to convey it. As it were, on the off chance
that a table accepts twice the length of a seat, at that point the table ought to show up twice as
significant (Marx, 1972).
Steady Model
The steady model methodology expresses that workers are self-propelled and have worth and
understanding to add to the association, past their everyday job. It is worked around the idea of
initiative.
In this model, the idea of initiative is given an administrative perspective, where the
administrator really drives his/her representatives by setting genuine models, being accessible
and by being associated with the different work errands.
All in all, the chief endeavors to make a steady working environment for the laborers (Kadak,
2011).
Neo-old style sociology has a common power in monetary reasoning and political for quite a
long while. It gets ready thin financial laws concerning production and use through the count of
significant worth and benefit at the edge. Clients and firms square measure each verifiable to act
carefully, clients increase their getting power by leveling the worth per pound spent, while
makers will abuse incomes in every antique and work commercial centers. Neo-traditional
sociology trusts inside the idea of harmony hence the impact of the monetary cycle to
acknowledge affordable sharing of assets.
The neo-classical model of behavior is developed on these assumptions:
Agents opt for severally
An agent has set up tastes and preferences
Agents gather entire data on preferences decisions
Agents continuously construct exceptional selection given his/her preferences
This isn't just a miniature model (related for example with the quality hypothesis of the firm), it's
conjointly the motivation of a plentiful of political economy for example objective desires
hypothesis. In elective words, neo-old style sociology has been for a long time to "Homo
Economicus" (a selfish and utility-boosting, unboundedly-sound agent) (Spencer, 1990),
The rising evaluate of neo-traditional sociology came first from financial analysts UN
organization addressed whether there was finished information. Akerlof and Stiglitz
demonstrated that specialists could experience the ill effects of datafailure, for instance,square
measure a few insights deviations and this could cause problematic decisions. nonetheless, in
their work operators were as yet expected to frame the 'best' determination given information
required. Crafted by Stiglitz and Akerl of delayed the common sense regular hypothesis and has
been wide retained into thought sociology, especially strategies intended to adjust the
information available to clients once the govt. is endeavoring to change the utilization of
advantage and de-merit merchandise (Spencer, 1990).
Simon in an imperative paper imprinted in 1955 the curious of neo-old style sociology along
with thought limited sanity. Most clients and organizations square measure incapable to frame
completely educated decisions once making decisions and consequently the expanding
multifaceted nature of product makes life inconvenient people have limited abilities to focus and
handle capacity limited reasonability proposes that purchasers and organizations favor acting as
opposed to amplifying they'll utilize dependable guidelines (known as heuristics) and gauges
once dynamic across totally various business sectors action financial specialists signify that
limited discernment is definitely not a comparative as delirium, because of leaders square
measure actually making an endeavor to shape as levelheaded a decision as doable (Spencer,
1990).
Conduct sociology began to arise with the noteworthy work of Kahneman and Tversky (again
each granted the scientist for sociology however Tversky kicked the bucket before it had been
given). 'Specialists reason inadequately and act normally with regards to Kahneman. This read
basically established upon different investigates during which there's a 'judicious' answer anyway
⊘ This is a preview!⊘
Do you want full access?
Subscribe today to unlock all pages.
Trusted by 1+ million students worldwide
1 out of 19
Related Documents


Your All-in-One AI-Powered Toolkit for Academic Success.
+13062052269
info@desklib.com
Available 24*7 on WhatsApp / Email
![[object Object]](/_next/static/media/star-bottom.7253800d.svg)
Unlock your academic potential
Copyright © 2020–2026 A2Z Services. All Rights Reserved. Developed and managed by ZUCOL.