Business Economics Report: Monopoly, Elasticity, and Monetary Policy
VerifiedAdded on 2022/12/30
|15
|2633
|2
Report
AI Summary
This business economics report provides a comprehensive analysis of microeconomic and macroeconomic principles. It begins by examining monopolies, government regulations, and their impact on market structures, including the behavior of companies and the determination of equilibrium prices and quantities. The report then delves into the concept of price elasticity of demand, illustrating its effect on decision-making and market dynamics. Further, it analyzes income elasticity of demand for concert and bus tickets and explores labor supply curves, considering the impact of immigration and other factors. The report also addresses the external effects of environmental issues, specifically the leakage of uranium from mines. It also analyzes the SARC curve and monetary policy tools used by central banks, including interest rate management, and the impact of financial crises, such as the 2008-2009 global recession, on the UK economy. The report concludes with an examination of government interventions during financial crises.
BUSINESS ECONOMICS
Paraphrase This Document
Need a fresh take? Get an instant paraphrase of this document with our AI Paraphraser
Table of Contents
INTRODUCTION...........................................................................................................................3
MAIN BODY...................................................................................................................................3
PART. A .....................................................................................................................................3
PART B........................................................................................................................................9
CONCLUSION..............................................................................................................................12
REFERENCES................................................................................................................................1
INTRODUCTION
MAIN BODY
Micro economic is the study of individual and business demand and supply of goods and
services while the macro economics shows the decision of the government and countries and
aggregate demand and aggregate supply of goods and service as a whole (Arunwarakorn,
Suthiwartnarueput, Pornchaiwiseskul, 2017). These report shows the income elasticity , labour
supply curve, quantity demand and supplied at different prices and also SARC curve and the
labour curve with some case studies.
PART. A
Question1
Monopoly is the problematic for an economy or government because due to monopoly of
the company they create many problems in the country and to the people who are consuming
their products. For example when the Standard oil and American Tobacco till 1911 they are
leading the country and which makes them monopolistic in the market but after 1911 many
antitrust cases are filed against the company after the Sherman Antitrust Act 1890 formed. The
government have taken certain steps to restrict the companies who have major market share or
ruling the market as a monopoly and taking actions for any breaking of law by these companies.
This also continue with the American Telephone and Telephone company which violet the U. S
antitrust law at a time when they rule as a monopoly and as a result in splitting the company into
six subsidies known as Baby Bells curbs by the government of America for those companies
which are breaking the laws. Government have been introduced the various regulation factors
that are affecting the monopoly companies, the company which was affected by those regulation
is De Beer company which was known for the mining, production and retails company in the
world. But due to government regulation there been declining in the market share of the
company from 80% in the 1980s to 35% in 2019. whereas, some companies like technology,
consumer products and food beverages companies have been degraded by the consumer and
some of which are accused in media and some are in court.
The below digram shows that the monopoly companies making the unusual profits and taking the
advantage of the been Monopolistic in the market. These increase the market prices according to
the company and makes the high profits. The company average revenue should be the price of
⊘ This is a preview!⊘
Do you want full access?
Subscribe today to unlock all pages.
Trusted by 1+ million students worldwide
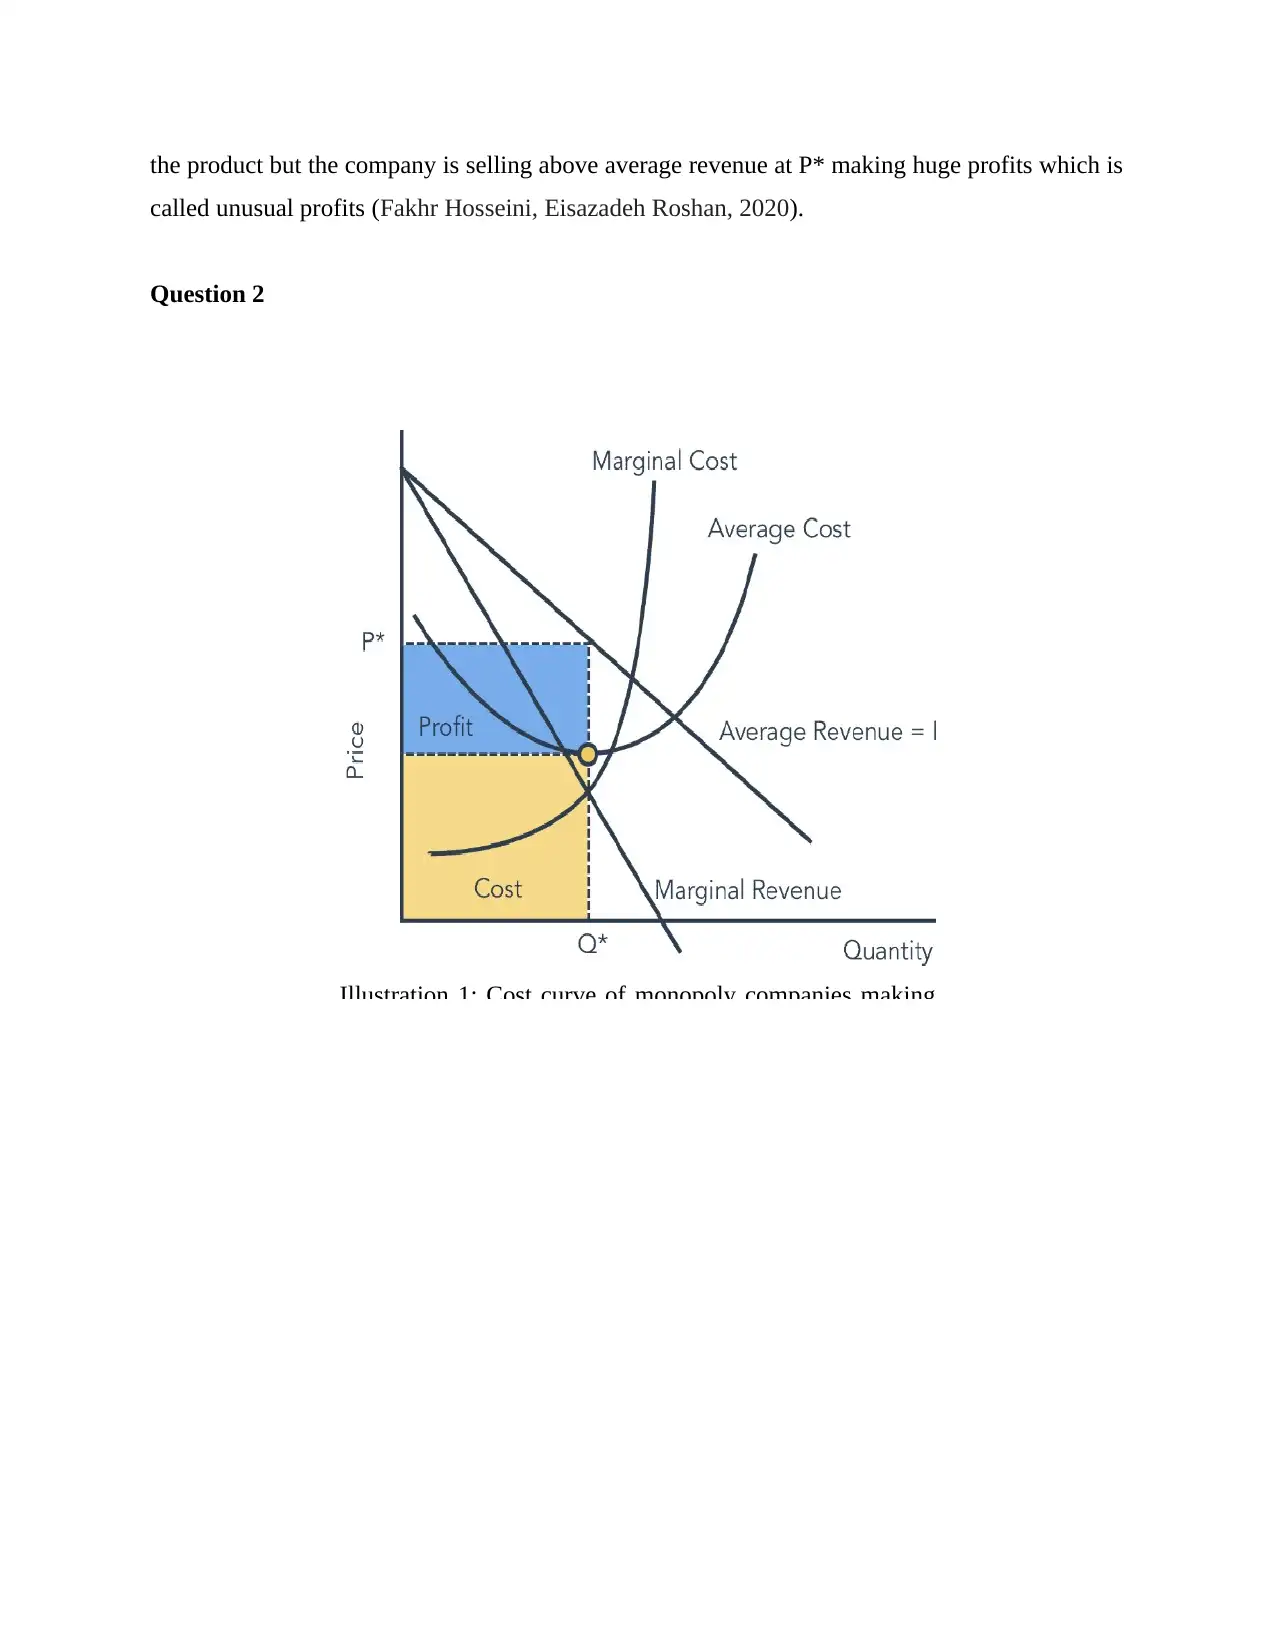
the product but the company is selling above average revenue at P* making huge profits which is
called unusual profits (Fakhr Hosseini, Eisazadeh Roshan, 2020).
Question 2
Illustration 1: Cost curve of monopoly companies making
called unusual profits (Fakhr Hosseini, Eisazadeh Roshan, 2020).
Question 2
Illustration 1: Cost curve of monopoly companies making
Paraphrase This Document
Need a fresh take? Get an instant paraphrase of this document with our AI Paraphraser
Price
Quantity demanded Quantity
supplied
(cents per pack) (millions of packs a
week)
40 170 90
50 160 100
60 150 110
70 140 120
80 130 130
90 120 140
100 110 150
110 100 160
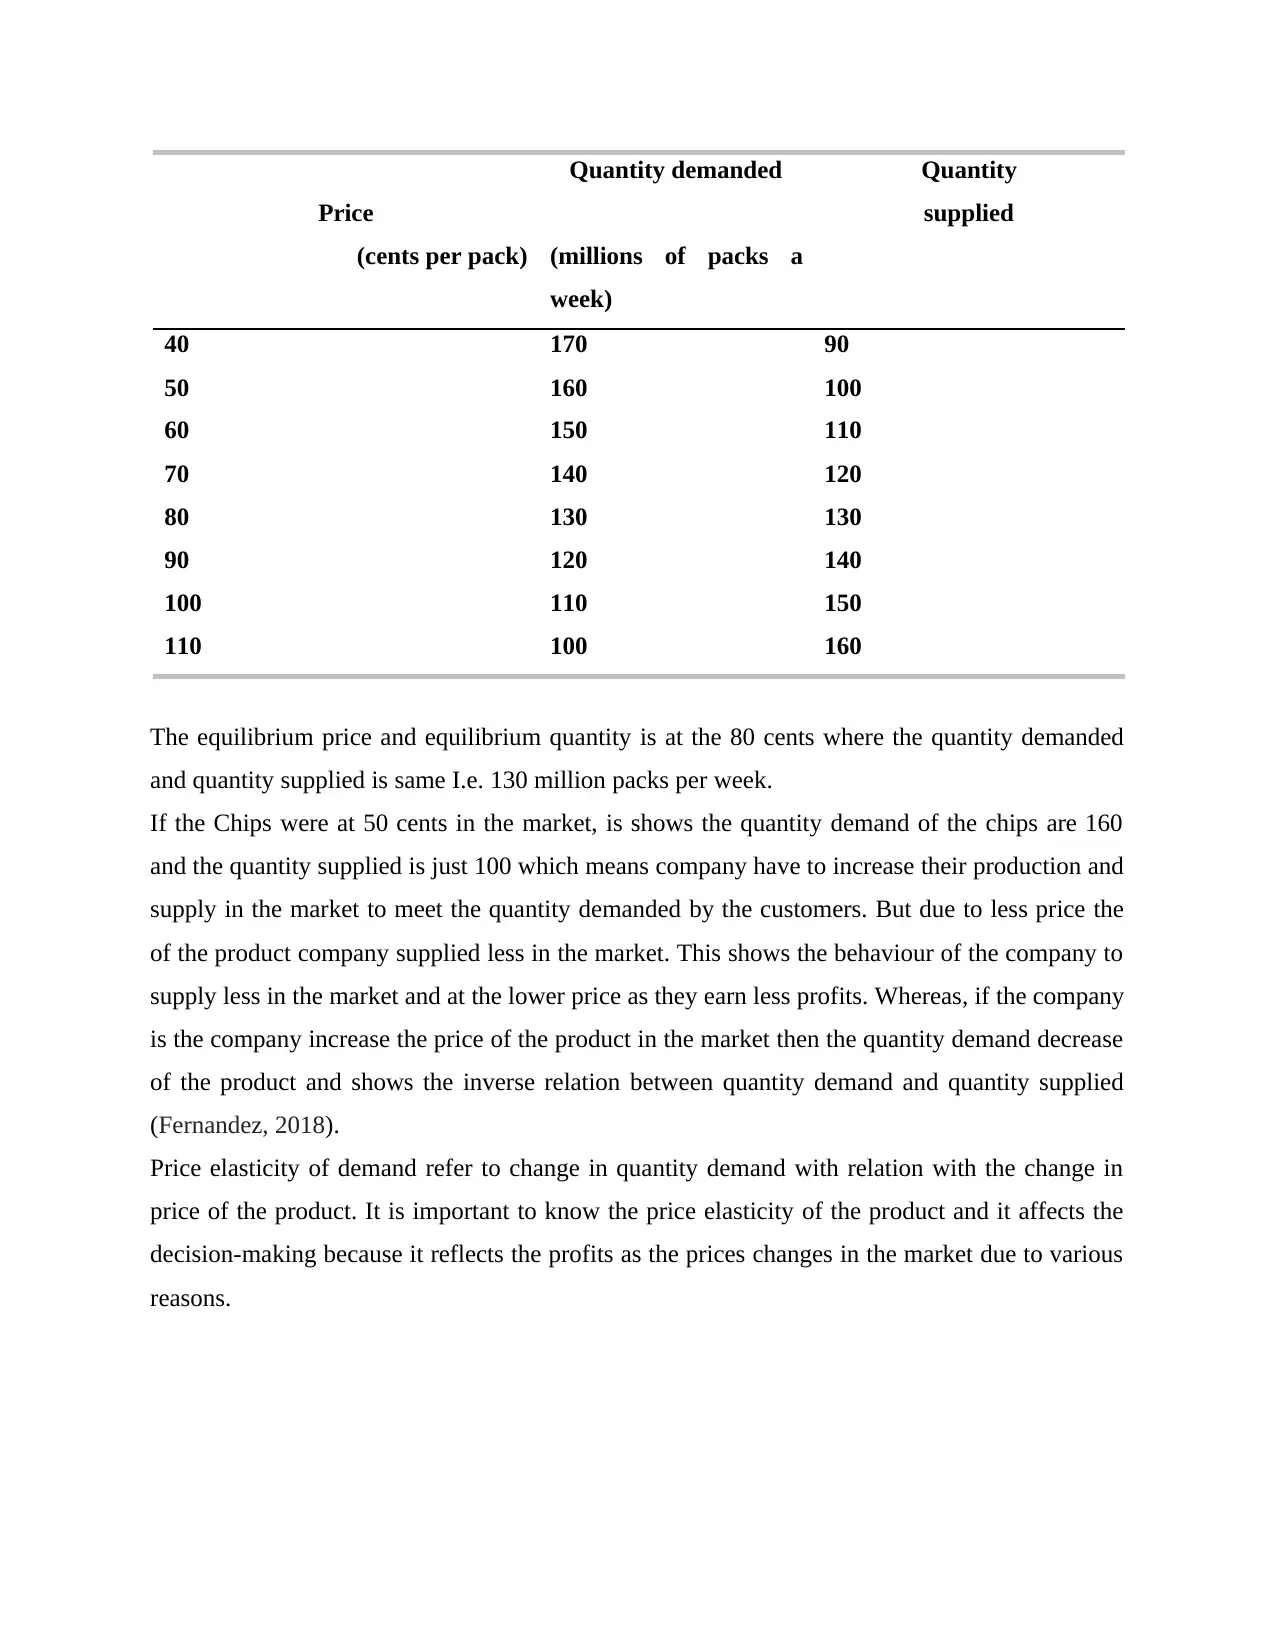
The equilibrium price and equilibrium quantity is at the 80 cents where the quantity demanded
and quantity supplied is same I.e. 130 million packs per week.
If the Chips were at 50 cents in the market, is shows the quantity demand of the chips are 160
and the quantity supplied is just 100 which means company have to increase their production and
supply in the market to meet the quantity demanded by the customers. But due to less price the
of the product company supplied less in the market. This shows the behaviour of the company to
supply less in the market and at the lower price as they earn less profits. Whereas, if the company
is the company increase the price of the product in the market then the quantity demand decrease
of the product and shows the inverse relation between quantity demand and quantity supplied
(Fernandez, 2018).
Price elasticity of demand refer to change in quantity demand with relation with the change in
price of the product. It is important to know the price elasticity of the product and it affects the
decision-making because it reflects the profits as the prices changes in the market due to various
reasons.
Quantity demanded Quantity
supplied
(cents per pack) (millions of packs a
week)
40 170 90
50 160 100
60 150 110
70 140 120
80 130 130
90 120 140
100 110 150
110 100 160
The equilibrium price and equilibrium quantity is at the 80 cents where the quantity demanded
and quantity supplied is same I.e. 130 million packs per week.
If the Chips were at 50 cents in the market, is shows the quantity demand of the chips are 160
and the quantity supplied is just 100 which means company have to increase their production and
supply in the market to meet the quantity demanded by the customers. But due to less price the
of the product company supplied less in the market. This shows the behaviour of the company to
supply less in the market and at the lower price as they earn less profits. Whereas, if the company
is the company increase the price of the product in the market then the quantity demand decrease
of the product and shows the inverse relation between quantity demand and quantity supplied
(Fernandez, 2018).
Price elasticity of demand refer to change in quantity demand with relation with the change in
price of the product. It is important to know the price elasticity of the product and it affects the
decision-making because it reflects the profits as the prices changes in the market due to various
reasons.
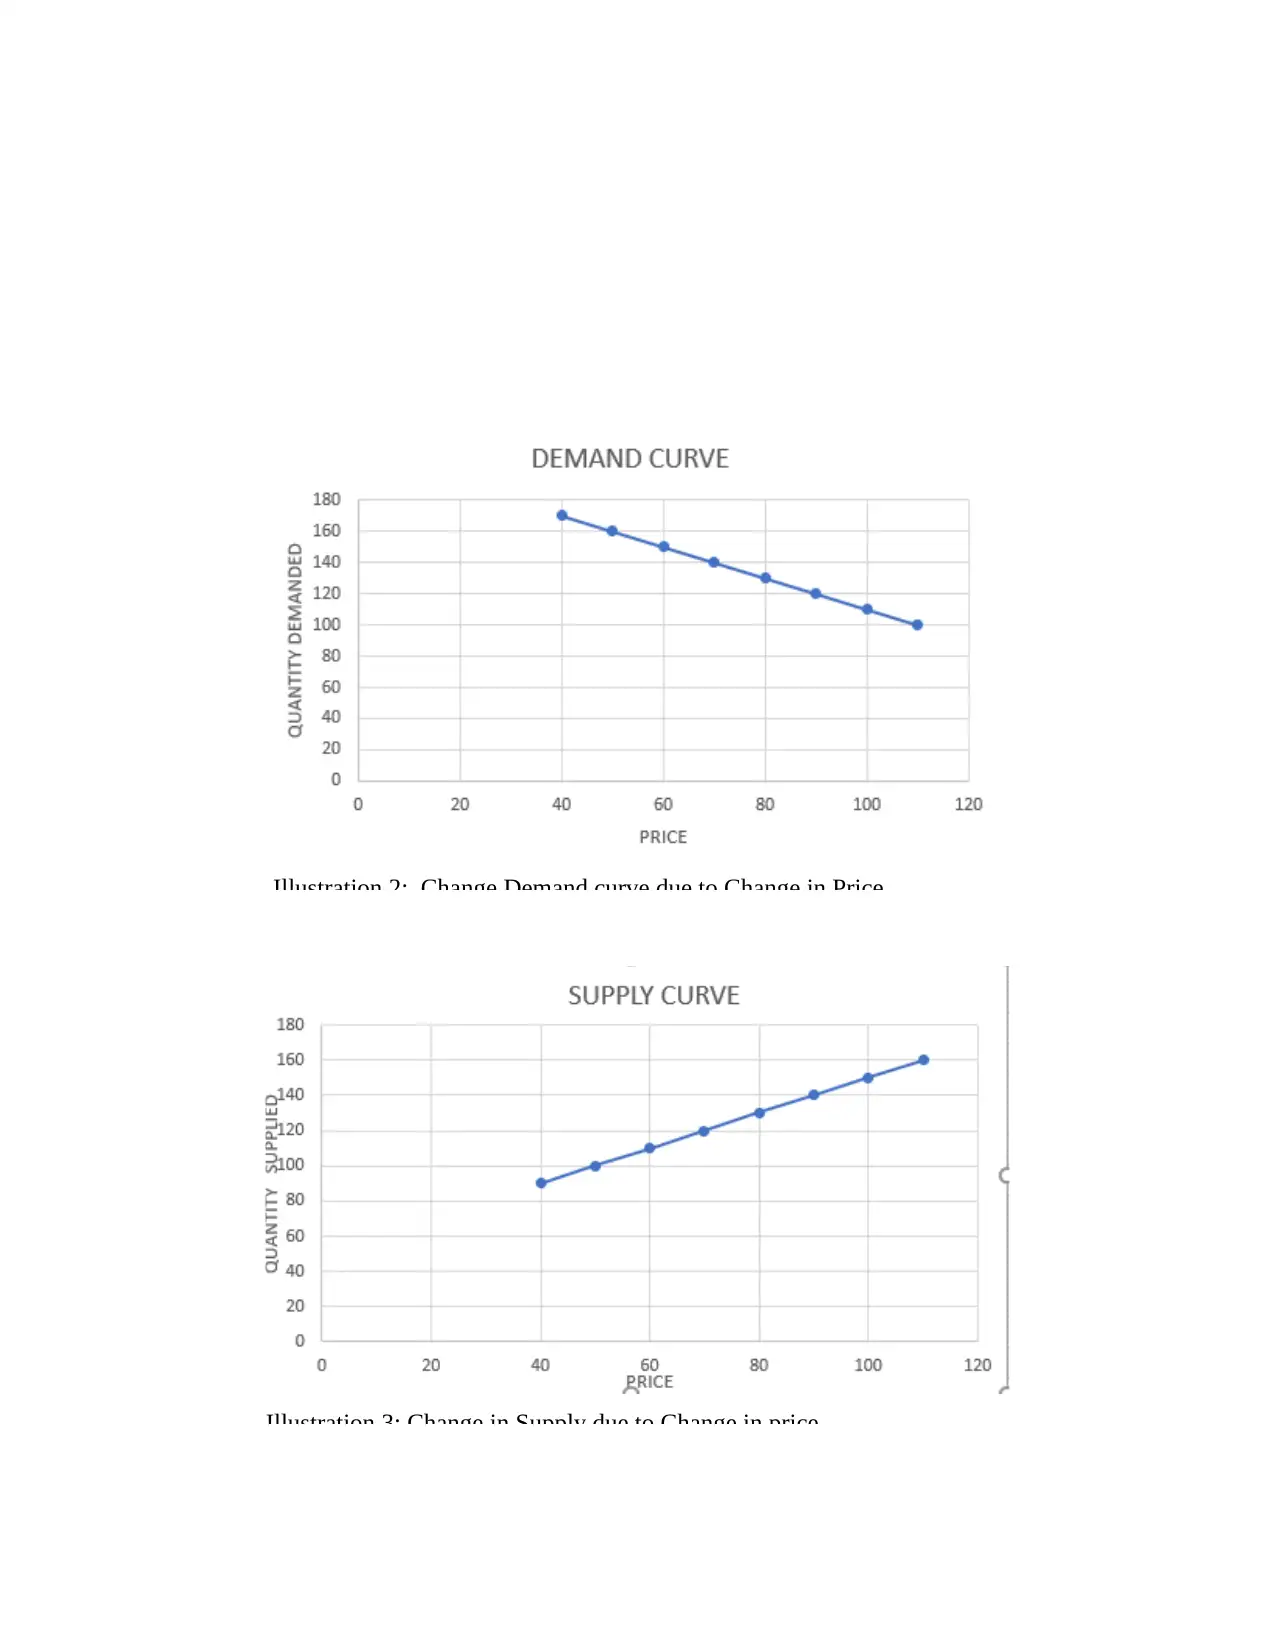
Illustration 2: Change Demand curve due to Change in Price
Illustration 3: Change in Supply due to Change in price
Illustration 3: Change in Supply due to Change in price
⊘ This is a preview!⊘
Do you want full access?
Subscribe today to unlock all pages.
Trusted by 1+ million students worldwide
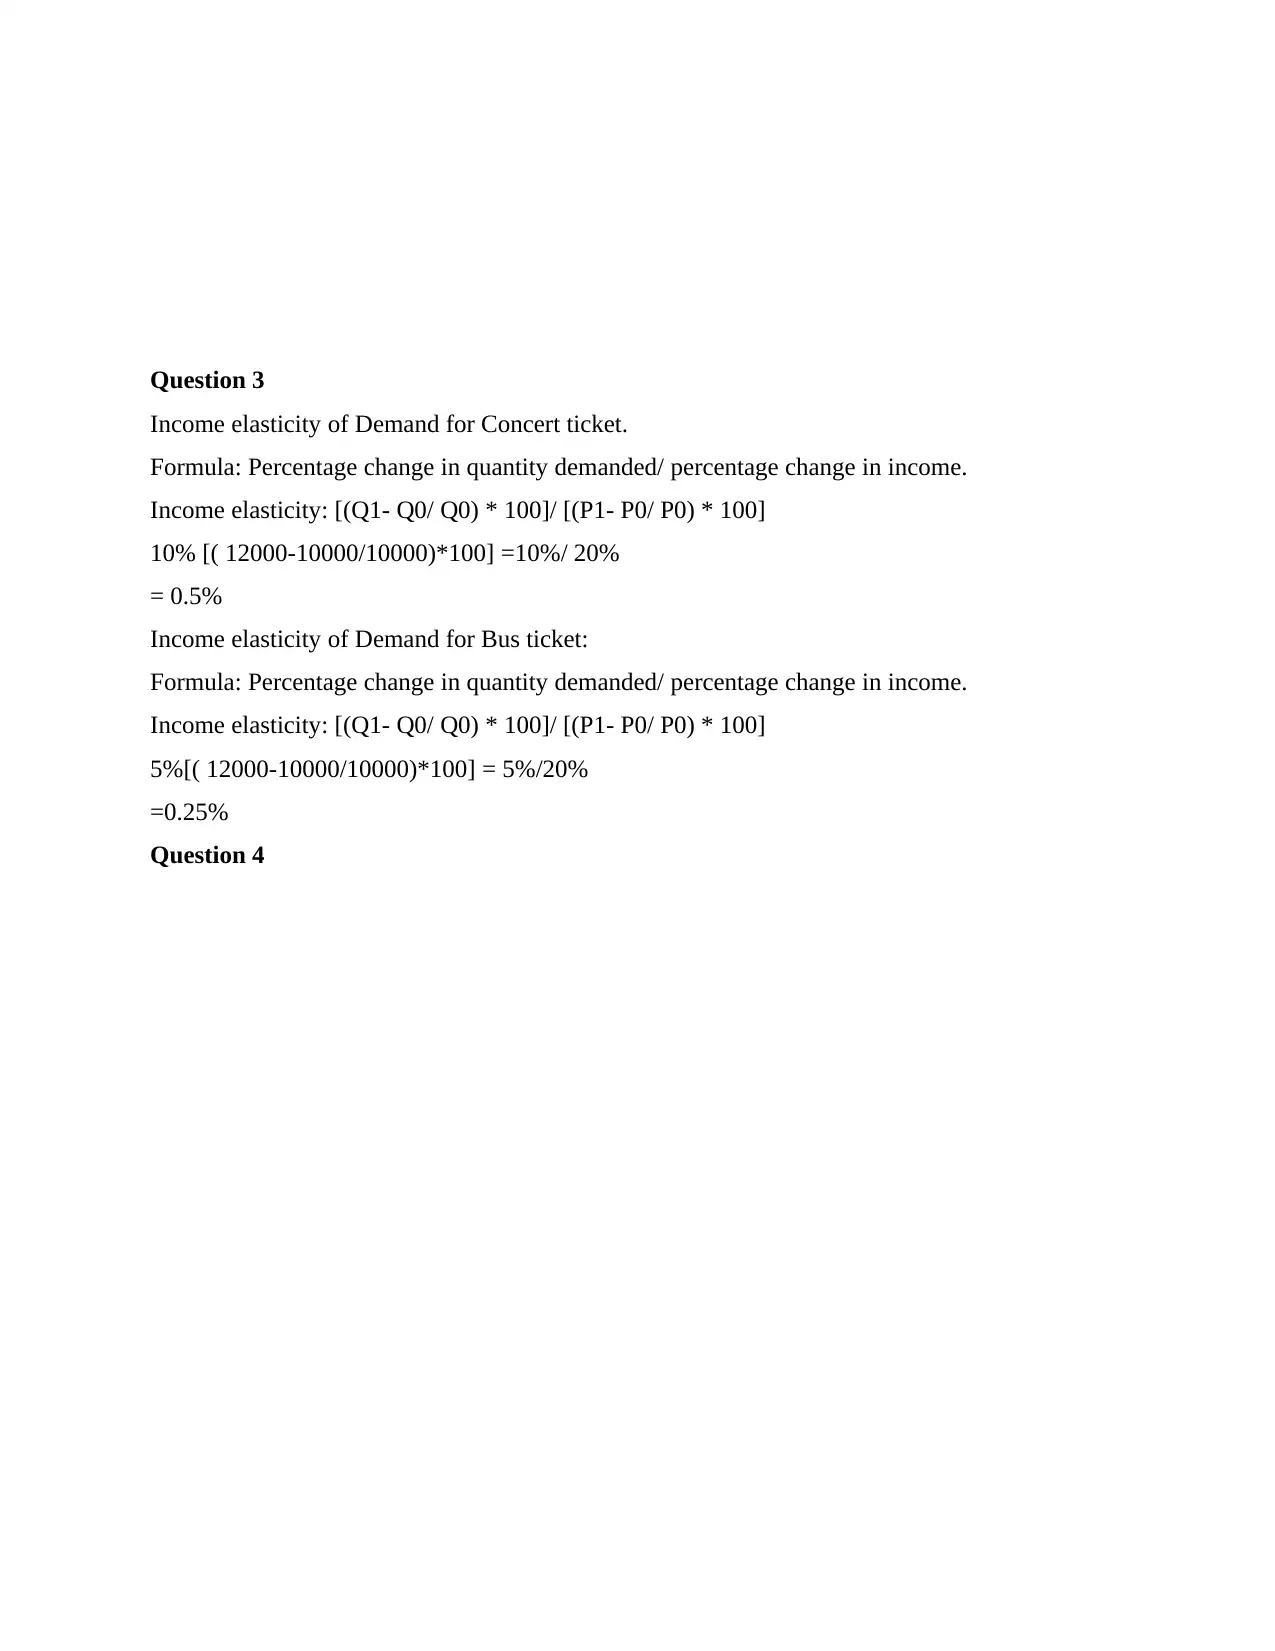
Question 3
Income elasticity of Demand for Concert ticket.
Formula: Percentage change in quantity demanded/ percentage change in income.
Income elasticity: [(Q1- Q0/ Q0) * 100]/ [(P1- P0/ P0) * 100]
10% [( 12000-10000/10000)*100] =10%/ 20%
= 0.5%
Income elasticity of Demand for Bus ticket:
Formula: Percentage change in quantity demanded/ percentage change in income.
Income elasticity: [(Q1- Q0/ Q0) * 100]/ [(P1- P0/ P0) * 100]
5%[( 12000-10000/10000)*100] = 5%/20%
=0.25%
Question 4
Paraphrase This Document
Need a fresh take? Get an instant paraphrase of this document with our AI Paraphraser
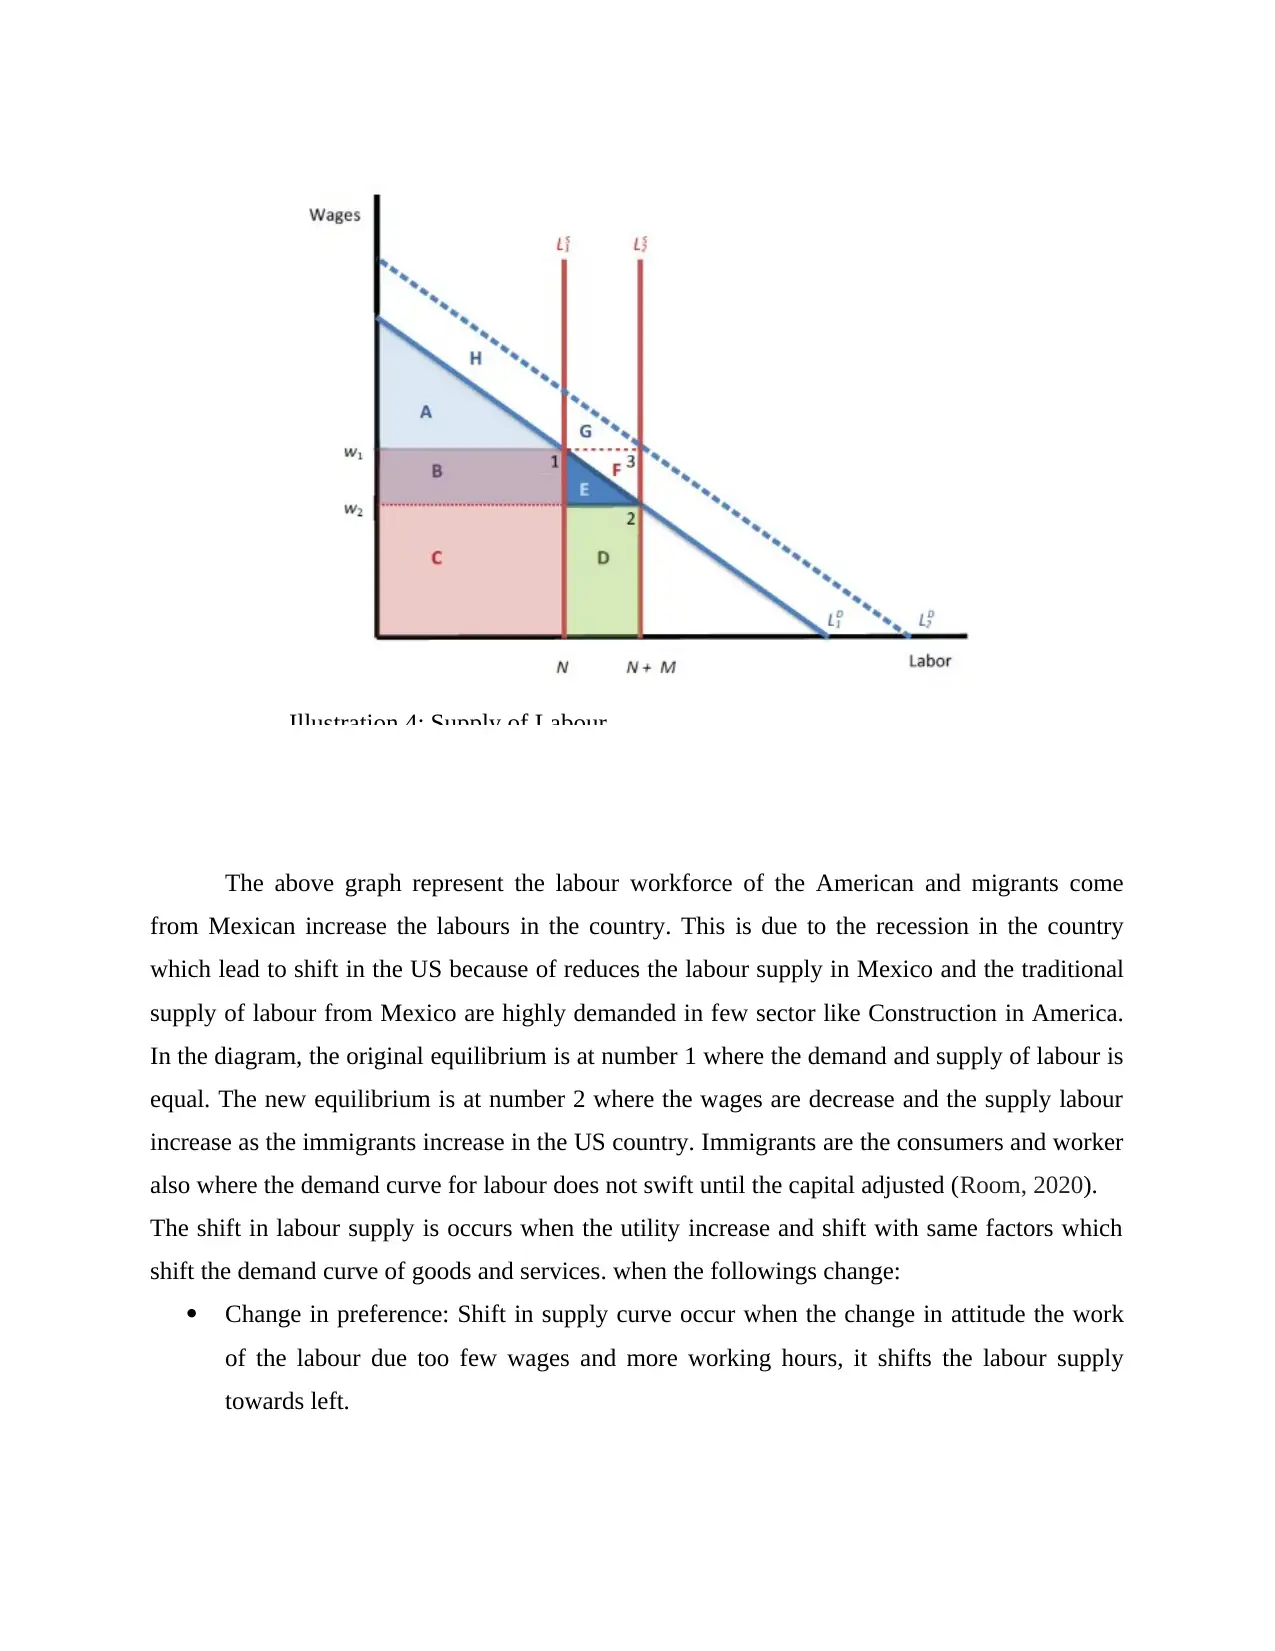
The above graph represent the labour workforce of the American and migrants come
from Mexican increase the labours in the country. This is due to the recession in the country
which lead to shift in the US because of reduces the labour supply in Mexico and the traditional
supply of labour from Mexico are highly demanded in few sector like Construction in America.
In the diagram, the original equilibrium is at number 1 where the demand and supply of labour is
equal. The new equilibrium is at number 2 where the wages are decrease and the supply labour
increase as the immigrants increase in the US country. Immigrants are the consumers and worker
also where the demand curve for labour does not swift until the capital adjusted (Room, 2020).
The shift in labour supply is occurs when the utility increase and shift with same factors which
shift the demand curve of goods and services. when the followings change:
Change in preference: Shift in supply curve occur when the change in attitude the work
of the labour due too few wages and more working hours, it shifts the labour supply
towards left.
Illustration 4: Supply of Labour
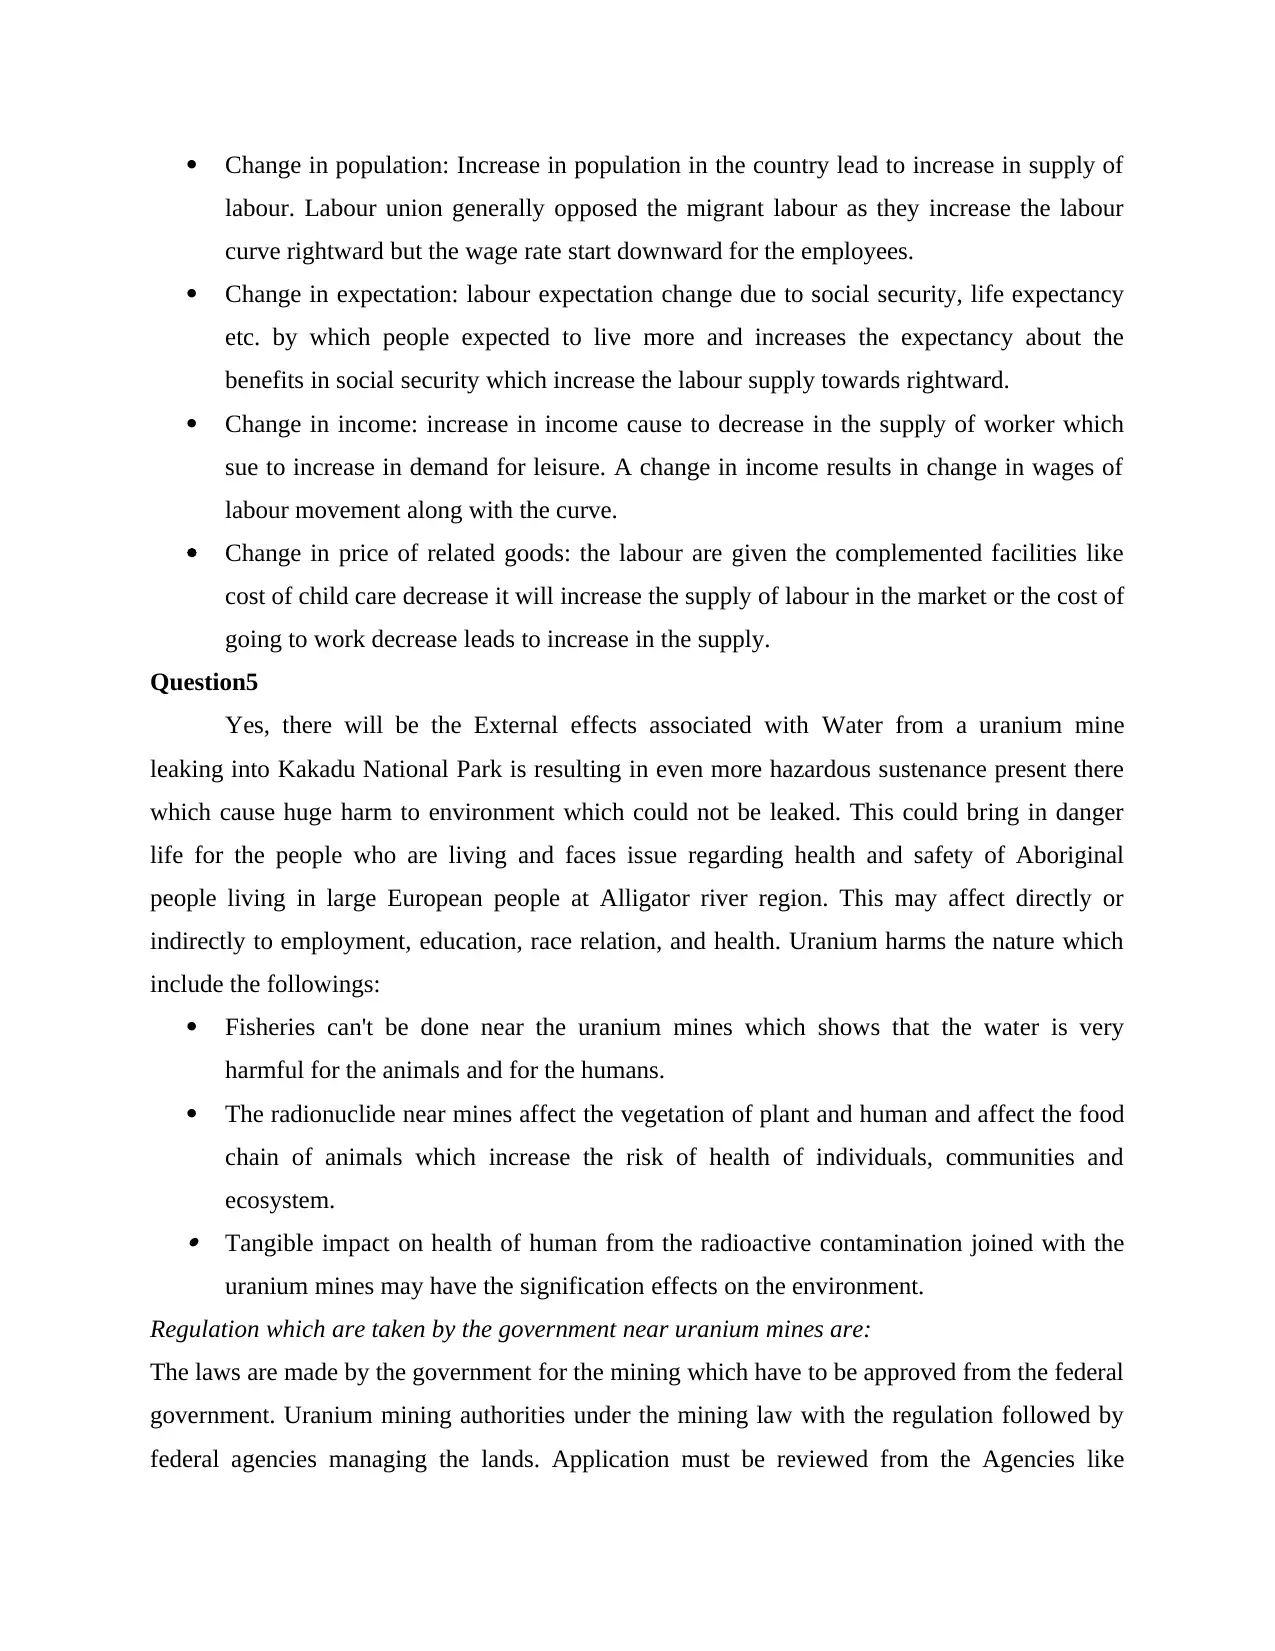
Change in population: Increase in population in the country lead to increase in supply of
labour. Labour union generally opposed the migrant labour as they increase the labour
curve rightward but the wage rate start downward for the employees.
Change in expectation: labour expectation change due to social security, life expectancy
etc. by which people expected to live more and increases the expectancy about the
benefits in social security which increase the labour supply towards rightward.
Change in income: increase in income cause to decrease in the supply of worker which
sue to increase in demand for leisure. A change in income results in change in wages of
labour movement along with the curve.
Change in price of related goods: the labour are given the complemented facilities like
cost of child care decrease it will increase the supply of labour in the market or the cost of
going to work decrease leads to increase in the supply.
Question5
Yes, there will be the External effects associated with Water from a uranium mine
leaking into Kakadu National Park is resulting in even more hazardous sustenance present there
which cause huge harm to environment which could not be leaked. This could bring in danger
life for the people who are living and faces issue regarding health and safety of Aboriginal
people living in large European people at Alligator river region. This may affect directly or
indirectly to employment, education, race relation, and health. Uranium harms the nature which
include the followings:
Fisheries can't be done near the uranium mines which shows that the water is very
harmful for the animals and for the humans.
The radionuclide near mines affect the vegetation of plant and human and affect the food
chain of animals which increase the risk of health of individuals, communities and
ecosystem. Tangible impact on health of human from the radioactive contamination joined with the
uranium mines may have the signification effects on the environment.
Regulation which are taken by the government near uranium mines are:
The laws are made by the government for the mining which have to be approved from the federal
government. Uranium mining authorities under the mining law with the regulation followed by
federal agencies managing the lands. Application must be reviewed from the Agencies like
⊘ This is a preview!⊘
Do you want full access?
Subscribe today to unlock all pages.
Trusted by 1+ million students worldwide
National Environmental Policy Act for the mining on the federal lands and required full
environmental impact statement before the license of mining approved. Regu8lation of worker
health and safety and Virginia would the responsible for regulation the mines of uranium which
are not owned by the federal.
PART B
Question 6
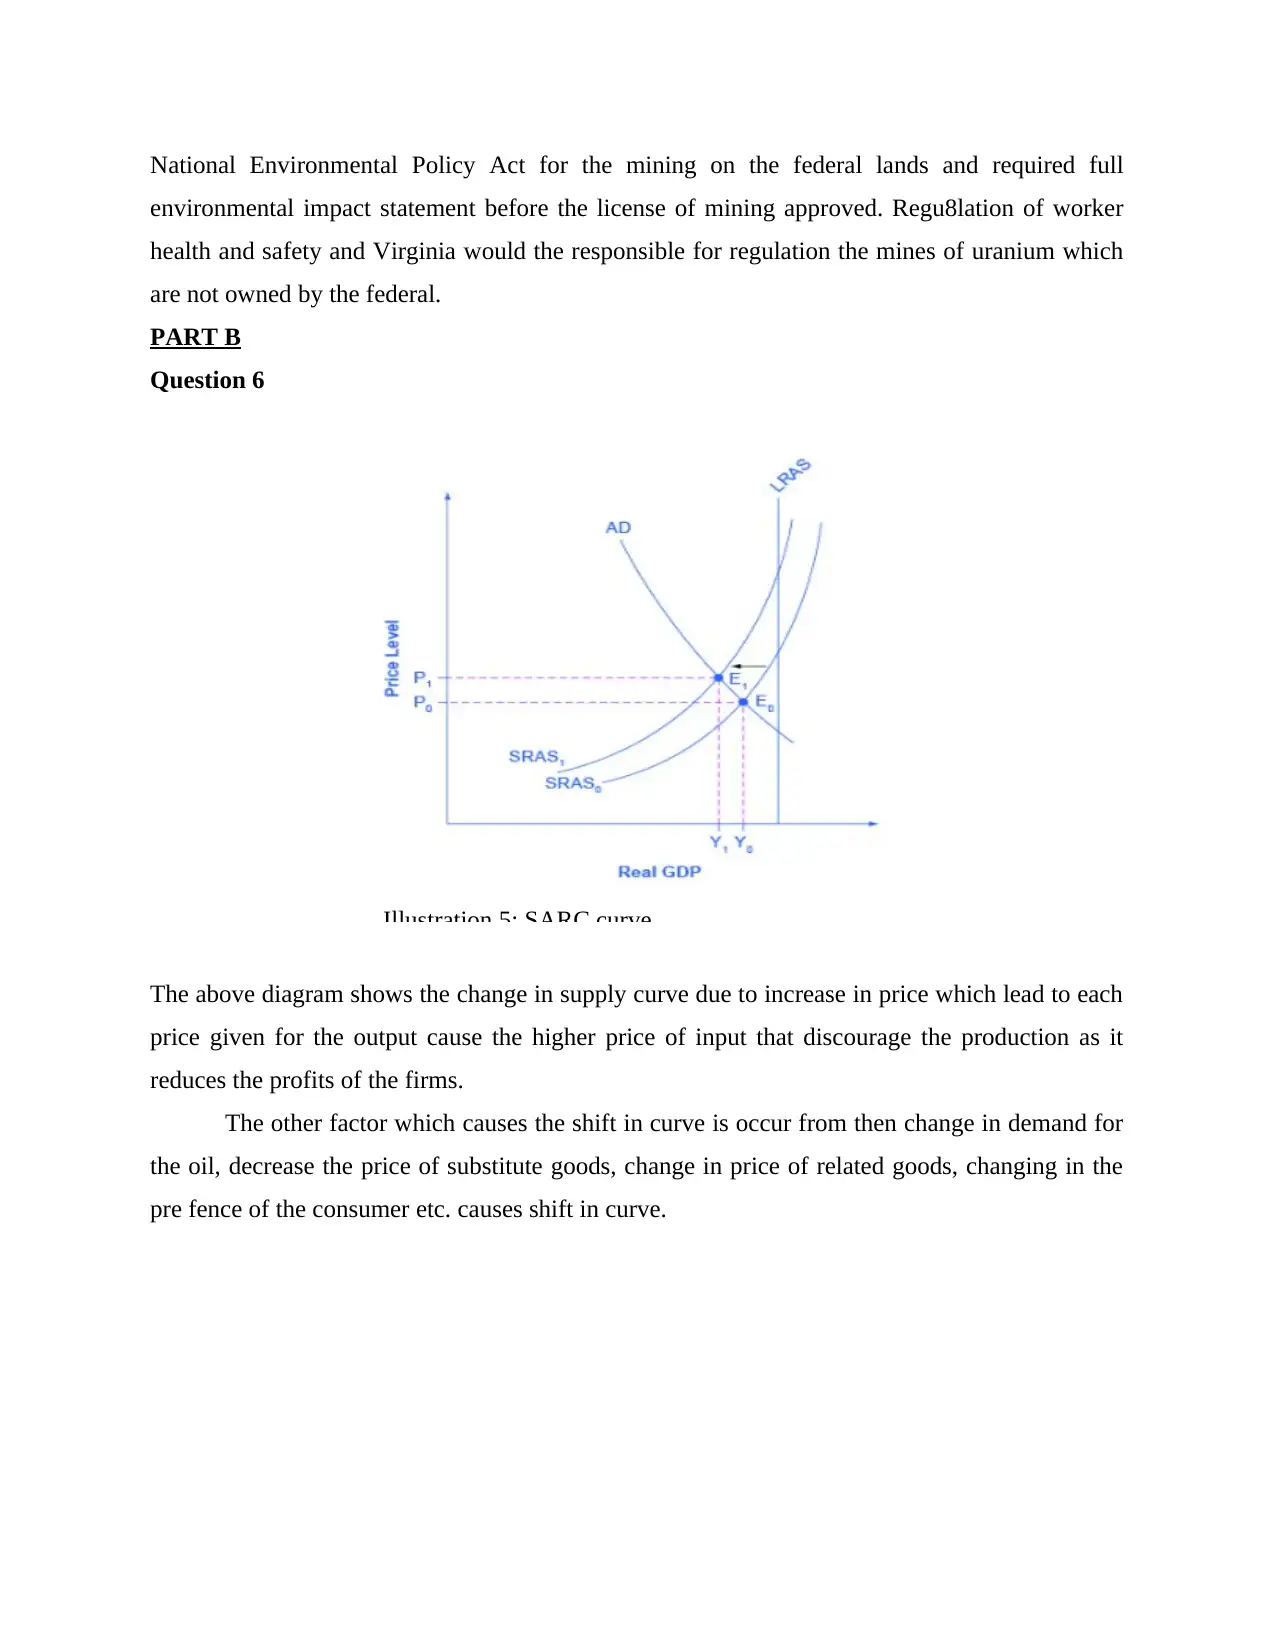
The above diagram shows the change in supply curve due to increase in price which lead to each
price given for the output cause the higher price of input that discourage the production as it
reduces the profits of the firms.
The other factor which causes the shift in curve is occur from then change in demand for
the oil, decrease the price of substitute goods, change in price of related goods, changing in the
pre fence of the consumer etc. causes shift in curve.
Illustration 5: SARC curve
environmental impact statement before the license of mining approved. Regu8lation of worker
health and safety and Virginia would the responsible for regulation the mines of uranium which
are not owned by the federal.
PART B
Question 6
The above diagram shows the change in supply curve due to increase in price which lead to each
price given for the output cause the higher price of input that discourage the production as it
reduces the profits of the firms.
The other factor which causes the shift in curve is occur from then change in demand for
the oil, decrease the price of substitute goods, change in price of related goods, changing in the
pre fence of the consumer etc. causes shift in curve.
Illustration 5: SARC curve
Paraphrase This Document
Need a fresh take? Get an instant paraphrase of this document with our AI Paraphraser
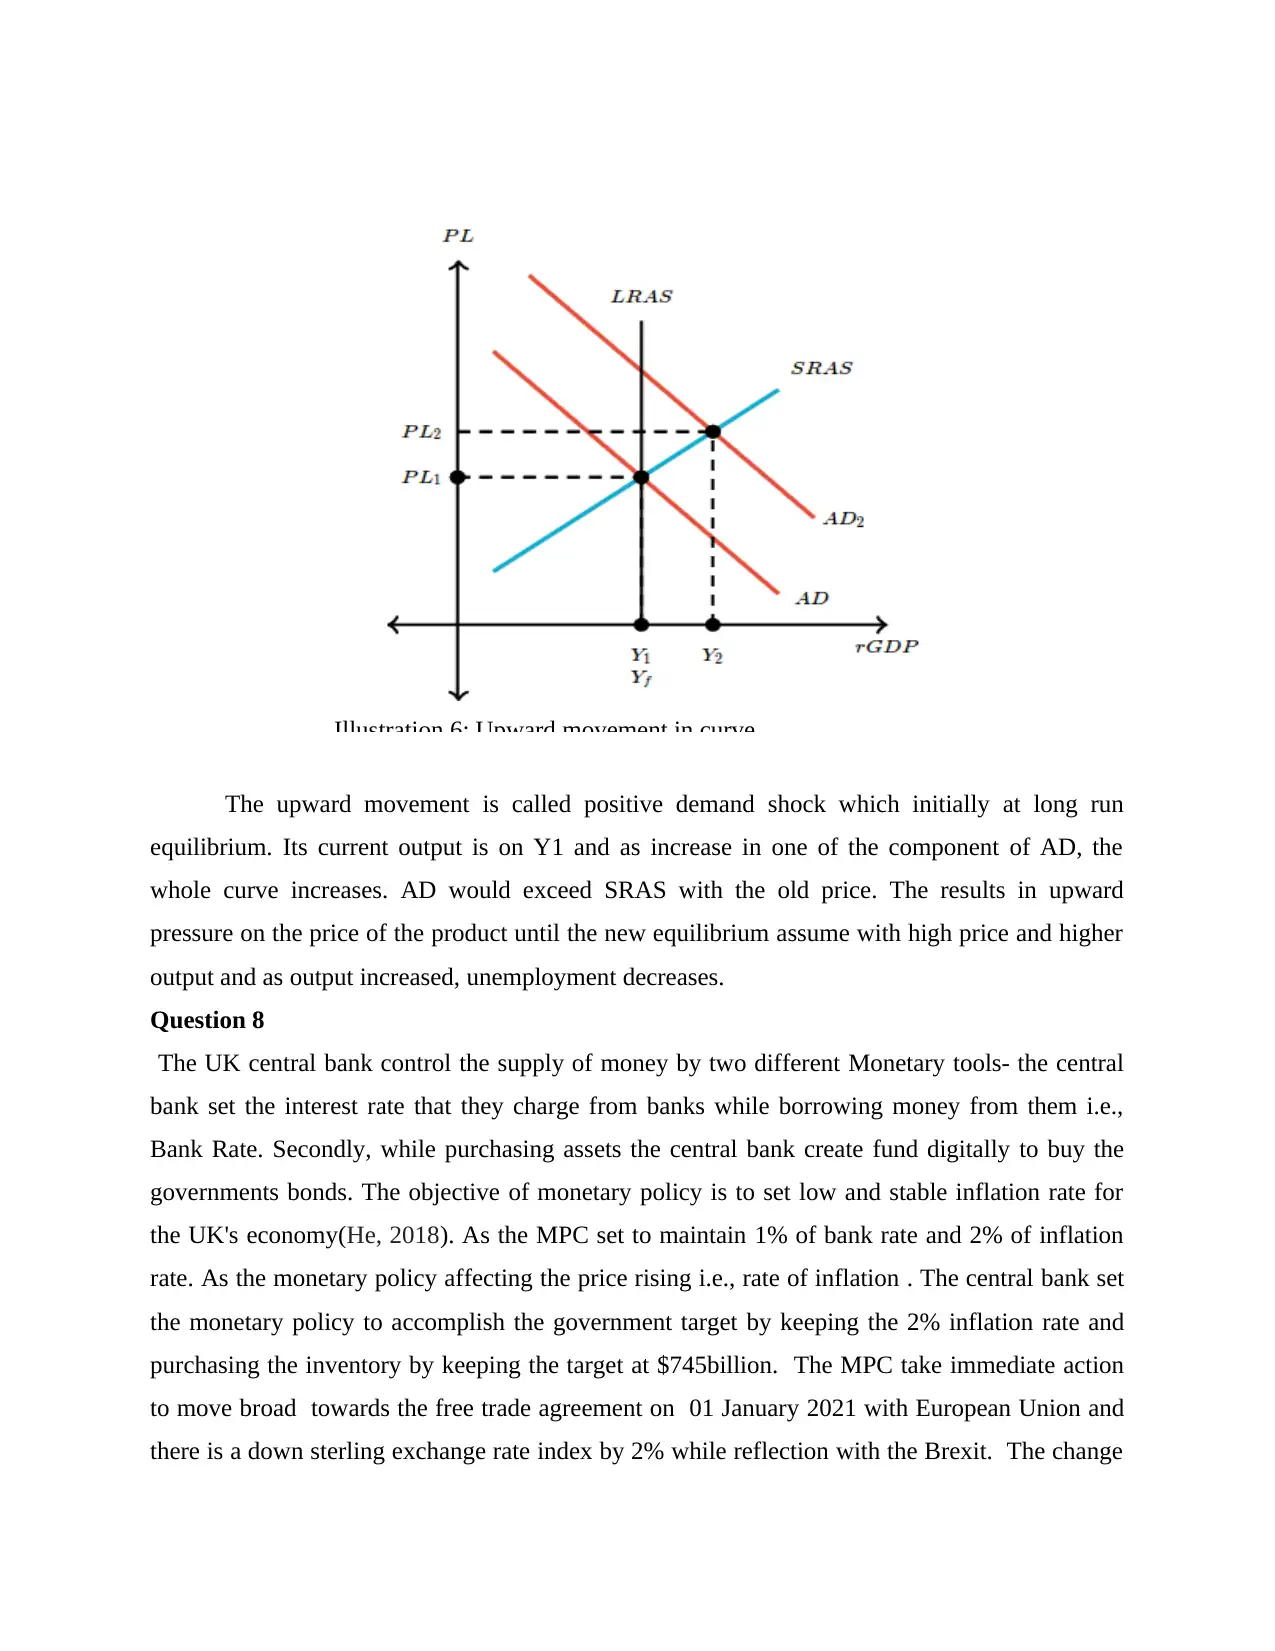
The upward movement is called positive demand shock which initially at long run
equilibrium. Its current output is on Y1 and as increase in one of the component of AD, the
whole curve increases. AD would exceed SRAS with the old price. The results in upward
pressure on the price of the product until the new equilibrium assume with high price and higher
output and as output increased, unemployment decreases.
Question 8
The UK central bank control the supply of money by two different Monetary tools- the central
bank set the interest rate that they charge from banks while borrowing money from them i.e.,
Bank Rate. Secondly, while purchasing assets the central bank create fund digitally to buy the
governments bonds. The objective of monetary policy is to set low and stable inflation rate for
the UK's economy(He, 2018). As the MPC set to maintain 1% of bank rate and 2% of inflation
rate. As the monetary policy affecting the price rising i.e., rate of inflation . The central bank set
the monetary policy to accomplish the government target by keeping the 2% inflation rate and
purchasing the inventory by keeping the target at $745billion. The MPC take immediate action
to move broad towards the free trade agreement on 01 January 2021 with European Union and
there is a down sterling exchange rate index by 2% while reflection with the Brexit. The change
Illustration 6: Upward movement in curve.

in interest rate affect the market as positive and negative aspects. The lower interest rate provide
economy growth because the consumers are willing to spend their money to borrow the fixed
assets. When there is too much growth the government raise the inflation rate to control the
economy. Higher interest rate control the growth of consumers spending to more sustainable
levels because the rate of borrowing will increase the people will start spending less and the
demand of the goods and services falls down.
Question 8
The banks and investors in UK increase the borrowed amount to expand their buying products.
In the leading year, the economic growth was strong and the rate of inflation, unemployment and
interest rate will low (Lane and Milesi-Ferretti, 2018). There are some errors in regulations and
policies lead by the GFC for products. As the crisis unfolded, the central bank and governments
are not able to recognize the level to bad loan and many ways of mortgage losses spreading in
financial system.
In 2008 and 2009 the UK suffered the financial crisis which led to global recession. Over that
time, millions of peoples have lost their jobs and thousands of businesses are reached the point of
shut down (Alexakis and et.al., 2019). With the respect of financial crisis it became clear to the
government of the UK that the intervention is required quickly so that the whole financial system
would not collapse. The government took the four pronged approach to handle the crisis:
The first and foremost aim of the government to protect the savers.
The second is the government need to maintain the liquidity of the banks.
The third objective was to keep the capital in banks so that they do not go into the form
of liquidation.
The forth and final objective was to make sure that the bank continues to lend to borrowers
without taking the risk.
CONCLUSION
These report conclude that the aggregate demand and supply change due to price and
other factor affecting the product. The problems create by the monopolistic companies and the
government regulation on them. Price elasticity of the demand and income elasticity of the
⊘ This is a preview!⊘
Do you want full access?
Subscribe today to unlock all pages.
Trusted by 1+ million students worldwide
1 out of 15
Related Documents


Your All-in-One AI-Powered Toolkit for Academic Success.
+13062052269
info@desklib.com
Available 24*7 on WhatsApp / Email
![[object Object]](/_next/static/media/star-bottom.7253800d.svg)
Unlock your academic potential
Copyright © 2020–2026 A2Z Services. All Rights Reserved. Developed and managed by ZUCOL.