Business Economics Report: Economic Equilibrium Analysis

Verified

Added on  2020/05/16

|11
|1624
|70
Report
AI Summary
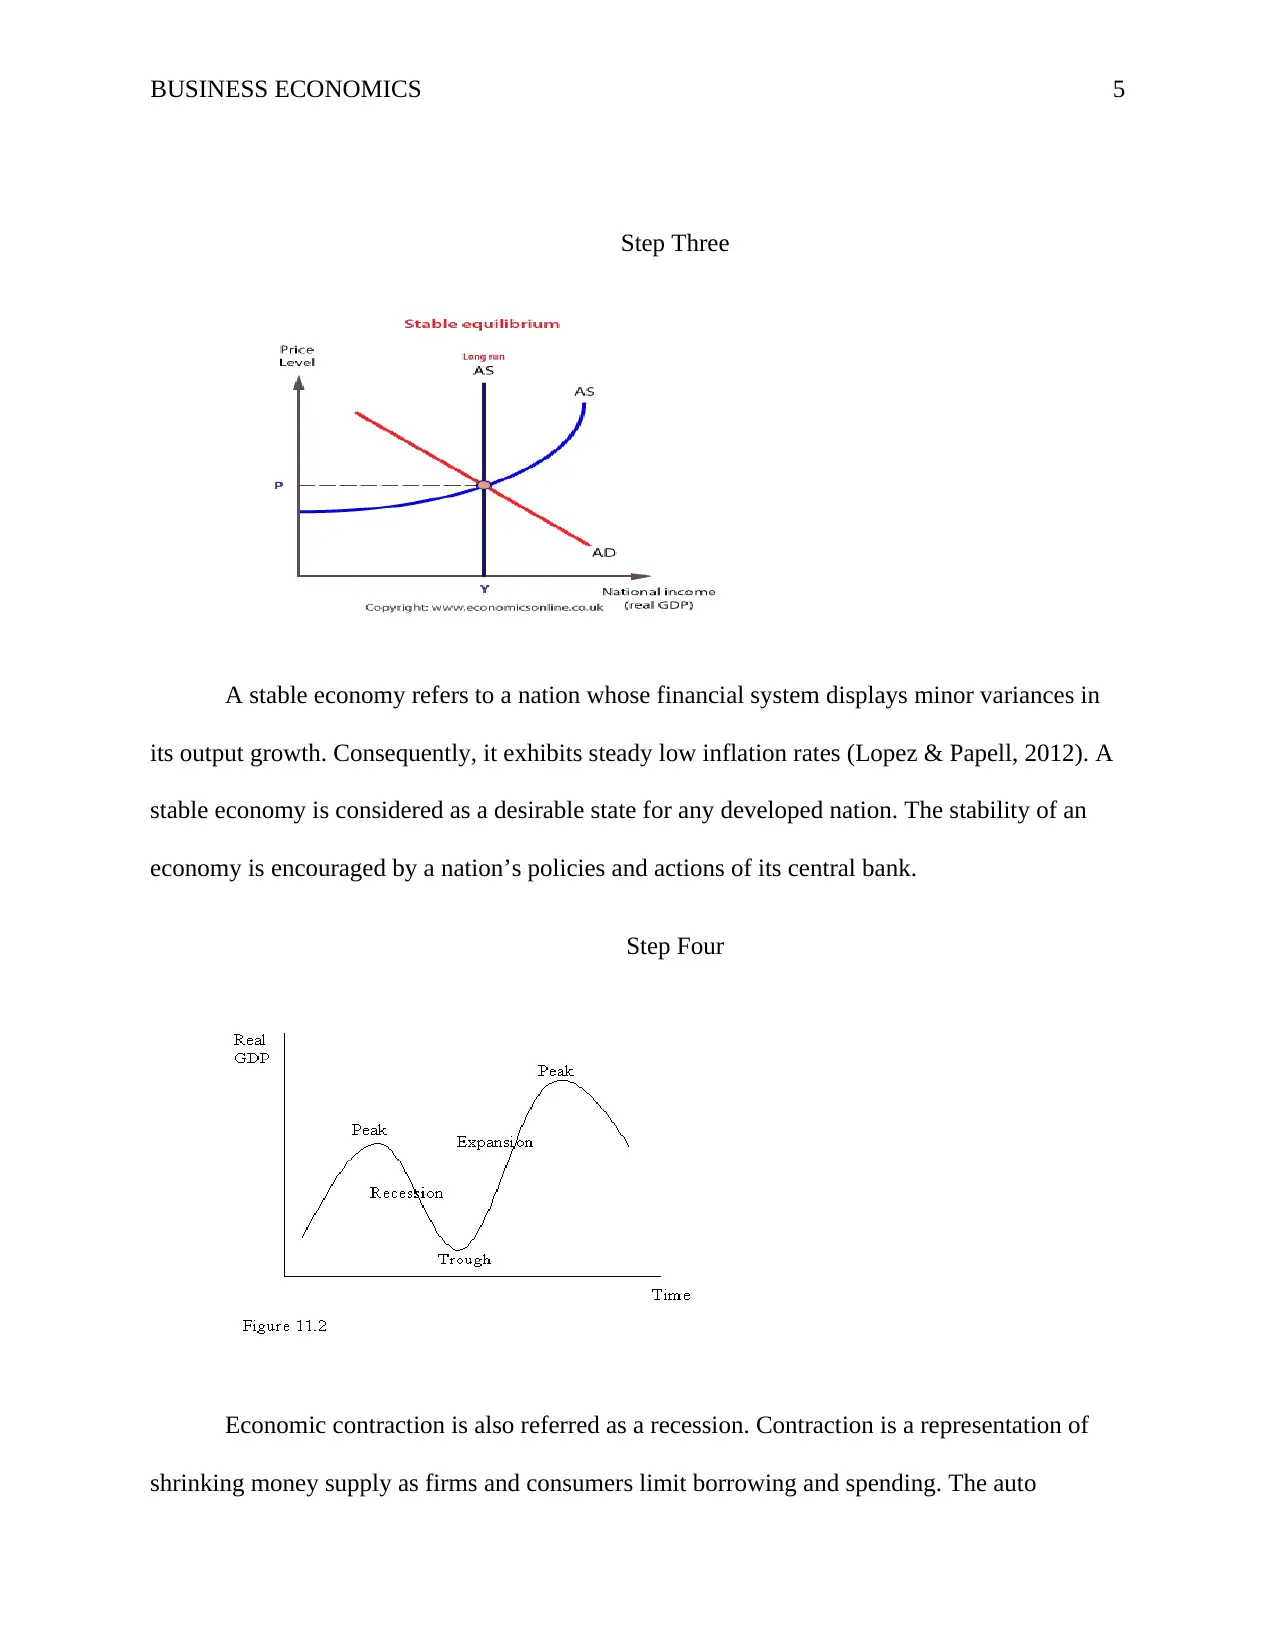
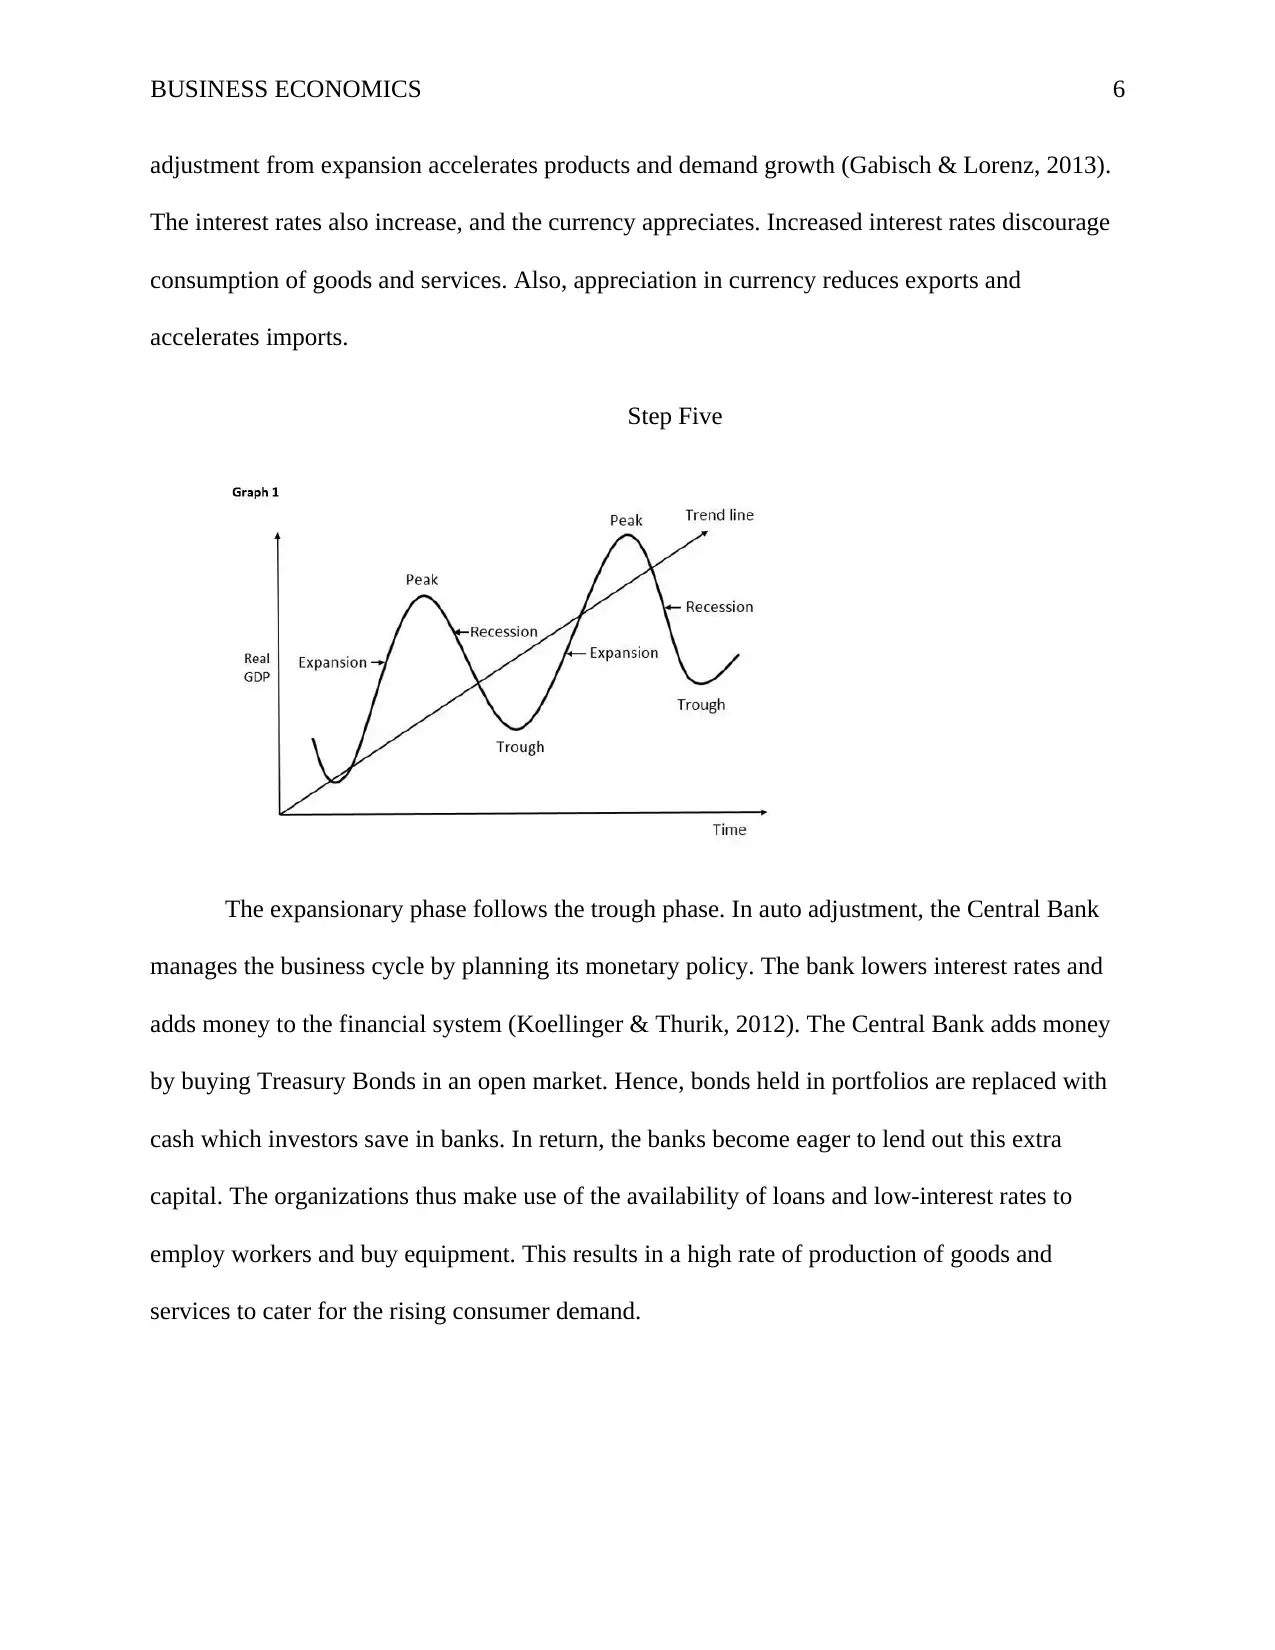
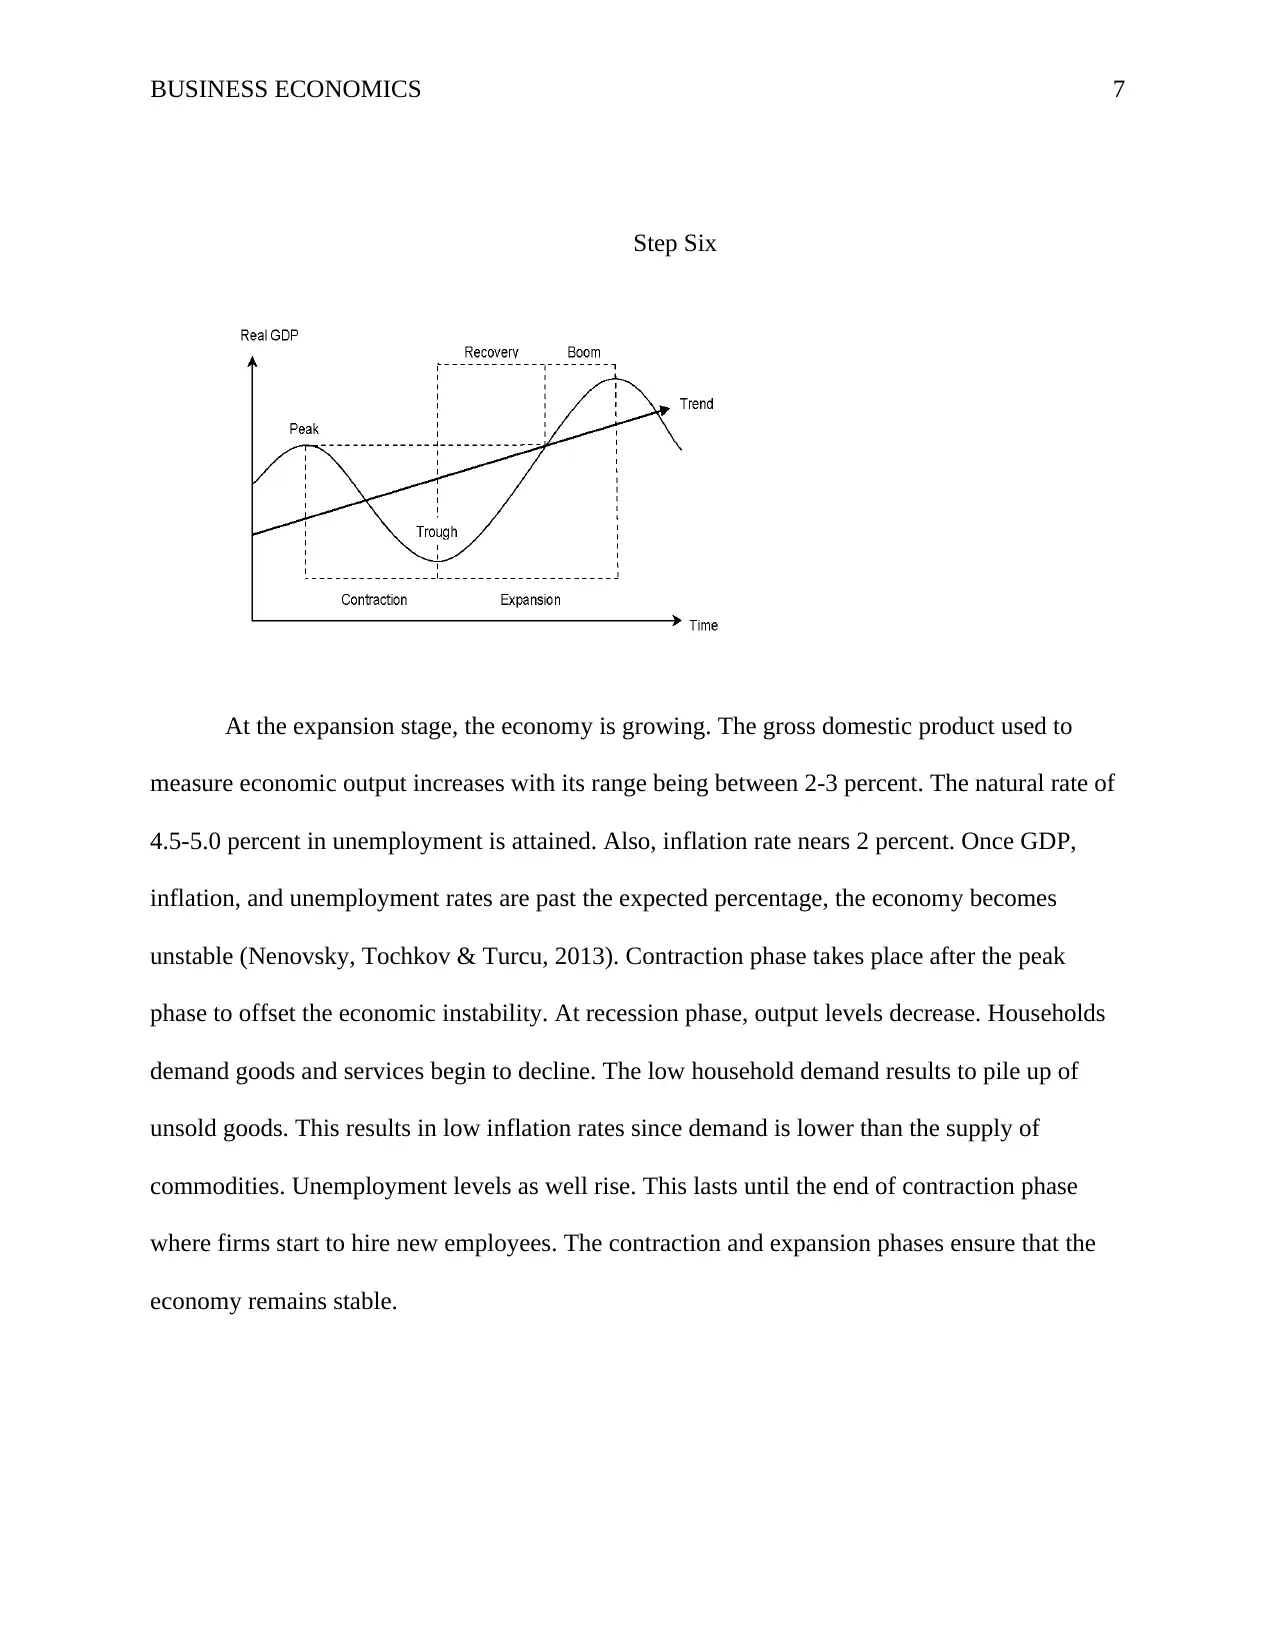
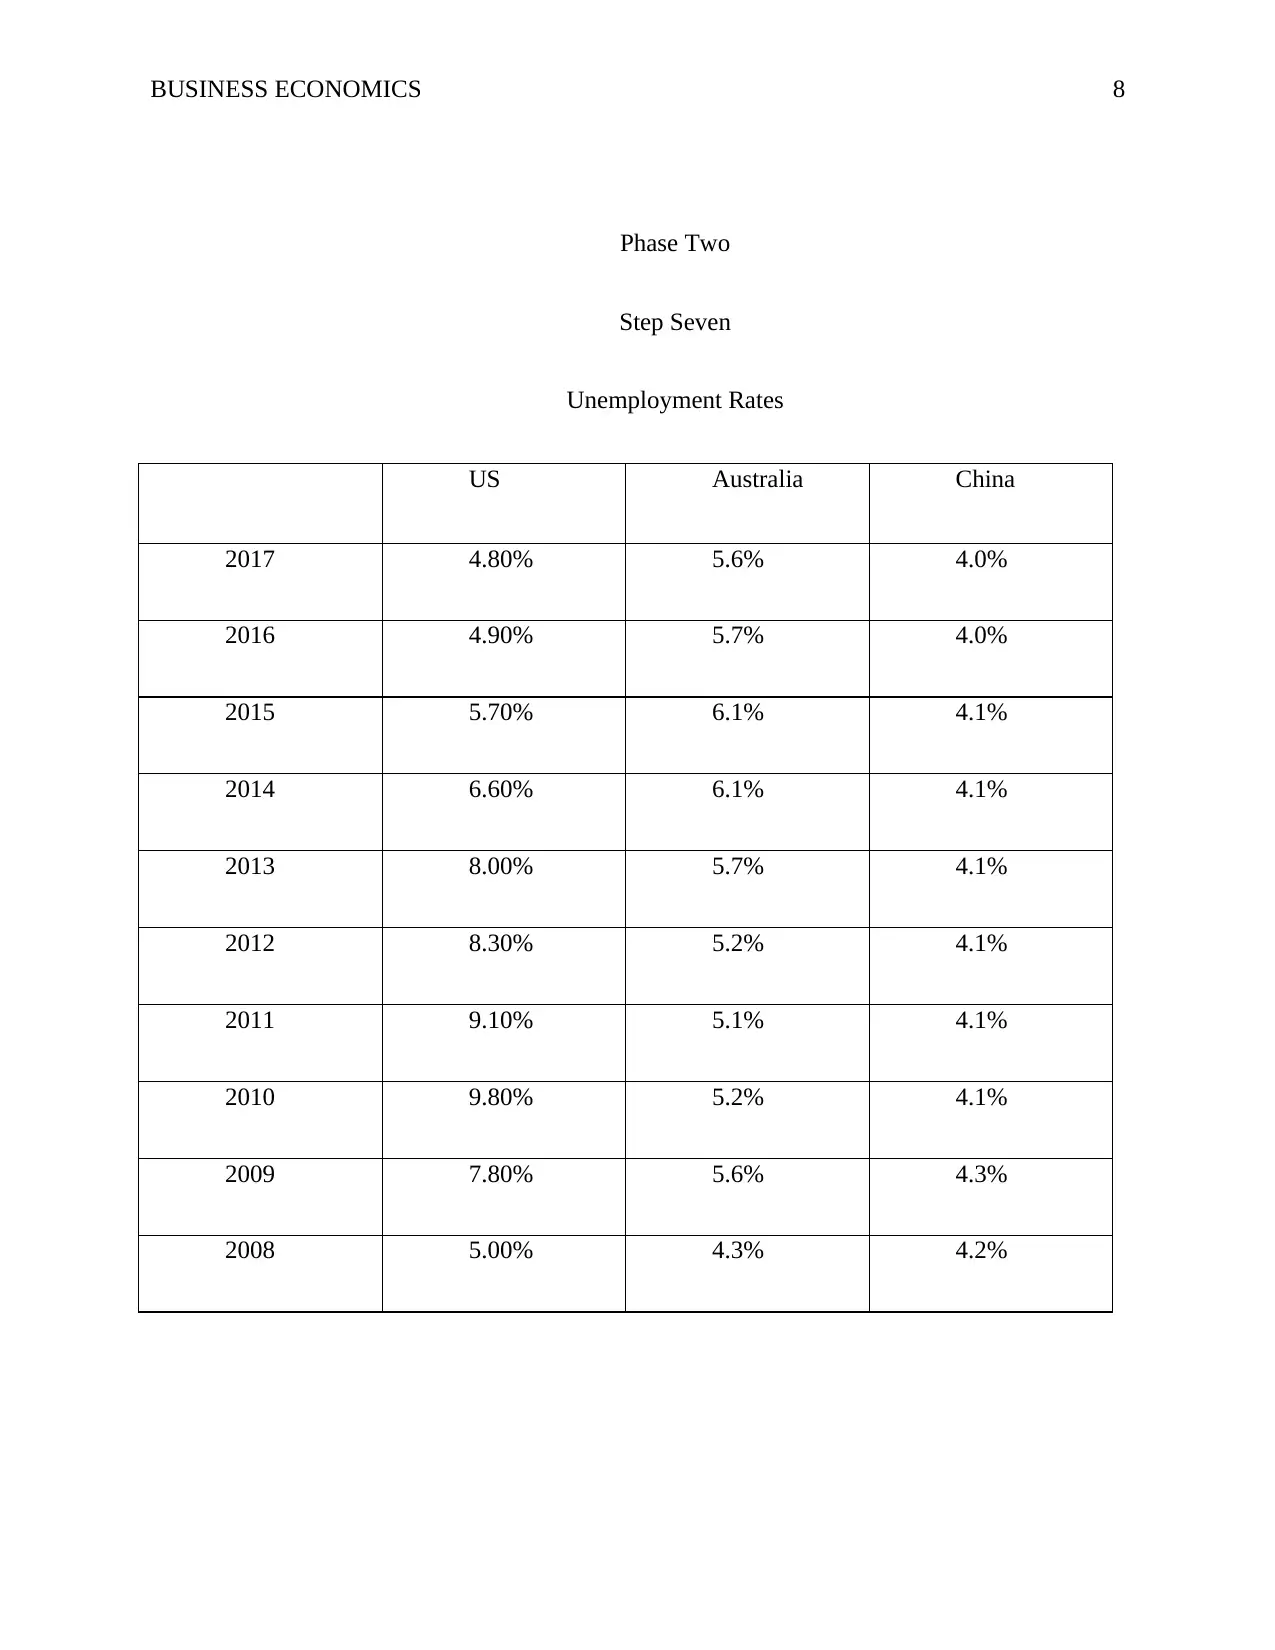
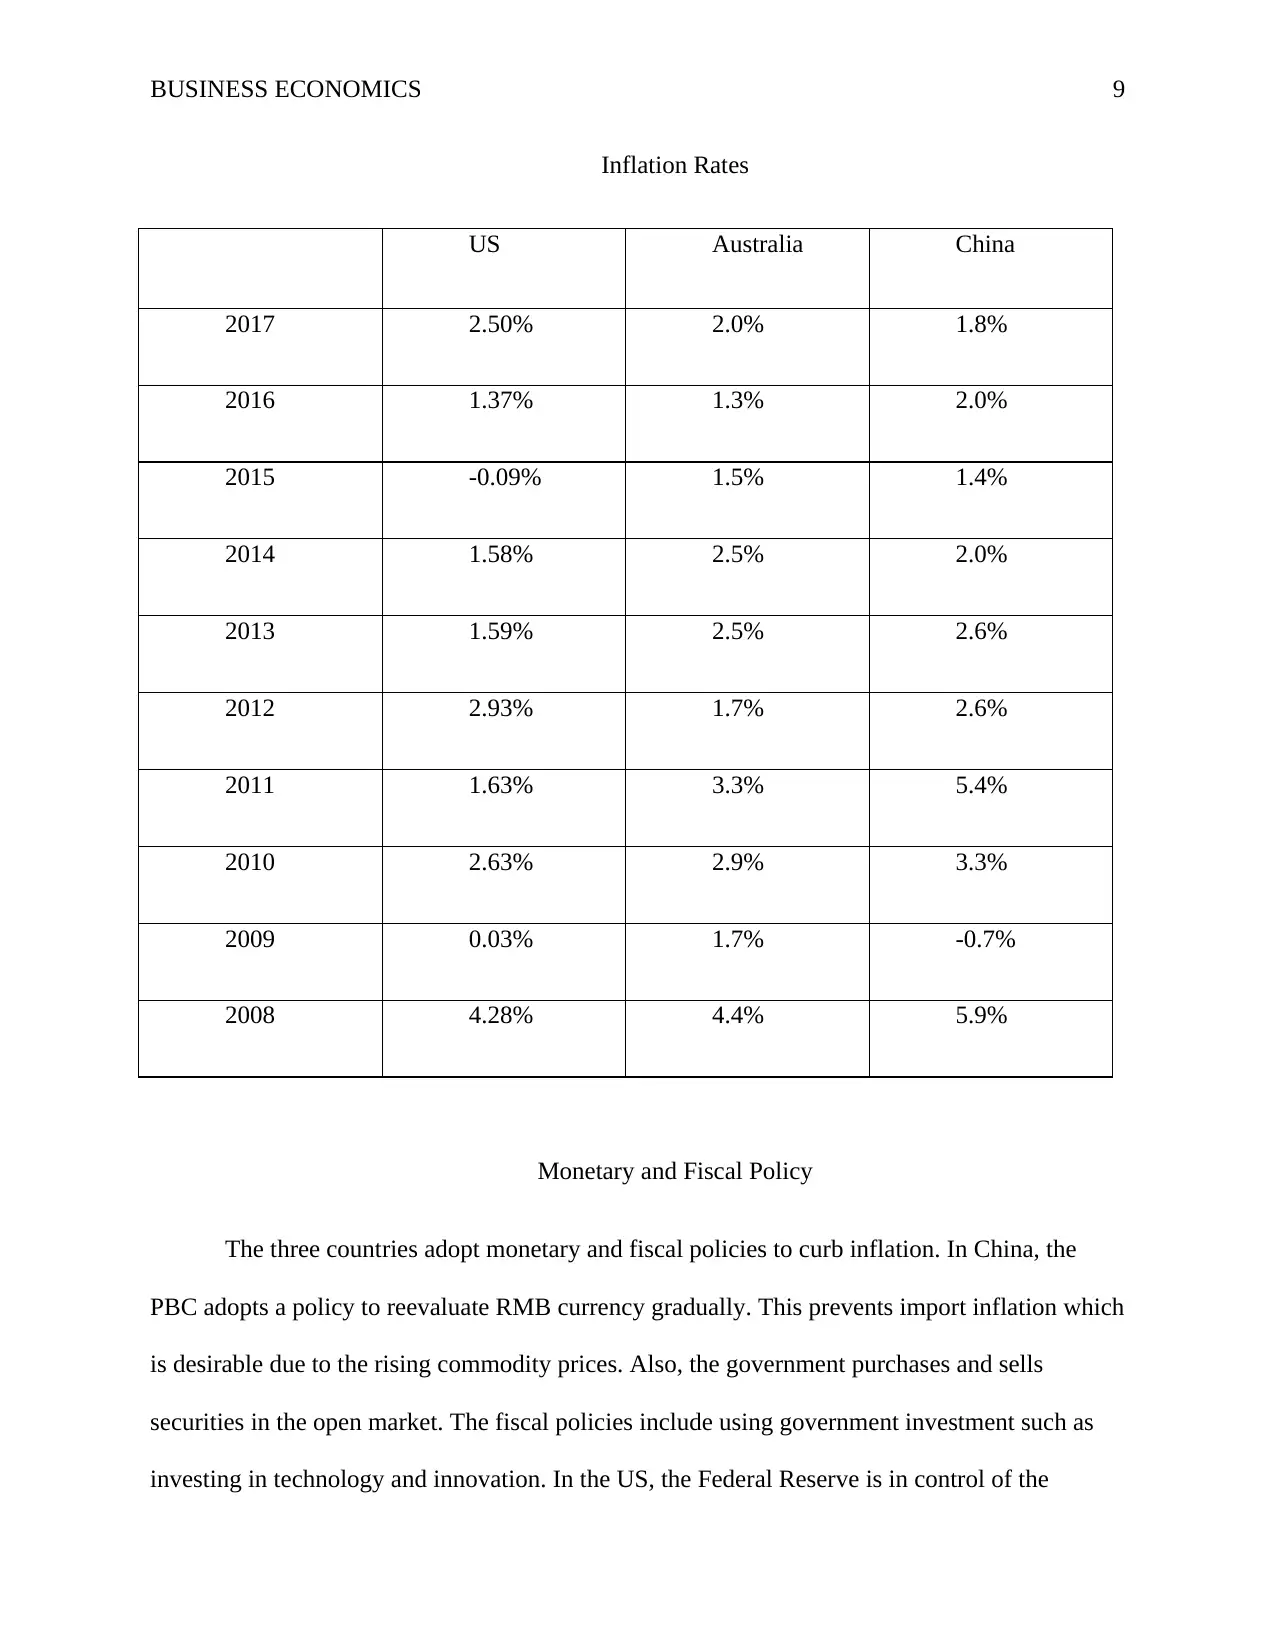
This report provides a comprehensive analysis of business economics, focusing on the concept of economic equilibrium within the US, Australia, and China. The report begins with an introduction to stable equilibrium and shifts in aggregate demand and supply curves, discussing how these shifts lead to market imbalances and price adjustments. It then delves into aggregate demand and supply, explaining the factors that influence these curves in both the short-run and long-run. The report also explores the characteristics of a stable economy and the phases of the business cycle, including contraction and expansion. The second part of the report provides a comparative analysis of the three countries, presenting unemployment and inflation rates from 2008 to 2017. It examines the monetary and fiscal policies adopted by each country to manage inflation and maintain economic stability, including the reevaluation of the RMB currency in China, the Federal Reserve's influence in the US, and the Reserve Bank's role in Australia. The report concludes by summarizing the economic stability of the three nations, highlighting their low inflation rates and economic output increases.
Document Page
Running Head: BUSINESS ECONOMICS 1
Business Economics
Name:
Institution
tabler-icon-diamond-filled.svg

Paraphrase This Document

Need a fresh take? Get an instant paraphrase of this document with our AI Paraphraser
Document Page
BUSINESS ECONOMICS 2
Phase One
Introduction
A stable equilibrium exists when a system returns to equilibrium once the stability is
interrupted. A change in demand or supply’s determinant shifts the corresponding demand or
supply curve. The change disrupts the balance resulting in a shortage or surplus. Due to market
imbalance, prices change. This results in changes in quantity demanded, and the amount
supplied. Change in the amount eliminates shortages or surplus restoring market equilibrium.
The assignment addresses equilibrium state of the US, Australia, and China’s economy.
Step One
Aggregate demand refers to the measurement of final goods and services produced in a
country. Aggregate demand is expressed as the total money exchanged for these commodities. It
is measured using market value, thus representing total output at a given price.
The nature of aggregate demand curve slopes from left to right (Galí, 2013). There is a
decrease or increase in demand along the curve due to changes in goods’ and services’ prices.
Document Page
BUSINESS ECONOMICS 3
Also, the curve shifts when money supply and tax rates change. The curve slopes downwards
due to the following reasons; first, at a reduced price level, consumers tend to have higher
disposable income. Thus they spend more. Second, there is increased demand for exports
resulting from lower price levels. Lastly, at lower price levels, there is a fall in interest rates
causing a higher aggregate demand.
Step Two
Short-run AS
Short-run aggregate supply is the sum of goods and services generated in an economy at
specific. The shifting factors include; first, government policies such as taxes temporary affect
aggregate price levels. Some resources necessary for production are fixed (Reifschneider,
Wascher & Wilcox, 2015) output supplied. This affects the short run supply curve. Second, at
the same price level, a rise in factor cost makes production less profitable. This causes the AS to
shift leftwards.
Document Page
BUSINESS ECONOMICS 4
Long-run AS
Long-run aggregate demand indicates a relationship between price level and output in the
long-run. However, input prices are not considered constant. The shifting factors include; first,
increase in quantity factors results to rise in employment real national income (Angeli, Amrit &
Rawlings, 2012). This is because more resources are available for production. Second, there is an
increase in full employment real national income due to improved factor quality. This leads to
the same quantity of factors producing more output. Third, advanced technology, innovation, and
globalization result to increased production with the same amount of resources.
tabler-icon-diamond-filled.svg

Paraphrase This Document

Need a fresh take? Get an instant paraphrase of this document with our AI Paraphraser
Document Page
BUSINESS ECONOMICS 5
Step Three
A stable economy refers to a nation whose financial system displays minor variances in
its output growth. Consequently, it exhibits steady low inflation rates (Lopez & Papell, 2012). A
stable economy is considered as a desirable state for any developed nation. The stability of an
economy is encouraged by a nation’s policies and actions of its central bank.
Step Four
Economic contraction is also referred as a recession. Contraction is a representation of
shrinking money supply as firms and consumers limit borrowing and spending. The auto
Document Page
BUSINESS ECONOMICS 6
adjustment from expansion accelerates products and demand growth (Gabisch & Lorenz, 2013).
The interest rates also increase, and the currency appreciates. Increased interest rates discourage
consumption of goods and services. Also, appreciation in currency reduces exports and
accelerates imports.
Step Five
The expansionary phase follows the trough phase. In auto adjustment, the Central Bank
manages the business cycle by planning its monetary policy. The bank lowers interest rates and
adds money to the financial system (Koellinger & Thurik, 2012). The Central Bank adds money
by buying Treasury Bonds in an open market. Hence, bonds held in portfolios are replaced with
cash which investors save in banks. In return, the banks become eager to lend out this extra
capital. The organizations thus make use of the availability of loans and low-interest rates to
employ workers and buy equipment. This results in a high rate of production of goods and
services to cater for the rising consumer demand.
Document Page
BUSINESS ECONOMICS 7
Step Six
At the expansion stage, the economy is growing. The gross domestic product used to
measure economic output increases with its range being between 2-3 percent. The natural rate of
4.5-5.0 percent in unemployment is attained. Also, inflation rate nears 2 percent. Once GDP,
inflation, and unemployment rates are past the expected percentage, the economy becomes
unstable (Nenovsky, Tochkov & Turcu, 2013). Contraction phase takes place after the peak
phase to offset the economic instability. At recession phase, output levels decrease. Households
demand goods and services begin to decline. The low household demand results to pile up of
unsold goods. This results in low inflation rates since demand is lower than the supply of
commodities. Unemployment levels as well rise. This lasts until the end of contraction phase
where firms start to hire new employees. The contraction and expansion phases ensure that the
economy remains stable.
tabler-icon-diamond-filled.svg

Paraphrase This Document

Need a fresh take? Get an instant paraphrase of this document with our AI Paraphraser
Document Page
BUSINESS ECONOMICS 8
Phase Two
Step Seven
Unemployment Rates
US Australia China
2017 4.80% 5.6% 4.0%
2016 4.90% 5.7% 4.0%
2015 5.70% 6.1% 4.1%
2014 6.60% 6.1% 4.1%
2013 8.00% 5.7% 4.1%
2012 8.30% 5.2% 4.1%
2011 9.10% 5.1% 4.1%
2010 9.80% 5.2% 4.1%
2009 7.80% 5.6% 4.3%
2008 5.00% 4.3% 4.2%
Document Page
BUSINESS ECONOMICS 9
Inflation Rates
US Australia China
2017 2.50% 2.0% 1.8%
2016 1.37% 1.3% 2.0%
2015 -0.09% 1.5% 1.4%
2014 1.58% 2.5% 2.0%
2013 1.59% 2.5% 2.6%
2012 2.93% 1.7% 2.6%
2011 1.63% 3.3% 5.4%
2010 2.63% 2.9% 3.3%
2009 0.03% 1.7% -0.7%
2008 4.28% 4.4% 5.9%
Monetary and Fiscal Policy
The three countries adopt monetary and fiscal policies to curb inflation. In China, the
PBC adopts a policy to reevaluate RMB currency gradually. This prevents import inflation which
is desirable due to the rising commodity prices. Also, the government purchases and sells
securities in the open market. The fiscal policies include using government investment such as
investing in technology and innovation. In the US, the Federal Reserve is in control of the
Document Page
BUSINESS ECONOMICS 10
monetary policy and influences short-term interest rates (Engen, Laubach & Reifschneider,
2015). The US government tends to spend extra money and application of taxation measures to
influence economic performance. In Australia, the Reserve Bank sets the monetary policies by
setting interest rates on loans. The cash rate affects other interest rates. Additionally, the bank
ensures there is price stability and economic stability. In its fiscal policies, Australian
government encourages investment aimed at strengthening the long-term growth of the country.
Conclusion
From the preceding US, China, and Australian economy are in a stable equilibrium. The
three nations have low inflation rates. As at 2017, US had an inflation rate of 2.50%, Australia
2.0%, and China had 1.8%. Also, the three countries have experienced an increase in their
economic output.
References
tabler-icon-diamond-filled.svg

Paraphrase This Document

Need a fresh take? Get an instant paraphrase of this document with our AI Paraphraser
Document Page
BUSINESS ECONOMICS 11
Angeli, D., Amrit, R., & Rawlings, J. B. (2012). On average performance and stability of economic
model predictive control. IEEE transactions on automatic control, 57(7), 1615-1626.
Engen, E. M., Laubach, T., & Reifschneider, D. (2015). The macroeconomic effects of the
Federal Reserve's unconventional monetary policies.
Gabisch, G., & Lorenz, H. W. (2013). Business cycle theory: a survey of methods and concepts.
Springer Science & Business Media.
Galí, J. (2013). Notes for a new guide to Keynes (I): wages, aggregate demand, and
employment. Journal of the European Economic Association, 11(5), 973-1003.
Koellinger, P. D., & Roy Thurik, A. (2012). Entrepreneurship and the business cycle. Review of
Economics and Statistics, 94(4), 1143-1156.
Lopez, C., & Papell, D. H. (2012). Convergence of euro area inflation rates. Journal of
International Money and Finance, 31(6), 1440-1458.
Nenovsky, N., Tochkov, K., & Turcu, C. (2013). Monetary regimes, economic stability, and EU
accession: Comparing Bulgaria and Romania. Communist and Post-Communist
Studies, 46(1), 13-23.
Reifschneider, D., Wascher, W., & Wilcox, D. (2015). Aggregate supply in the United States:
recent developments and implications for the conduct of monetary policy. IMF Economic
Review, 63(1), 71-109.
chevron_up_icon
1 out of 11
circle_padding
hide_on_mobile
zoom_out_icon
[object Object]