Business Environment Analysis: Dr Pepper Snapple Group Report
VerifiedAdded on 2020/03/16
|16
|3645
|4030
Report
AI Summary
This comprehensive report provides a strategic analysis of the Dr Pepper Snapple Group (DPS), examining its business environment within the beverage industry. The report begins with a case abstract, followed by proposed vision and mission statements. It includes a competitive profile matrix (CPM) comparing DPS with major competitors like Coca-Cola and PepsiCo, along with external (EFE) and internal (IFE) factor evaluation matrices to assess opportunities, threats, strengths, and weaknesses. Financial ratio analysis, including profitability, liquidity, solvency, and efficiency ratios, offers insights into the company's financial health. SWOT strategies, a space matrix, and a quantitative strategic planning matrix (QSPM) are used to formulate strategic recommendations for the company's future. The report concludes with actionable recommendations and relevant references, providing a holistic overview of DPS's strategic position and potential for growth in a dynamic market.
BUSINESS ENVIRONMENT
Paraphrase This Document
Need a fresh take? Get an instant paraphrase of this document with our AI Paraphraser
Dr Pepper Snapple Group
Table of Contents
i. Case Abstract.......................................................................................................................................2
ii. Vision statement (Proposed)...............................................................................................................2
iii. Mission statement...............................................................................................................................2
iv. Competitive profile matrix (CPM)........................................................................................................3
v. External factor evaluation (EFE) matrix...............................................................................................4
vi. Internal audit.......................................................................................................................................5
vii. Financial Ratio Analysis....................................................................................................................6
viii. Internal factor evaluation (IFE) matrix.............................................................................................7
ix. SWOT strategies..................................................................................................................................8
x. Space Matrix........................................................................................................................................9
xi. Quantitative strategic plan matrix (QSPM)........................................................................................10
xii. Recommendation..........................................................................................................................13
References.................................................................................................................................................14
2
Dr Pepper Snapple Group
i. Case Abstract
The case of Dr. Pepper Snapple Group (DPS) is related to a comprehensive case of strategic
management that comprises of organizational chart, year-end financial statements, competitor
details, etc of the company. DPS is regarded as the emerging producer of flavored beverages in
Caribbean and North America wherein more than fifty brands is offered. It is the third biggest
producer of carbonated drinks pursuing a market share of five percent in aggregate. The major
competitors of the company are Coca-Cola and PepsiCo that have expected market shares of
47% and 21% respectively. Further, the company specializes in flavored soft drinks like
Clamato, &7up, etc. Besides, the company has 24 production plants that facilitates in enhancing
its business model. Moreover, its business model comprise of third-party distribution, direct-
store-delivery, and company-owned services (DPS, 2017). Soft drink companies encounter an
ever-changing world market. Nonetheless, the question DPS attempts to answer is that whether it
can cater to the requirements of its stakeholders, whether it can diversify into other product
markets, etc.
ii. Vision statement (Proposed)
To become the best choice for beverages in the entire world
iii. Mission statement
At Dr. Pepper Snapple Group, it is their vision to become the best beverage business throughout
America. For such purpose, the company’s brands have been synonymous with fun, flavor, and
refreshment since many generations that signifies the ability to develop in the future.
Furthermore, the ability of the company to offer its customers with better quality drinks products
indicates that in today’s society, its quality is unparalleled that makes it an international market
competitor (DPS, 2017). In addition, the company attempts in offering greater chances to its
employees so that they can be successful in future. Moreover, in order to offer greater quality
products, the company endeavors in utilizing latest technology products that can effectively
satisfy the customers (Gibson, 2017). Lastly, the company believes that adequate ethical conduct
is mandatory in its business environment because such mission can appropriately cater to the
requirements of the entire community as a whole (Demil & Lecoq, 2010). The company also
3
⊘ This is a preview!⊘
Do you want full access?
Subscribe today to unlock all pages.
Trusted by 1+ million students worldwide
Dr Pepper Snapple Group
incorporates its business strategy by stating that it concentrates on enhancing and building
leading brands, possessing profitable channels, leveraging an integrated framework of business,
enhancing operating effectiveness, etc.
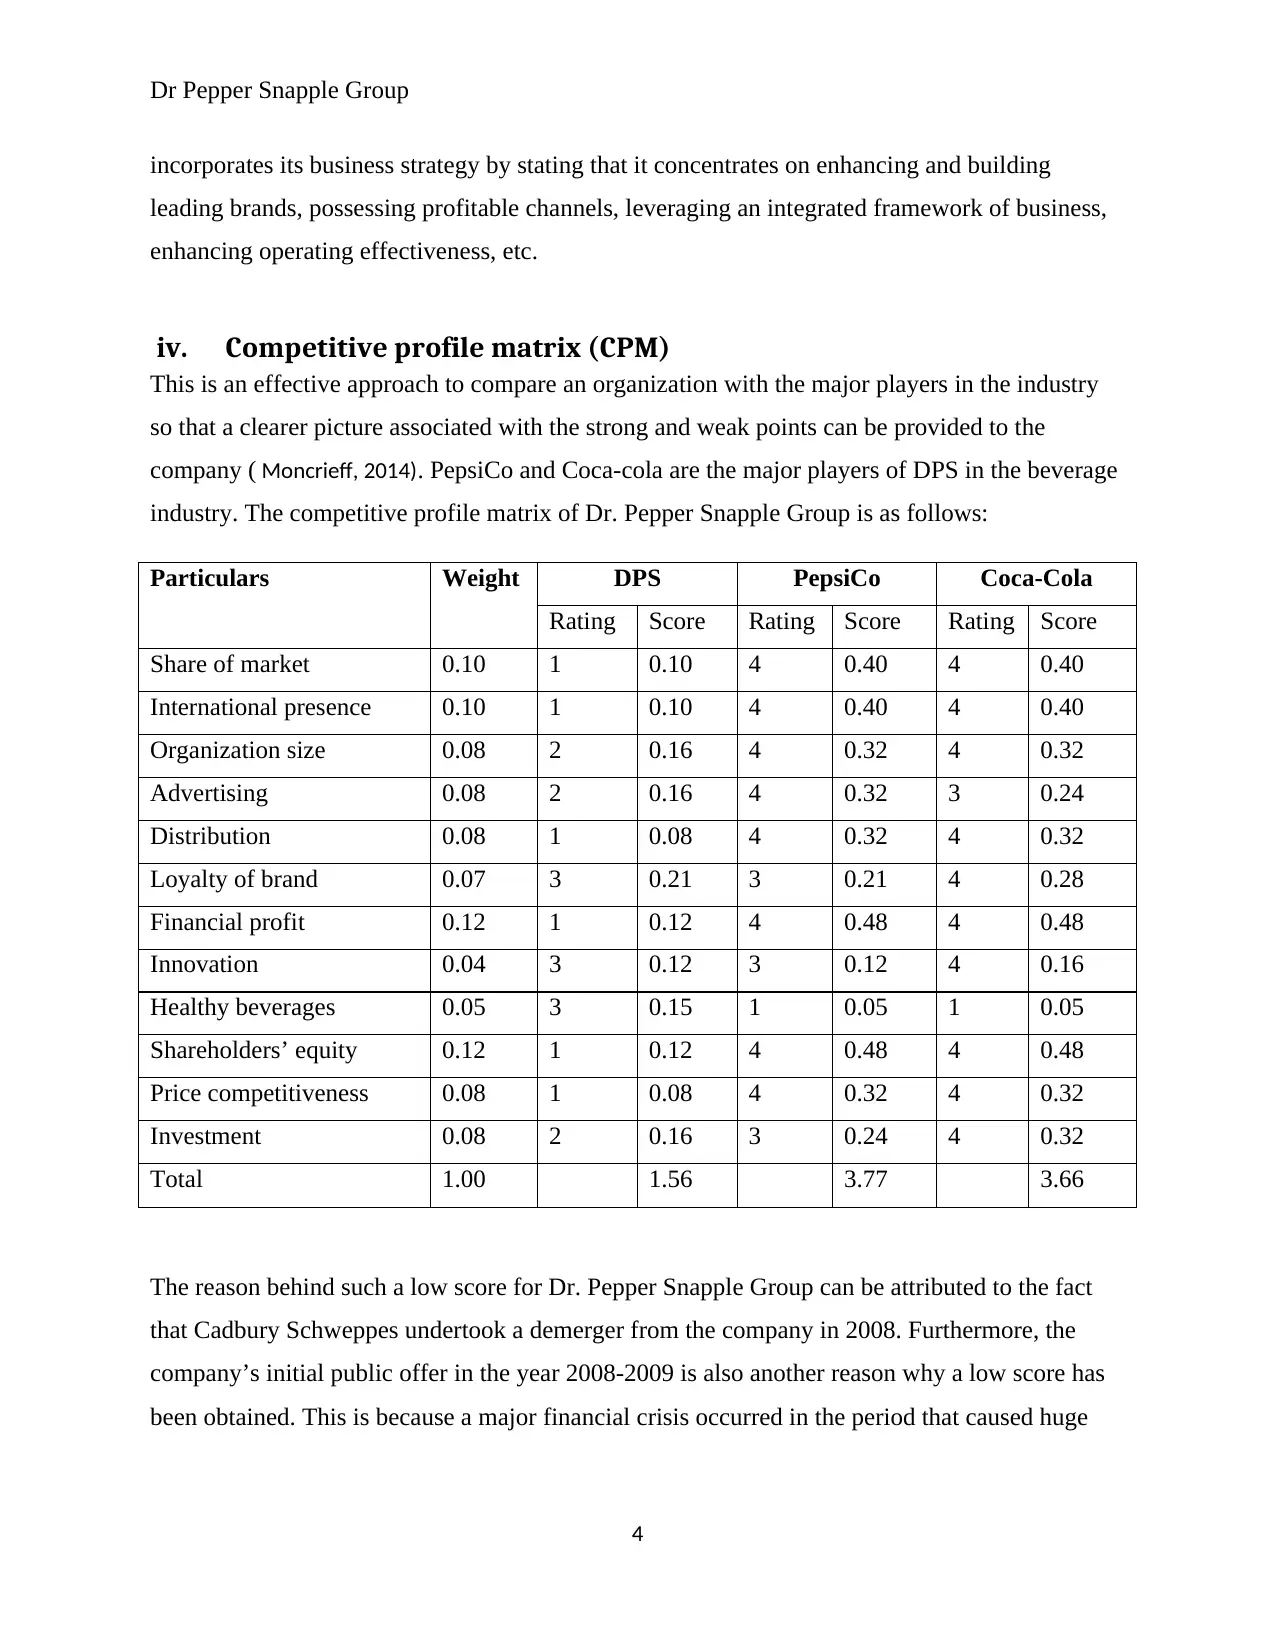
iv. Competitive profile matrix (CPM)
This is an effective approach to compare an organization with the major players in the industry
so that a clearer picture associated with the strong and weak points can be provided to the
company ( Moncrieff, 2014). PepsiCo and Coca-cola are the major players of DPS in the beverage
industry. The competitive profile matrix of Dr. Pepper Snapple Group is as follows:
Particulars Weight DPS PepsiCo Coca-Cola
Rating Score Rating Score Rating Score
Share of market 0.10 1 0.10 4 0.40 4 0.40
International presence 0.10 1 0.10 4 0.40 4 0.40
Organization size 0.08 2 0.16 4 0.32 4 0.32
Advertising 0.08 2 0.16 4 0.32 3 0.24
Distribution 0.08 1 0.08 4 0.32 4 0.32
Loyalty of brand 0.07 3 0.21 3 0.21 4 0.28
Financial profit 0.12 1 0.12 4 0.48 4 0.48
Innovation 0.04 3 0.12 3 0.12 4 0.16
Healthy beverages 0.05 3 0.15 1 0.05 1 0.05
Shareholders’ equity 0.12 1 0.12 4 0.48 4 0.48
Price competitiveness 0.08 1 0.08 4 0.32 4 0.32
Investment 0.08 2 0.16 3 0.24 4 0.32
Total 1.00 1.56 3.77 3.66
The reason behind such a low score for Dr. Pepper Snapple Group can be attributed to the fact
that Cadbury Schweppes undertook a demerger from the company in 2008. Furthermore, the
company’s initial public offer in the year 2008-2009 is also another reason why a low score has
been obtained. This is because a major financial crisis occurred in the period that caused huge
4
incorporates its business strategy by stating that it concentrates on enhancing and building
leading brands, possessing profitable channels, leveraging an integrated framework of business,
enhancing operating effectiveness, etc.
iv. Competitive profile matrix (CPM)
This is an effective approach to compare an organization with the major players in the industry
so that a clearer picture associated with the strong and weak points can be provided to the
company ( Moncrieff, 2014). PepsiCo and Coca-cola are the major players of DPS in the beverage
industry. The competitive profile matrix of Dr. Pepper Snapple Group is as follows:
Particulars Weight DPS PepsiCo Coca-Cola
Rating Score Rating Score Rating Score
Share of market 0.10 1 0.10 4 0.40 4 0.40
International presence 0.10 1 0.10 4 0.40 4 0.40
Organization size 0.08 2 0.16 4 0.32 4 0.32
Advertising 0.08 2 0.16 4 0.32 3 0.24
Distribution 0.08 1 0.08 4 0.32 4 0.32
Loyalty of brand 0.07 3 0.21 3 0.21 4 0.28
Financial profit 0.12 1 0.12 4 0.48 4 0.48
Innovation 0.04 3 0.12 3 0.12 4 0.16
Healthy beverages 0.05 3 0.15 1 0.05 1 0.05
Shareholders’ equity 0.12 1 0.12 4 0.48 4 0.48
Price competitiveness 0.08 1 0.08 4 0.32 4 0.32
Investment 0.08 2 0.16 3 0.24 4 0.32
Total 1.00 1.56 3.77 3.66
The reason behind such a low score for Dr. Pepper Snapple Group can be attributed to the fact
that Cadbury Schweppes undertook a demerger from the company in 2008. Furthermore, the
company’s initial public offer in the year 2008-2009 is also another reason why a low score has
been obtained. This is because a major financial crisis occurred in the period that caused huge
4
Paraphrase This Document
Need a fresh take? Get an instant paraphrase of this document with our AI Paraphraser
Dr Pepper Snapple Group
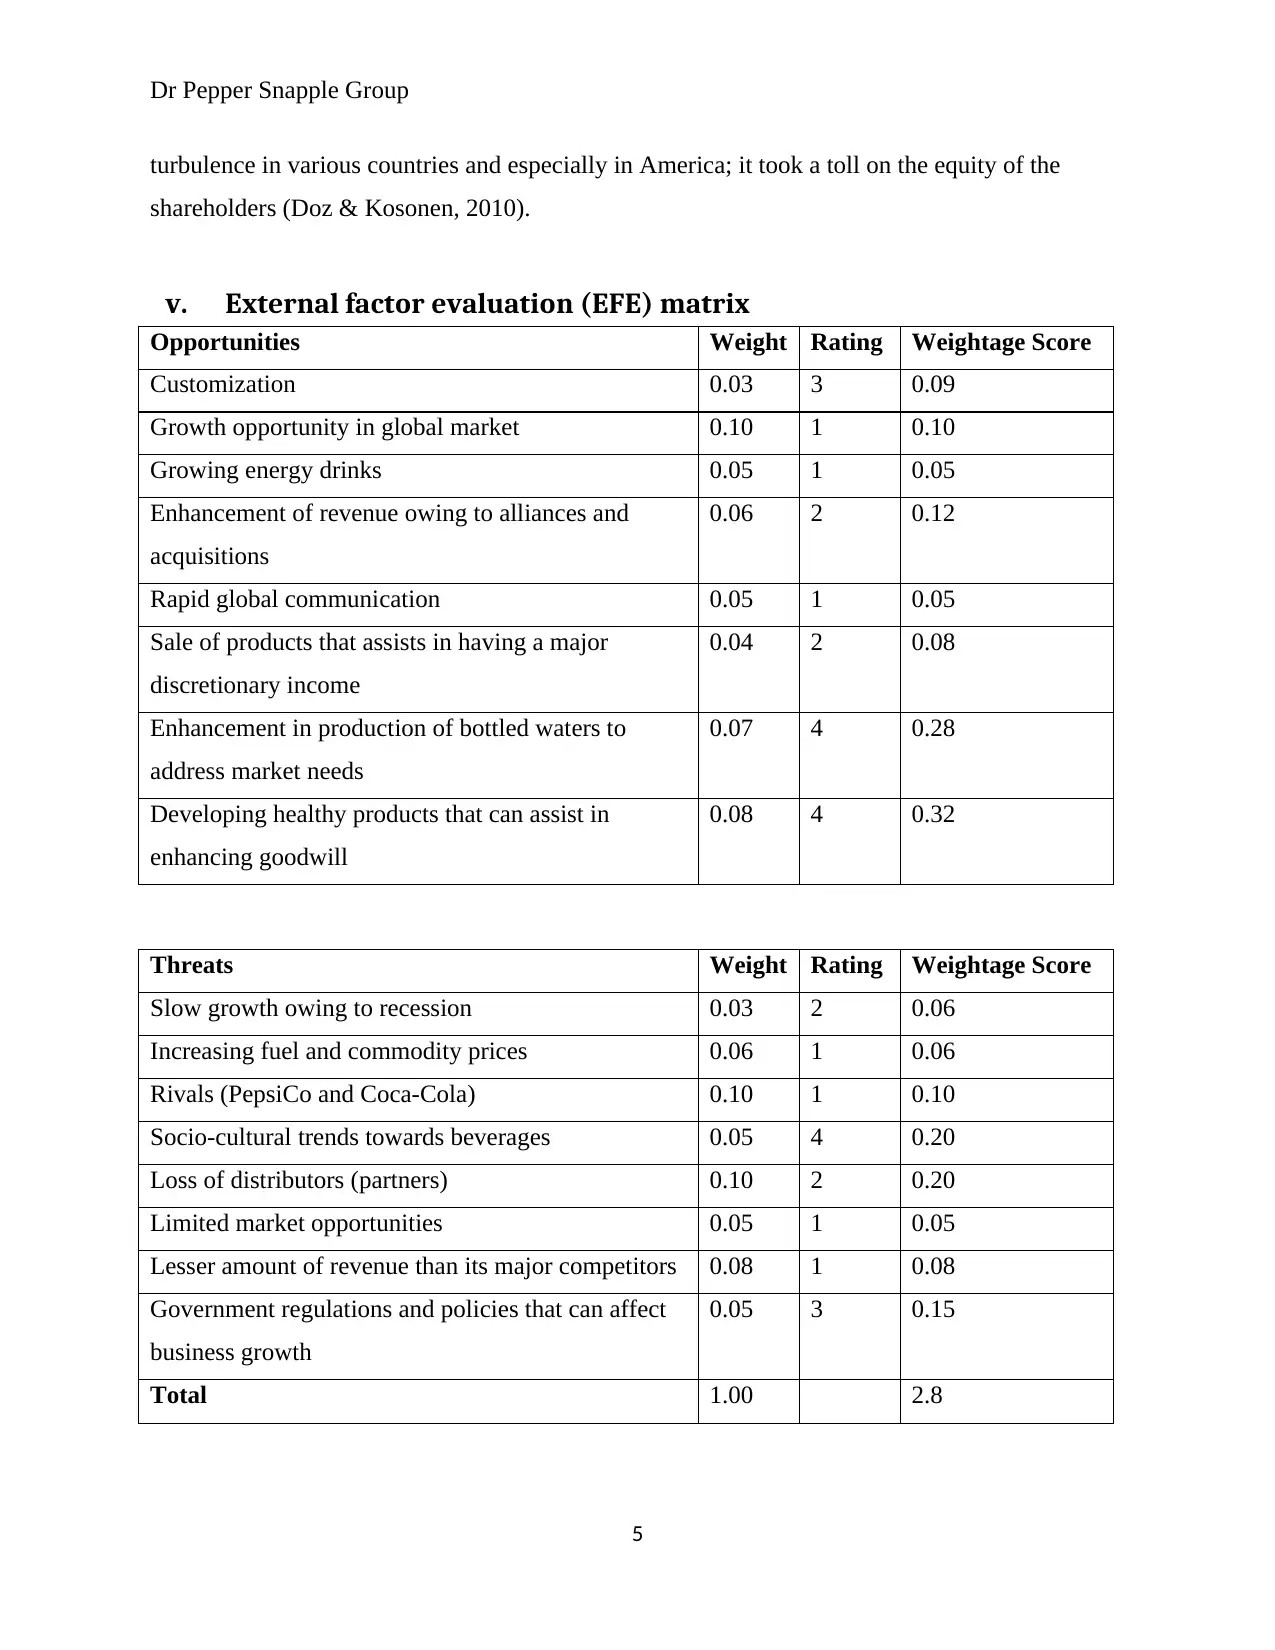
turbulence in various countries and especially in America; it took a toll on the equity of the
shareholders (Doz & Kosonen, 2010).
v. External factor evaluation (EFE) matrix
Opportunities Weight Rating Weightage Score
Customization 0.03 3 0.09
Growth opportunity in global market 0.10 1 0.10
Growing energy drinks 0.05 1 0.05
Enhancement of revenue owing to alliances and
acquisitions
0.06 2 0.12
Rapid global communication 0.05 1 0.05
Sale of products that assists in having a major
discretionary income
0.04 2 0.08
Enhancement in production of bottled waters to
address market needs
0.07 4 0.28
Developing healthy products that can assist in
enhancing goodwill
0.08 4 0.32
Threats Weight Rating Weightage Score
Slow growth owing to recession 0.03 2 0.06
Increasing fuel and commodity prices 0.06 1 0.06
Rivals (PepsiCo and Coca-Cola) 0.10 1 0.10
Socio-cultural trends towards beverages 0.05 4 0.20
Loss of distributors (partners) 0.10 2 0.20
Limited market opportunities 0.05 1 0.05
Lesser amount of revenue than its major competitors 0.08 1 0.08
Government regulations and policies that can affect
business growth
0.05 3 0.15
Total 1.00 2.8
5
Dr Pepper Snapple Group
It can be seen from the above matrix computation that the company has attained an above
average rating of 2.8 from a feasible 4.0. The reason behind this can be attributed to the fact that
the company has maintained its quality of beverages and its upcoming line of health-conscious
drinks like the Dr. Pepper Ten (10) has also played a major role in the derivation of such rating
(Osterwalder & Pigneur, 2010).
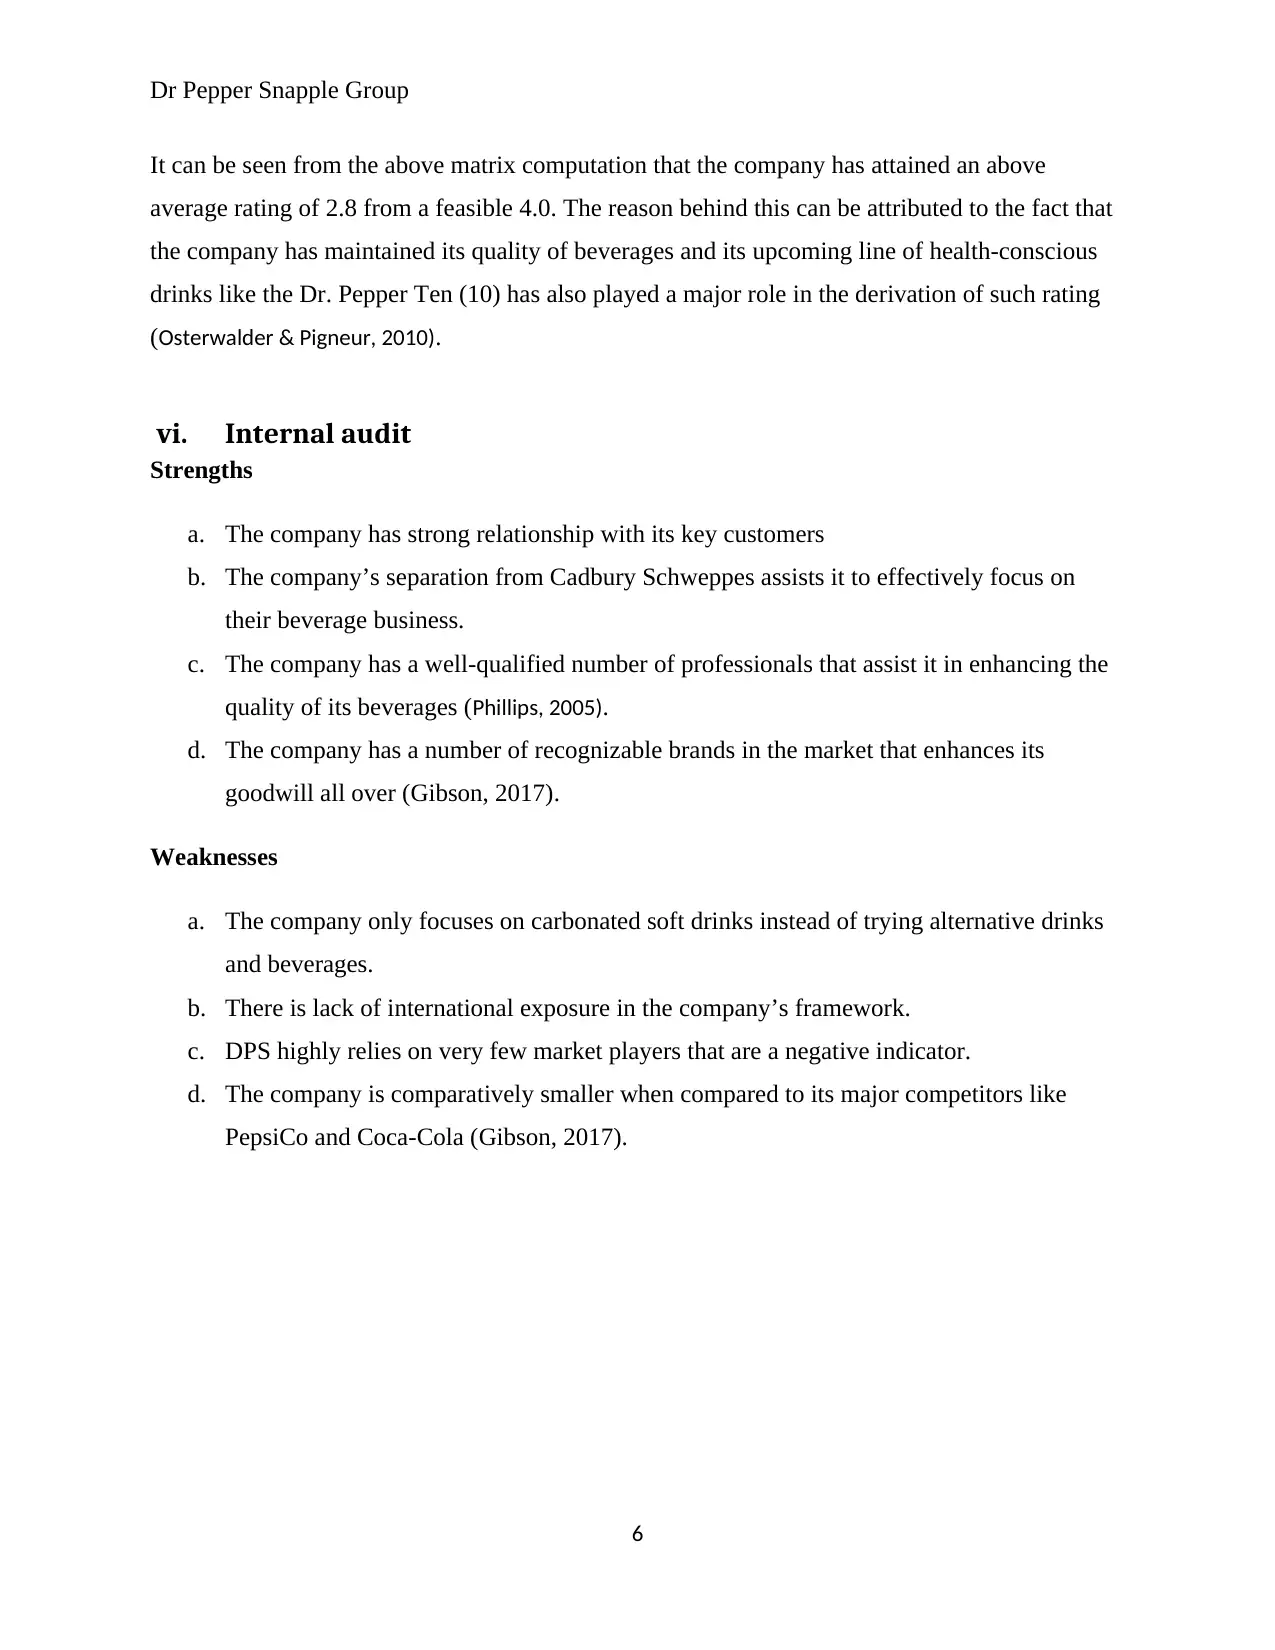
vi. Internal audit
Strengths
a. The company has strong relationship with its key customers
b. The company’s separation from Cadbury Schweppes assists it to effectively focus on
their beverage business.
c. The company has a well-qualified number of professionals that assist it in enhancing the
quality of its beverages (Phillips, 2005).
d. The company has a number of recognizable brands in the market that enhances its
goodwill all over (Gibson, 2017).
Weaknesses
a. The company only focuses on carbonated soft drinks instead of trying alternative drinks
and beverages.
b. There is lack of international exposure in the company’s framework.
c. DPS highly relies on very few market players that are a negative indicator.
d. The company is comparatively smaller when compared to its major competitors like
PepsiCo and Coca-Cola (Gibson, 2017).
6
It can be seen from the above matrix computation that the company has attained an above
average rating of 2.8 from a feasible 4.0. The reason behind this can be attributed to the fact that
the company has maintained its quality of beverages and its upcoming line of health-conscious
drinks like the Dr. Pepper Ten (10) has also played a major role in the derivation of such rating
(Osterwalder & Pigneur, 2010).
vi. Internal audit
Strengths
a. The company has strong relationship with its key customers
b. The company’s separation from Cadbury Schweppes assists it to effectively focus on
their beverage business.
c. The company has a well-qualified number of professionals that assist it in enhancing the
quality of its beverages (Phillips, 2005).
d. The company has a number of recognizable brands in the market that enhances its
goodwill all over (Gibson, 2017).
Weaknesses
a. The company only focuses on carbonated soft drinks instead of trying alternative drinks
and beverages.
b. There is lack of international exposure in the company’s framework.
c. DPS highly relies on very few market players that are a negative indicator.
d. The company is comparatively smaller when compared to its major competitors like
PepsiCo and Coca-Cola (Gibson, 2017).
6
⊘ This is a preview!⊘
Do you want full access?
Subscribe today to unlock all pages.
Trusted by 1+ million students worldwide
Dr Pepper Snapple Group
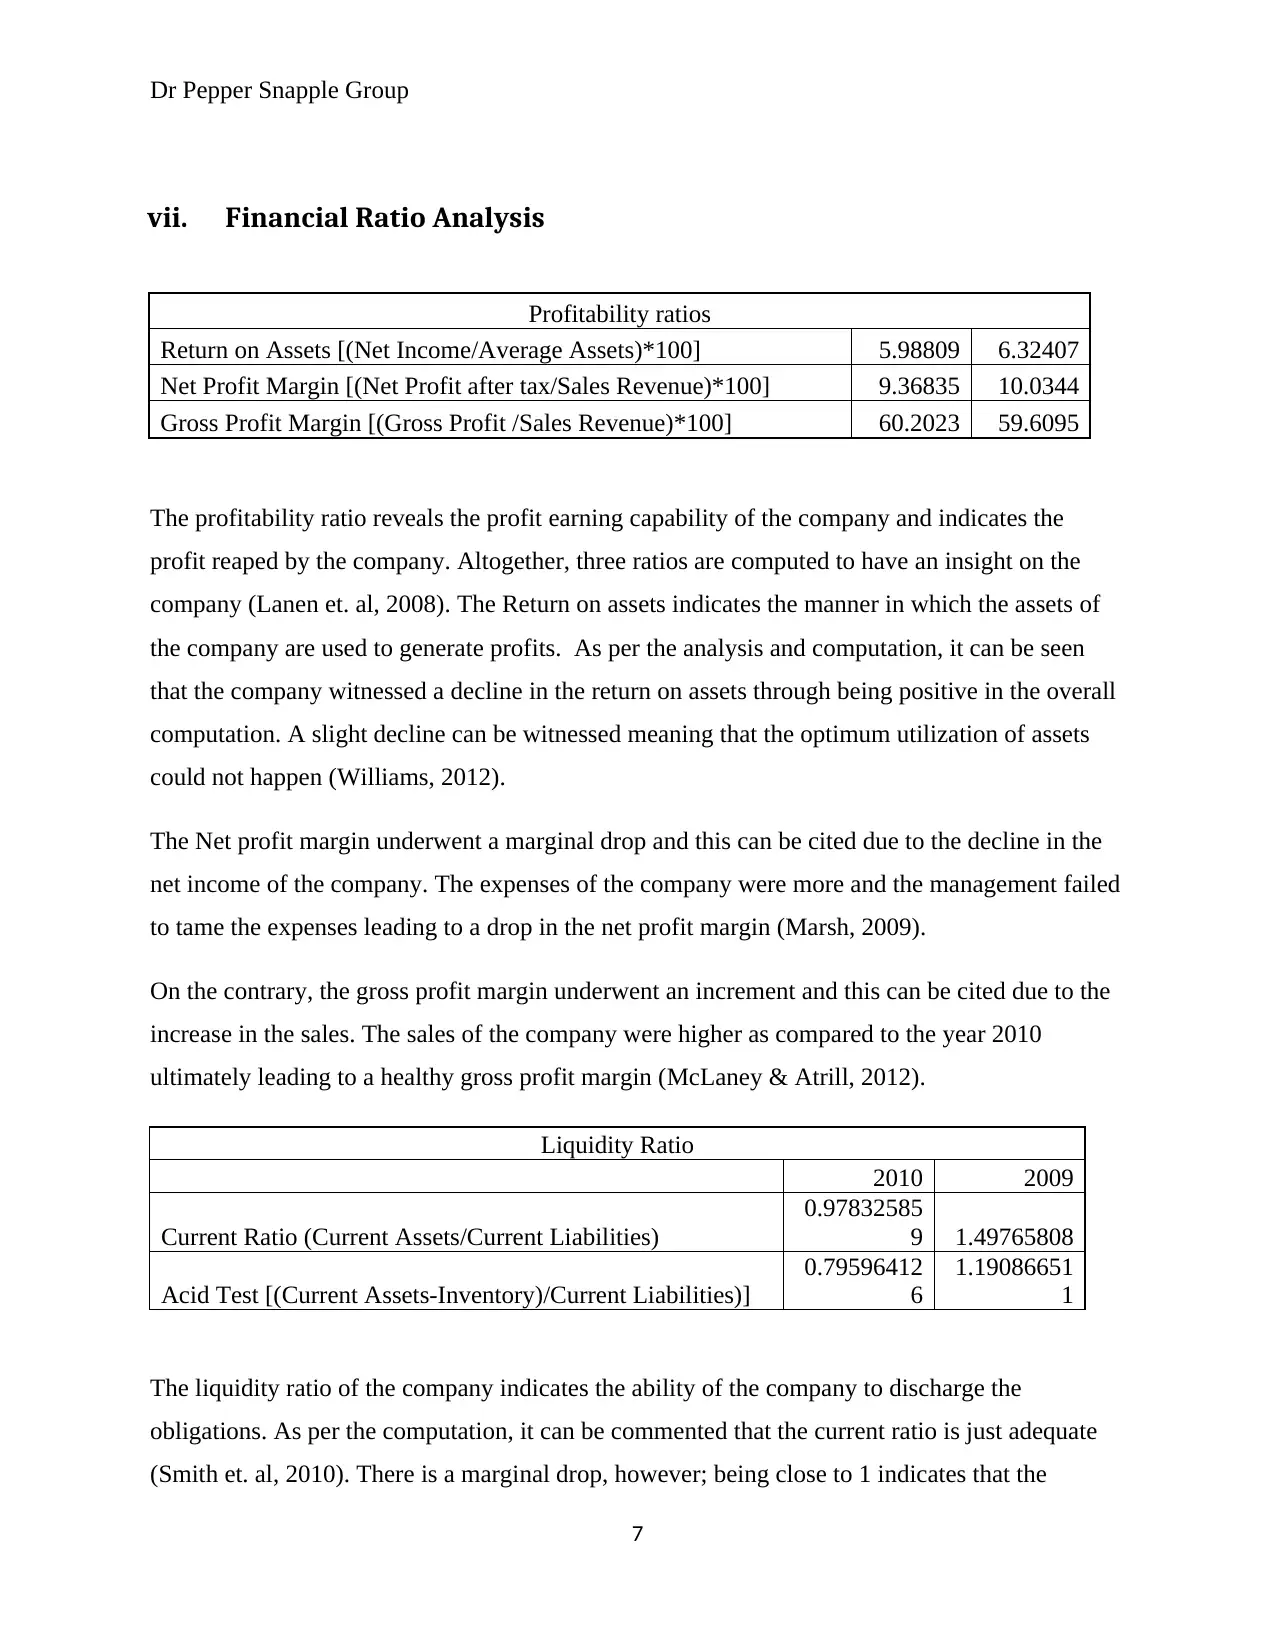
vii. Financial Ratio Analysis
Profitability ratios
Return on Assets [(Net Income/Average Assets)*100] 5.98809 6.32407
Net Profit Margin [(Net Profit after tax/Sales Revenue)*100] 9.36835 10.0344
Gross Profit Margin [(Gross Profit /Sales Revenue)*100] 60.2023 59.6095
The profitability ratio reveals the profit earning capability of the company and indicates the
profit reaped by the company. Altogether, three ratios are computed to have an insight on the
company (Lanen et. al, 2008). The Return on assets indicates the manner in which the assets of
the company are used to generate profits. As per the analysis and computation, it can be seen
that the company witnessed a decline in the return on assets through being positive in the overall
computation. A slight decline can be witnessed meaning that the optimum utilization of assets
could not happen (Williams, 2012).
The Net profit margin underwent a marginal drop and this can be cited due to the decline in the
net income of the company. The expenses of the company were more and the management failed
to tame the expenses leading to a drop in the net profit margin (Marsh, 2009).
On the contrary, the gross profit margin underwent an increment and this can be cited due to the
increase in the sales. The sales of the company were higher as compared to the year 2010
ultimately leading to a healthy gross profit margin (McLaney & Atrill, 2012).
Liquidity Ratio
2010 2009
Current Ratio (Current Assets/Current Liabilities)
0.97832585
9 1.49765808
Acid Test [(Current Assets-Inventory)/Current Liabilities)]
0.79596412
6
1.19086651
1
The liquidity ratio of the company indicates the ability of the company to discharge the
obligations. As per the computation, it can be commented that the current ratio is just adequate
(Smith et. al, 2010). There is a marginal drop, however; being close to 1 indicates that the
7
Paraphrase This Document
Need a fresh take? Get an instant paraphrase of this document with our AI Paraphraser
Dr Pepper Snapple Group
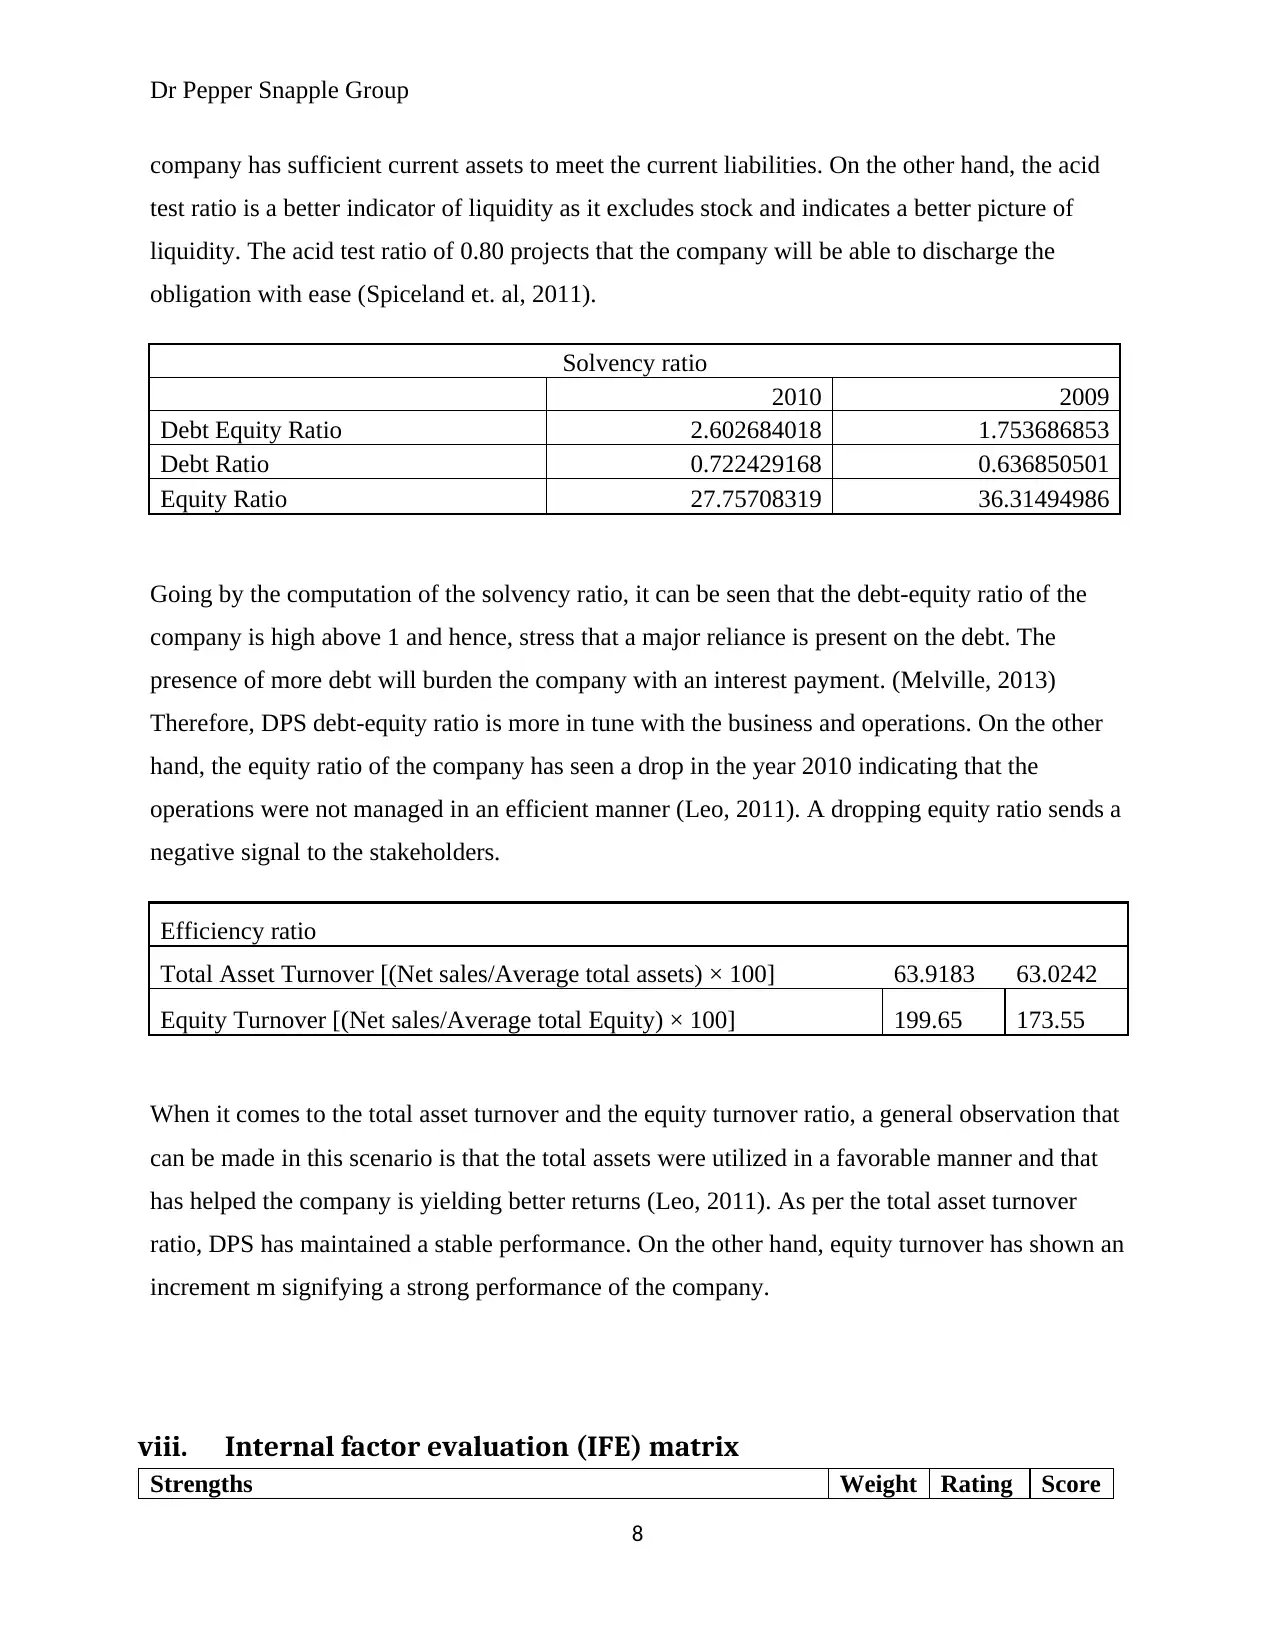
company has sufficient current assets to meet the current liabilities. On the other hand, the acid
test ratio is a better indicator of liquidity as it excludes stock and indicates a better picture of
liquidity. The acid test ratio of 0.80 projects that the company will be able to discharge the
obligation with ease (Spiceland et. al, 2011).
Solvency ratio
2010 2009
Debt Equity Ratio 2.602684018 1.753686853
Debt Ratio 0.722429168 0.636850501
Equity Ratio 27.75708319 36.31494986
Going by the computation of the solvency ratio, it can be seen that the debt-equity ratio of the
company is high above 1 and hence, stress that a major reliance is present on the debt. The
presence of more debt will burden the company with an interest payment. (Melville, 2013)
Therefore, DPS debt-equity ratio is more in tune with the business and operations. On the other
hand, the equity ratio of the company has seen a drop in the year 2010 indicating that the
operations were not managed in an efficient manner (Leo, 2011). A dropping equity ratio sends a
negative signal to the stakeholders.
Efficiency ratio
Total Asset Turnover [(Net sales/Average total assets) × 100] 63.9183 63.0242
Equity Turnover [(Net sales/Average total Equity) × 100] 199.65 173.55
When it comes to the total asset turnover and the equity turnover ratio, a general observation that
can be made in this scenario is that the total assets were utilized in a favorable manner and that
has helped the company is yielding better returns (Leo, 2011). As per the total asset turnover
ratio, DPS has maintained a stable performance. On the other hand, equity turnover has shown an
increment m signifying a strong performance of the company.
viii. Internal factor evaluation (IFE) matrix
Strengths Weight Rating Score
8
Dr Pepper Snapple Group
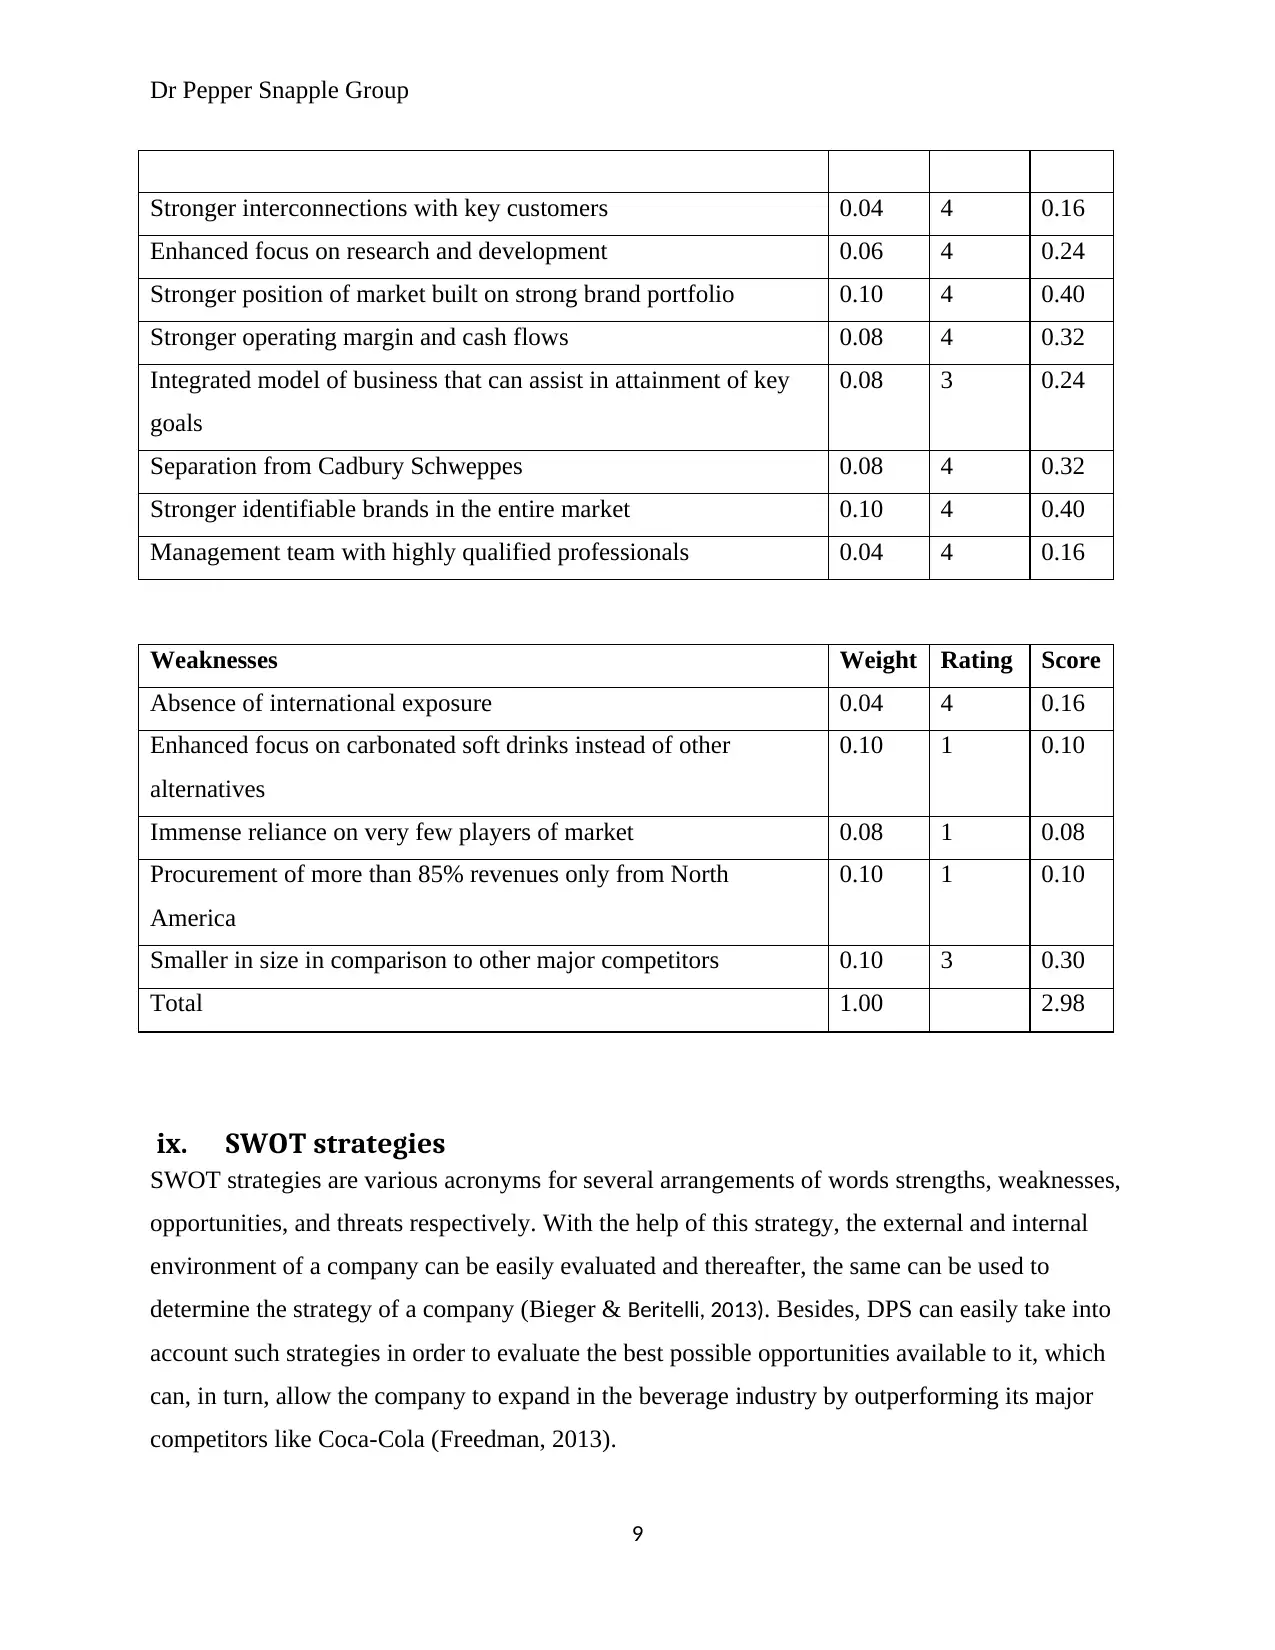
Stronger interconnections with key customers 0.04 4 0.16
Enhanced focus on research and development 0.06 4 0.24
Stronger position of market built on strong brand portfolio 0.10 4 0.40
Stronger operating margin and cash flows 0.08 4 0.32
Integrated model of business that can assist in attainment of key
goals
0.08 3 0.24
Separation from Cadbury Schweppes 0.08 4 0.32
Stronger identifiable brands in the entire market 0.10 4 0.40
Management team with highly qualified professionals 0.04 4 0.16
Weaknesses Weight Rating Score
Absence of international exposure 0.04 4 0.16
Enhanced focus on carbonated soft drinks instead of other
alternatives
0.10 1 0.10
Immense reliance on very few players of market 0.08 1 0.08
Procurement of more than 85% revenues only from North
America
0.10 1 0.10
Smaller in size in comparison to other major competitors 0.10 3 0.30
Total 1.00 2.98
ix. SWOT strategies
SWOT strategies are various acronyms for several arrangements of words strengths, weaknesses,
opportunities, and threats respectively. With the help of this strategy, the external and internal
environment of a company can be easily evaluated and thereafter, the same can be used to
determine the strategy of a company (Bieger & Beritelli, 2013). Besides, DPS can easily take into
account such strategies in order to evaluate the best possible opportunities available to it, which
can, in turn, allow the company to expand in the beverage industry by outperforming its major
competitors like Coca-Cola (Freedman, 2013).
9
⊘ This is a preview!⊘
Do you want full access?
Subscribe today to unlock all pages.
Trusted by 1+ million students worldwide
Dr Pepper Snapple Group
SO strategy
a. Procurement of suppliers in other parts of the world (S5, O4)
b. Increasing costs of advertising to attain international presence (S4, O2)
c. Investment in innovating products to address customer preferences (S1, S3, S7)
(Freedman, 2013)
WO strategy
a. Prevalence into bottled water markets (W2,O7)
b. Concentration on opportunities in high margin and growth (W2, O1,O7, O8) (Zhang &
Queto, 2015)
c. Improvement in the distribution network by actively engaging with domestic distributors
(Freedman, 2013)
ST strategy
a. Utilization of management expertise (S8, T2)
b. Owing to healthier products, market-to-consumer can be easily facilitated (S1, S3, T2,
T6) (Needles & Powers, 2013)
WT strategy
a. Creative and market variety of various functional items (W5, T1)
b. Excessive advertisement in order to compete with competitors (W4, T6, T7)
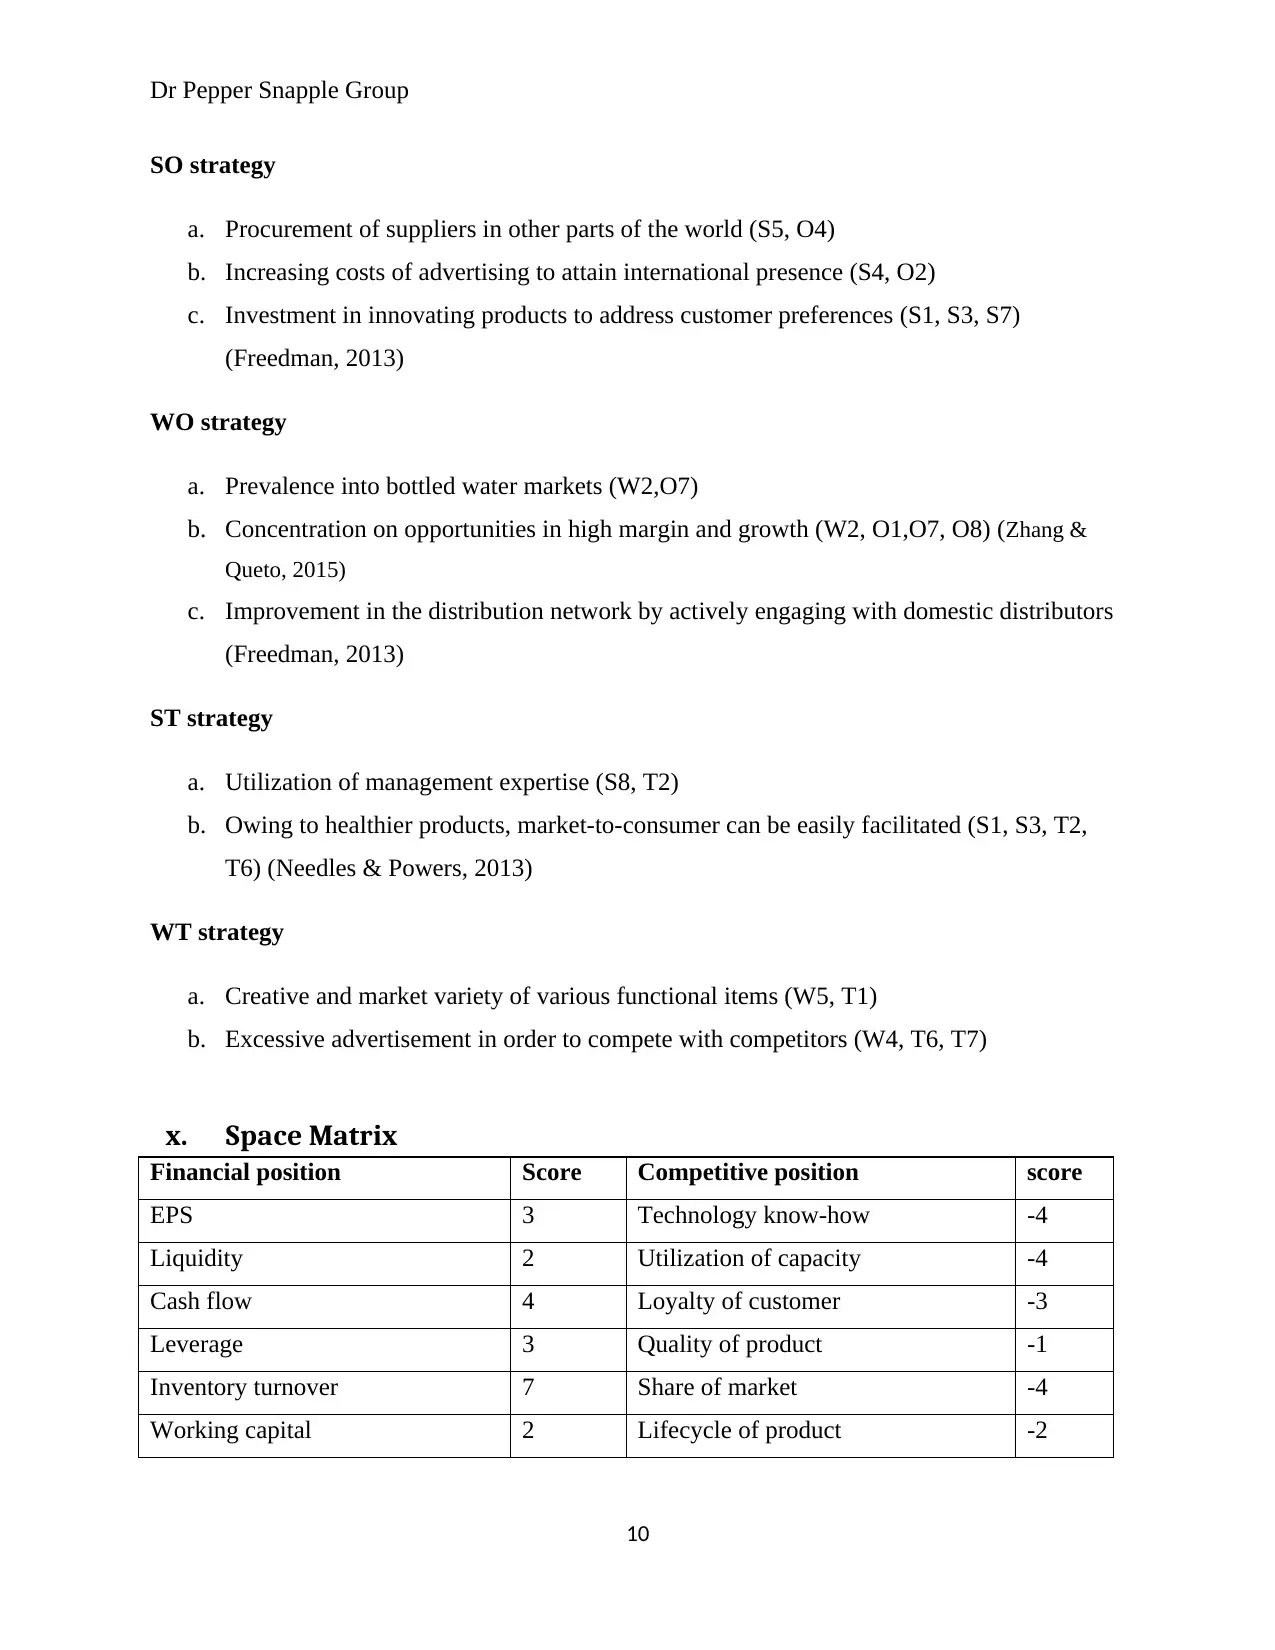
x. Space Matrix
Financial position Score Competitive position score
EPS 3 Technology know-how -4
Liquidity 2 Utilization of capacity -4
Cash flow 4 Loyalty of customer -3
Leverage 3 Quality of product -1
Inventory turnover 7 Share of market -4
Working capital 2 Lifecycle of product -2
10
SO strategy
a. Procurement of suppliers in other parts of the world (S5, O4)
b. Increasing costs of advertising to attain international presence (S4, O2)
c. Investment in innovating products to address customer preferences (S1, S3, S7)
(Freedman, 2013)
WO strategy
a. Prevalence into bottled water markets (W2,O7)
b. Concentration on opportunities in high margin and growth (W2, O1,O7, O8) (Zhang &
Queto, 2015)
c. Improvement in the distribution network by actively engaging with domestic distributors
(Freedman, 2013)
ST strategy
a. Utilization of management expertise (S8, T2)
b. Owing to healthier products, market-to-consumer can be easily facilitated (S1, S3, T2,
T6) (Needles & Powers, 2013)
WT strategy
a. Creative and market variety of various functional items (W5, T1)
b. Excessive advertisement in order to compete with competitors (W4, T6, T7)
x. Space Matrix
Financial position Score Competitive position score
EPS 3 Technology know-how -4
Liquidity 2 Utilization of capacity -4
Cash flow 4 Loyalty of customer -3
Leverage 3 Quality of product -1
Inventory turnover 7 Share of market -4
Working capital 2 Lifecycle of product -2
10
Paraphrase This Document
Need a fresh take? Get an instant paraphrase of this document with our AI Paraphraser
Dr Pepper Snapple Group
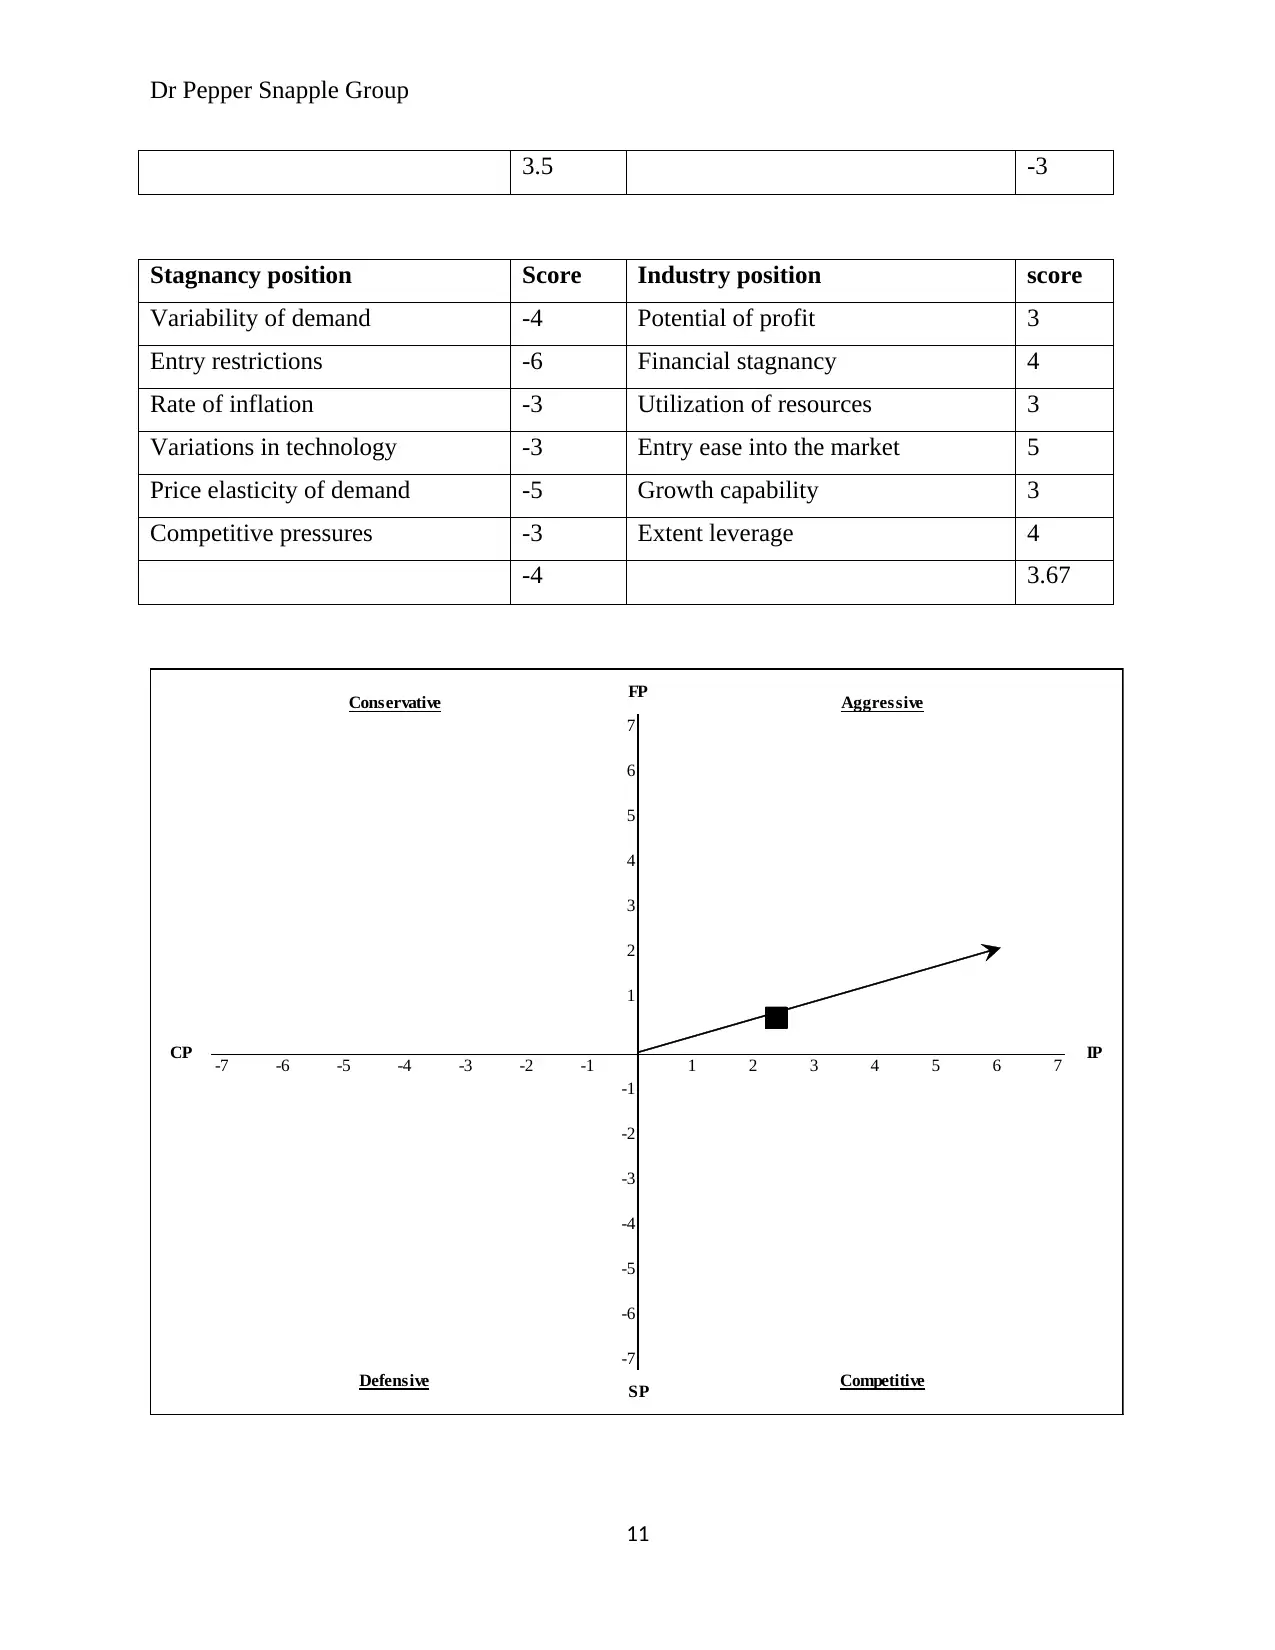
3.5 -3
Stagnancy position Score Industry position score
Variability of demand -4 Potential of profit 3
Entry restrictions -6 Financial stagnancy 4
Rate of inflation -3 Utilization of resources 3
Variations in technology -3 Entry ease into the market 5
Price elasticity of demand -5 Growth capability 3
Competitive pressures -3 Extent leverage 4
-4 3.67
7
6
5
4
3
2
1
-7 -6 -5 -4 -3 -2 -1 1 2 3 4 5 6 7
-1
-2
-3
-4
-5
-6
-7
IPCP
Defensive
AggressiveConservative FP
Competitive
SP
11
Dr Pepper Snapple Group
xi. Quantitative strategic plan matrix (QSPM)
Opportunities Weigh
t
AS TAS AS TA
S
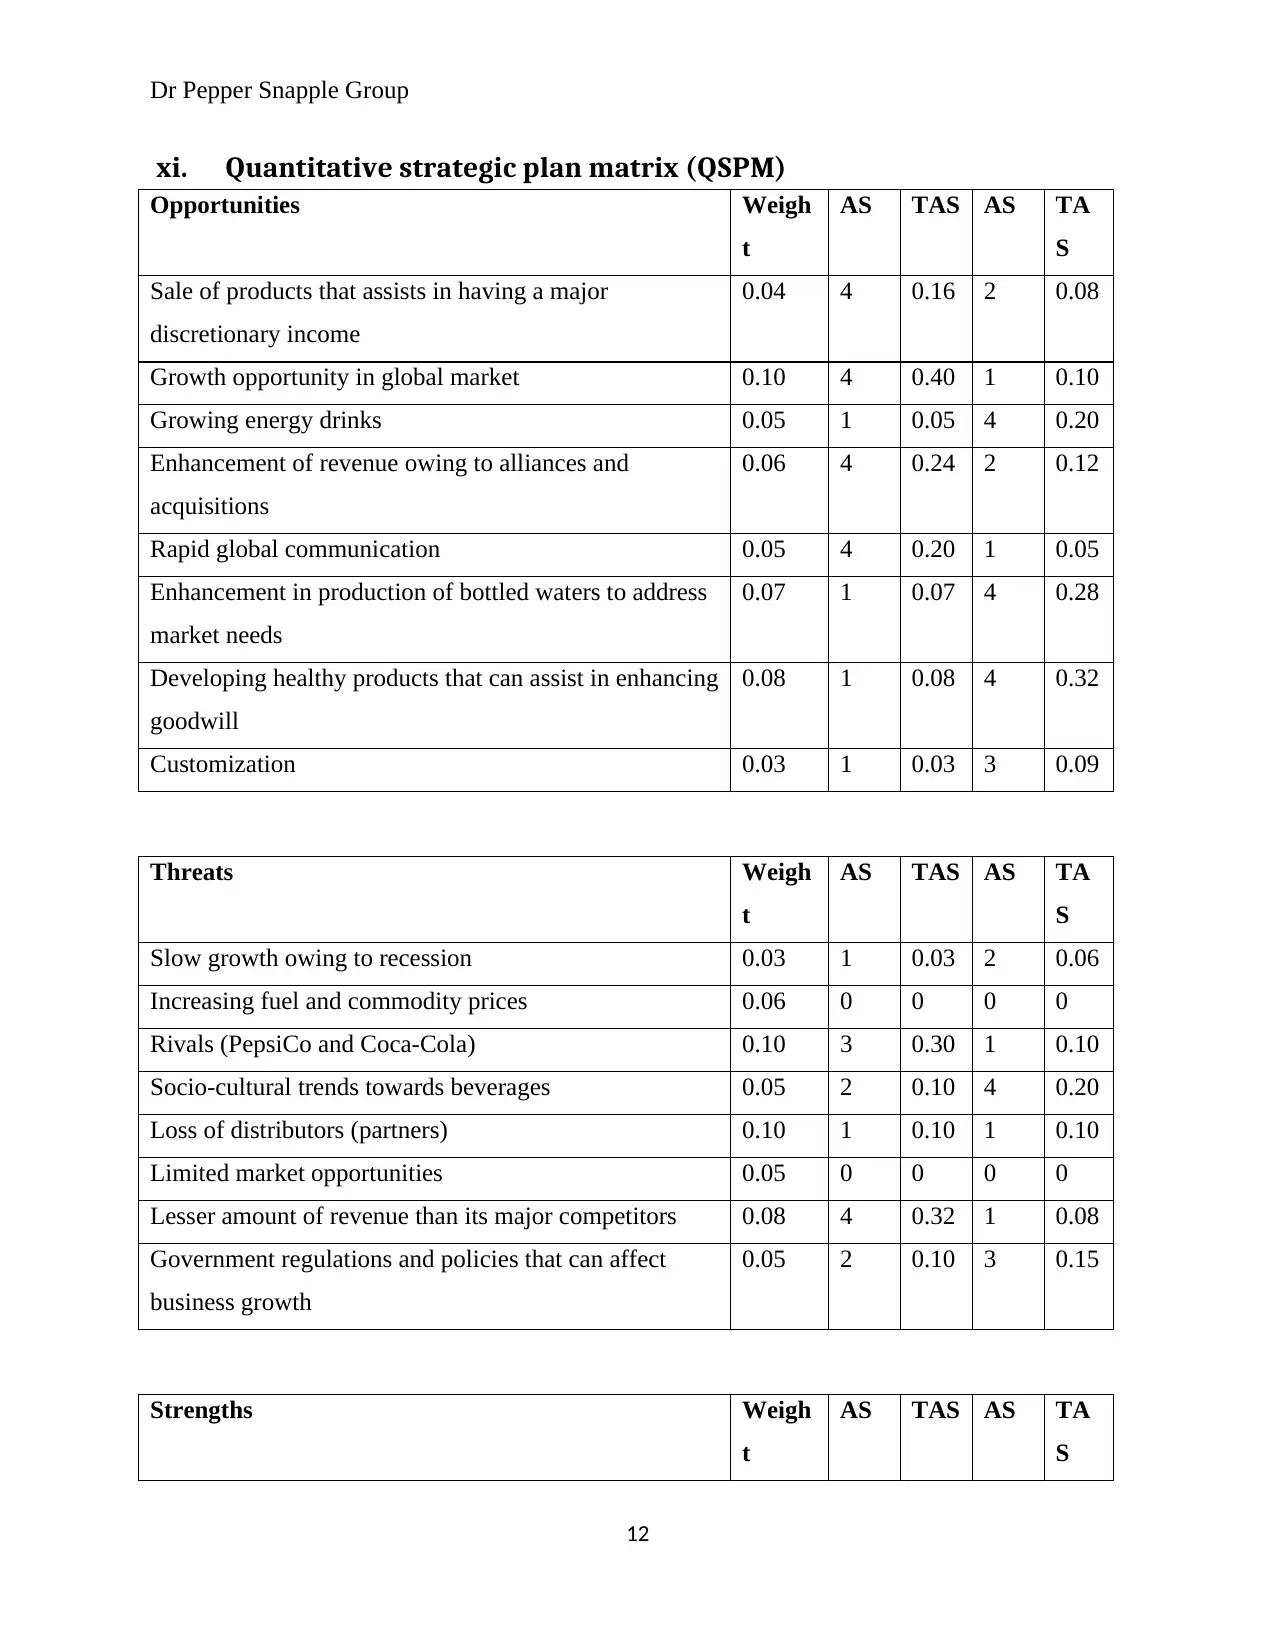
Sale of products that assists in having a major
discretionary income
0.04 4 0.16 2 0.08
Growth opportunity in global market 0.10 4 0.40 1 0.10
Growing energy drinks 0.05 1 0.05 4 0.20
Enhancement of revenue owing to alliances and
acquisitions
0.06 4 0.24 2 0.12
Rapid global communication 0.05 4 0.20 1 0.05
Enhancement in production of bottled waters to address
market needs
0.07 1 0.07 4 0.28
Developing healthy products that can assist in enhancing
goodwill
0.08 1 0.08 4 0.32
Customization 0.03 1 0.03 3 0.09
Threats Weigh
t
AS TAS AS TA
S
Slow growth owing to recession 0.03 1 0.03 2 0.06
Increasing fuel and commodity prices 0.06 0 0 0 0
Rivals (PepsiCo and Coca-Cola) 0.10 3 0.30 1 0.10
Socio-cultural trends towards beverages 0.05 2 0.10 4 0.20
Loss of distributors (partners) 0.10 1 0.10 1 0.10
Limited market opportunities 0.05 0 0 0 0
Lesser amount of revenue than its major competitors 0.08 4 0.32 1 0.08
Government regulations and policies that can affect
business growth
0.05 2 0.10 3 0.15
Strengths Weigh
t
AS TAS AS TA
S
12
xi. Quantitative strategic plan matrix (QSPM)
Opportunities Weigh
t
AS TAS AS TA
S
Sale of products that assists in having a major
discretionary income
0.04 4 0.16 2 0.08
Growth opportunity in global market 0.10 4 0.40 1 0.10
Growing energy drinks 0.05 1 0.05 4 0.20
Enhancement of revenue owing to alliances and
acquisitions
0.06 4 0.24 2 0.12
Rapid global communication 0.05 4 0.20 1 0.05
Enhancement in production of bottled waters to address
market needs
0.07 1 0.07 4 0.28
Developing healthy products that can assist in enhancing
goodwill
0.08 1 0.08 4 0.32
Customization 0.03 1 0.03 3 0.09
Threats Weigh
t
AS TAS AS TA
S
Slow growth owing to recession 0.03 1 0.03 2 0.06
Increasing fuel and commodity prices 0.06 0 0 0 0
Rivals (PepsiCo and Coca-Cola) 0.10 3 0.30 1 0.10
Socio-cultural trends towards beverages 0.05 2 0.10 4 0.20
Loss of distributors (partners) 0.10 1 0.10 1 0.10
Limited market opportunities 0.05 0 0 0 0
Lesser amount of revenue than its major competitors 0.08 4 0.32 1 0.08
Government regulations and policies that can affect
business growth
0.05 2 0.10 3 0.15
Strengths Weigh
t
AS TAS AS TA
S
12
⊘ This is a preview!⊘
Do you want full access?
Subscribe today to unlock all pages.
Trusted by 1+ million students worldwide
1 out of 16
Related Documents


Your All-in-One AI-Powered Toolkit for Academic Success.
+13062052269
info@desklib.com
Available 24*7 on WhatsApp / Email
![[object Object]](/_next/static/media/star-bottom.7253800d.svg)
Unlock your academic potential
Copyright © 2020–2026 A2Z Services. All Rights Reserved. Developed and managed by ZUCOL.