Business Information System Excel Assignment - 2018, Torrens Uni

Verified

Added on  2022/10/11

|8
|787
|10
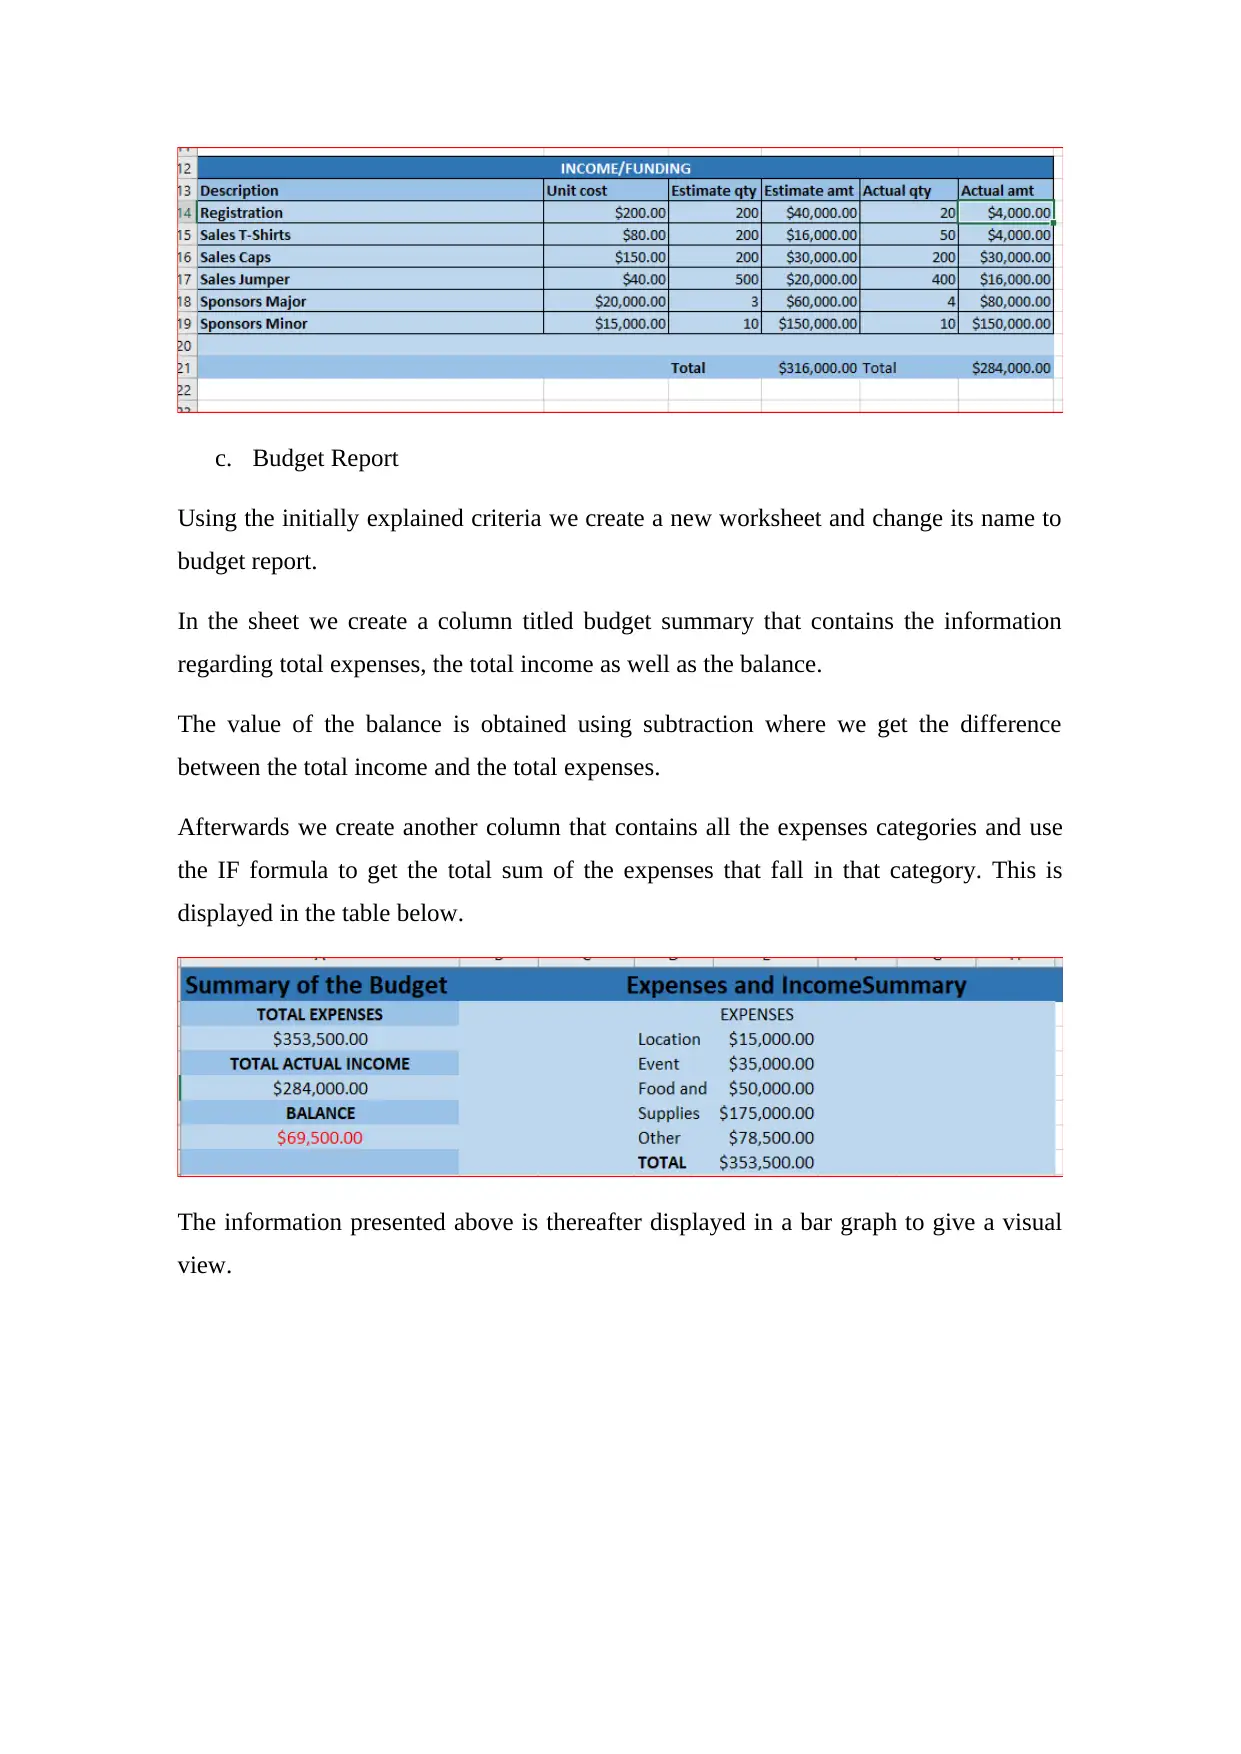
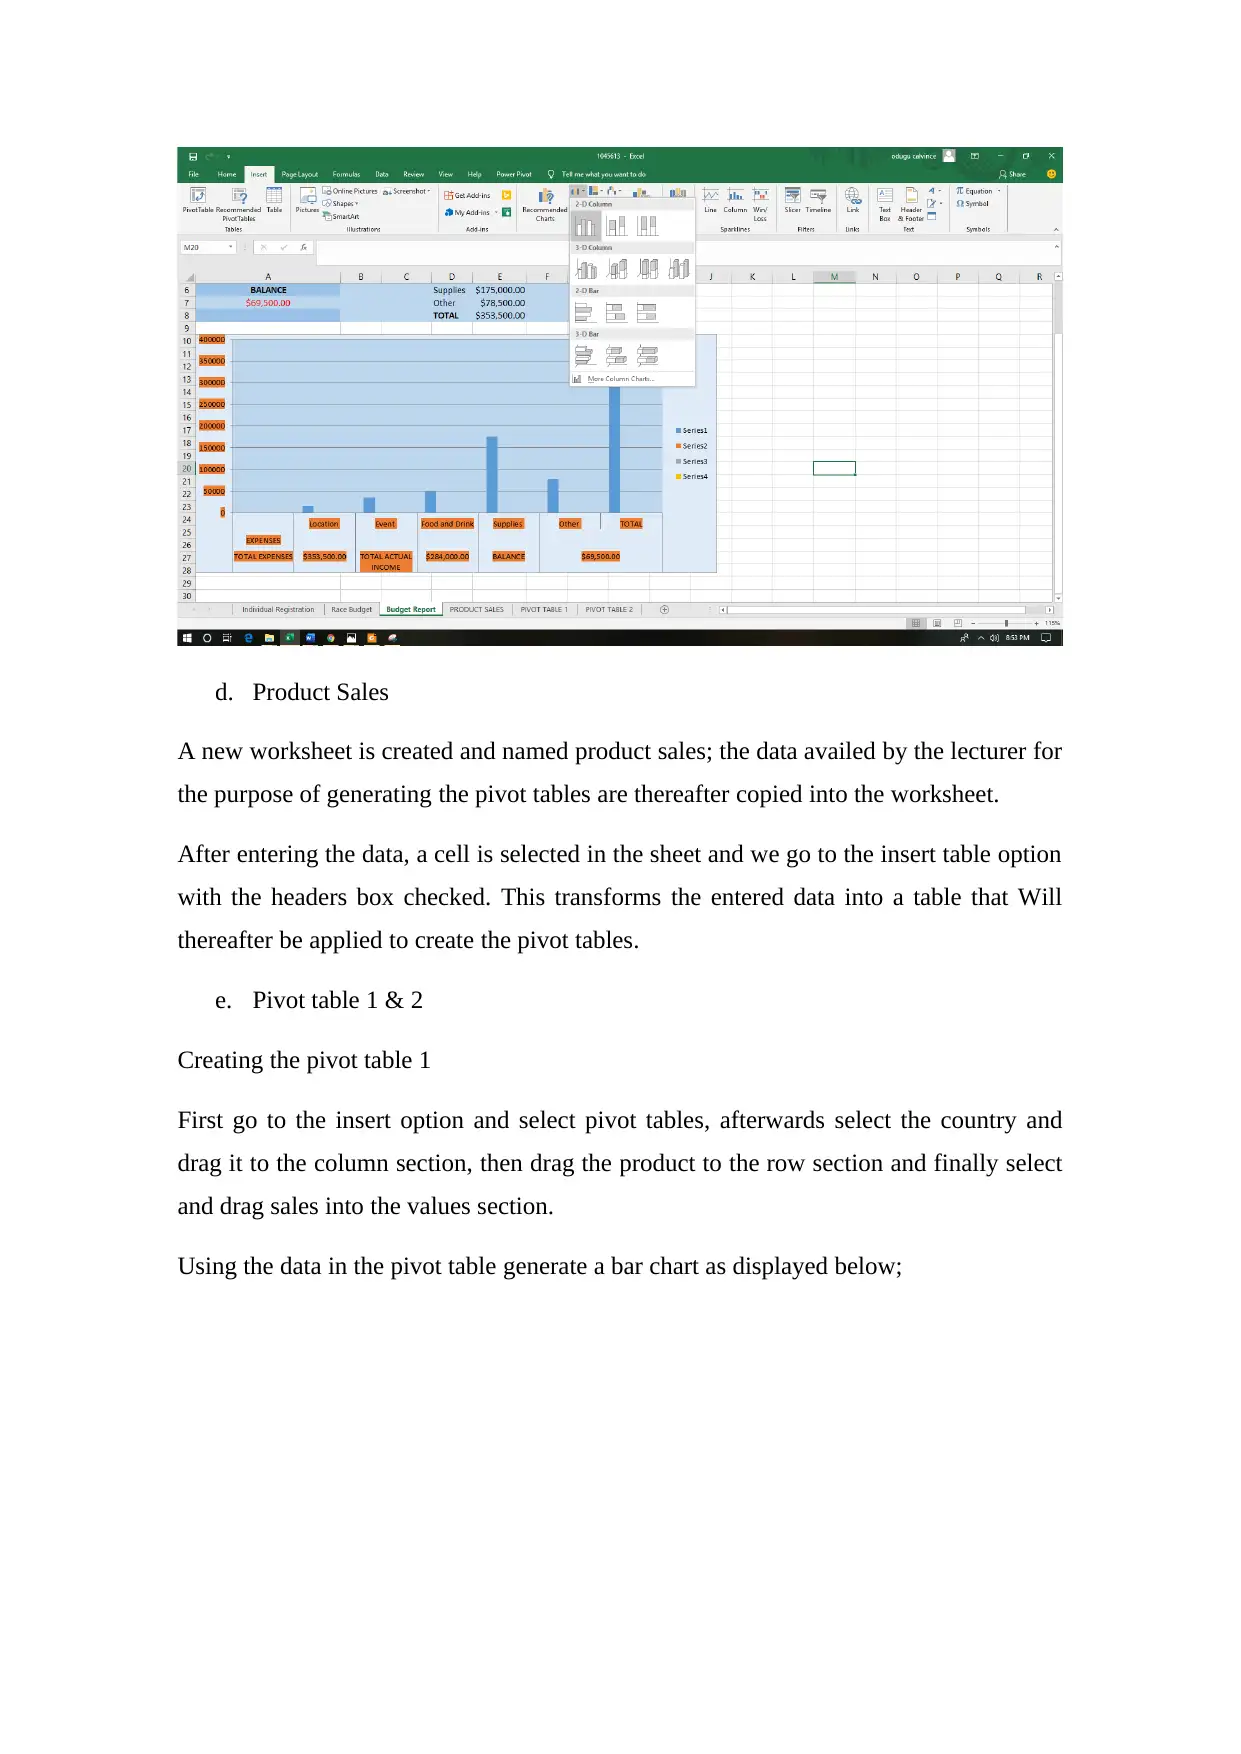
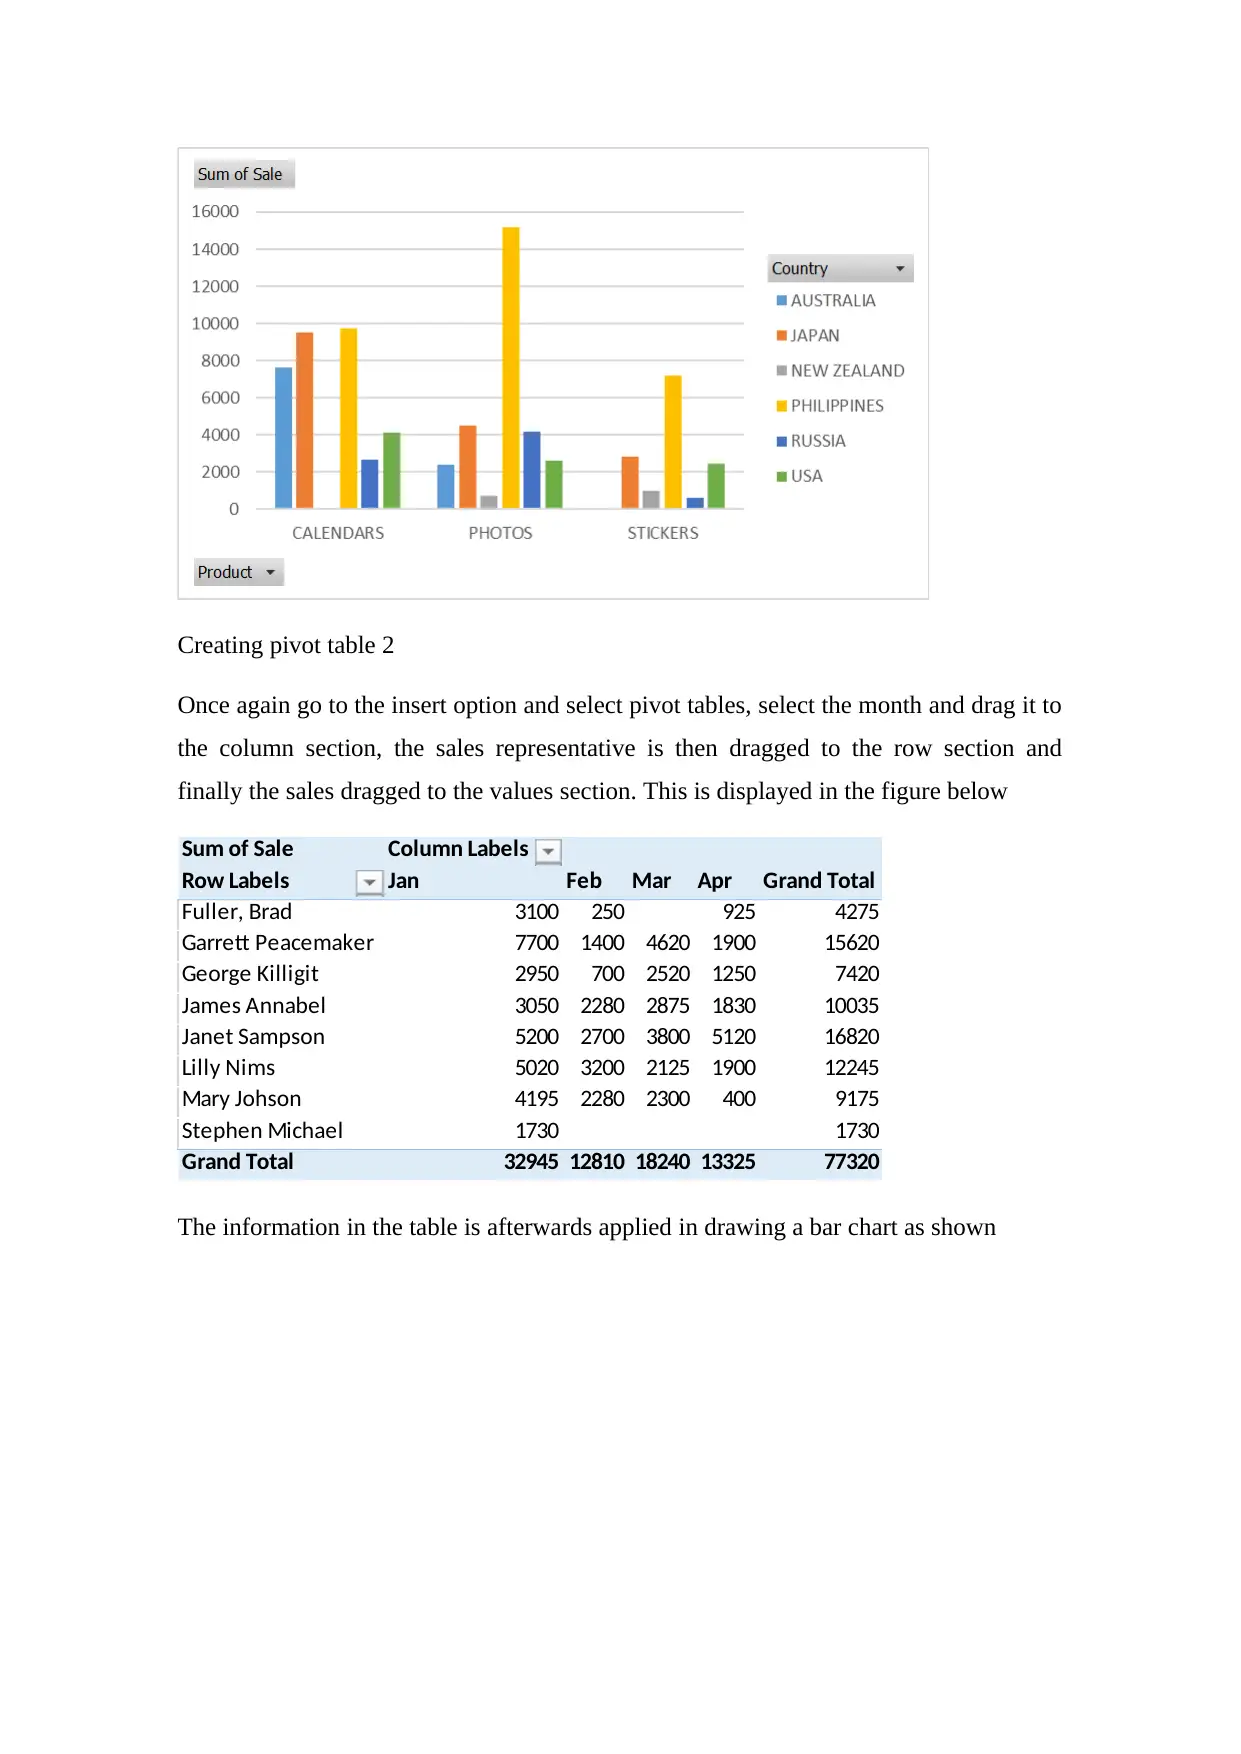
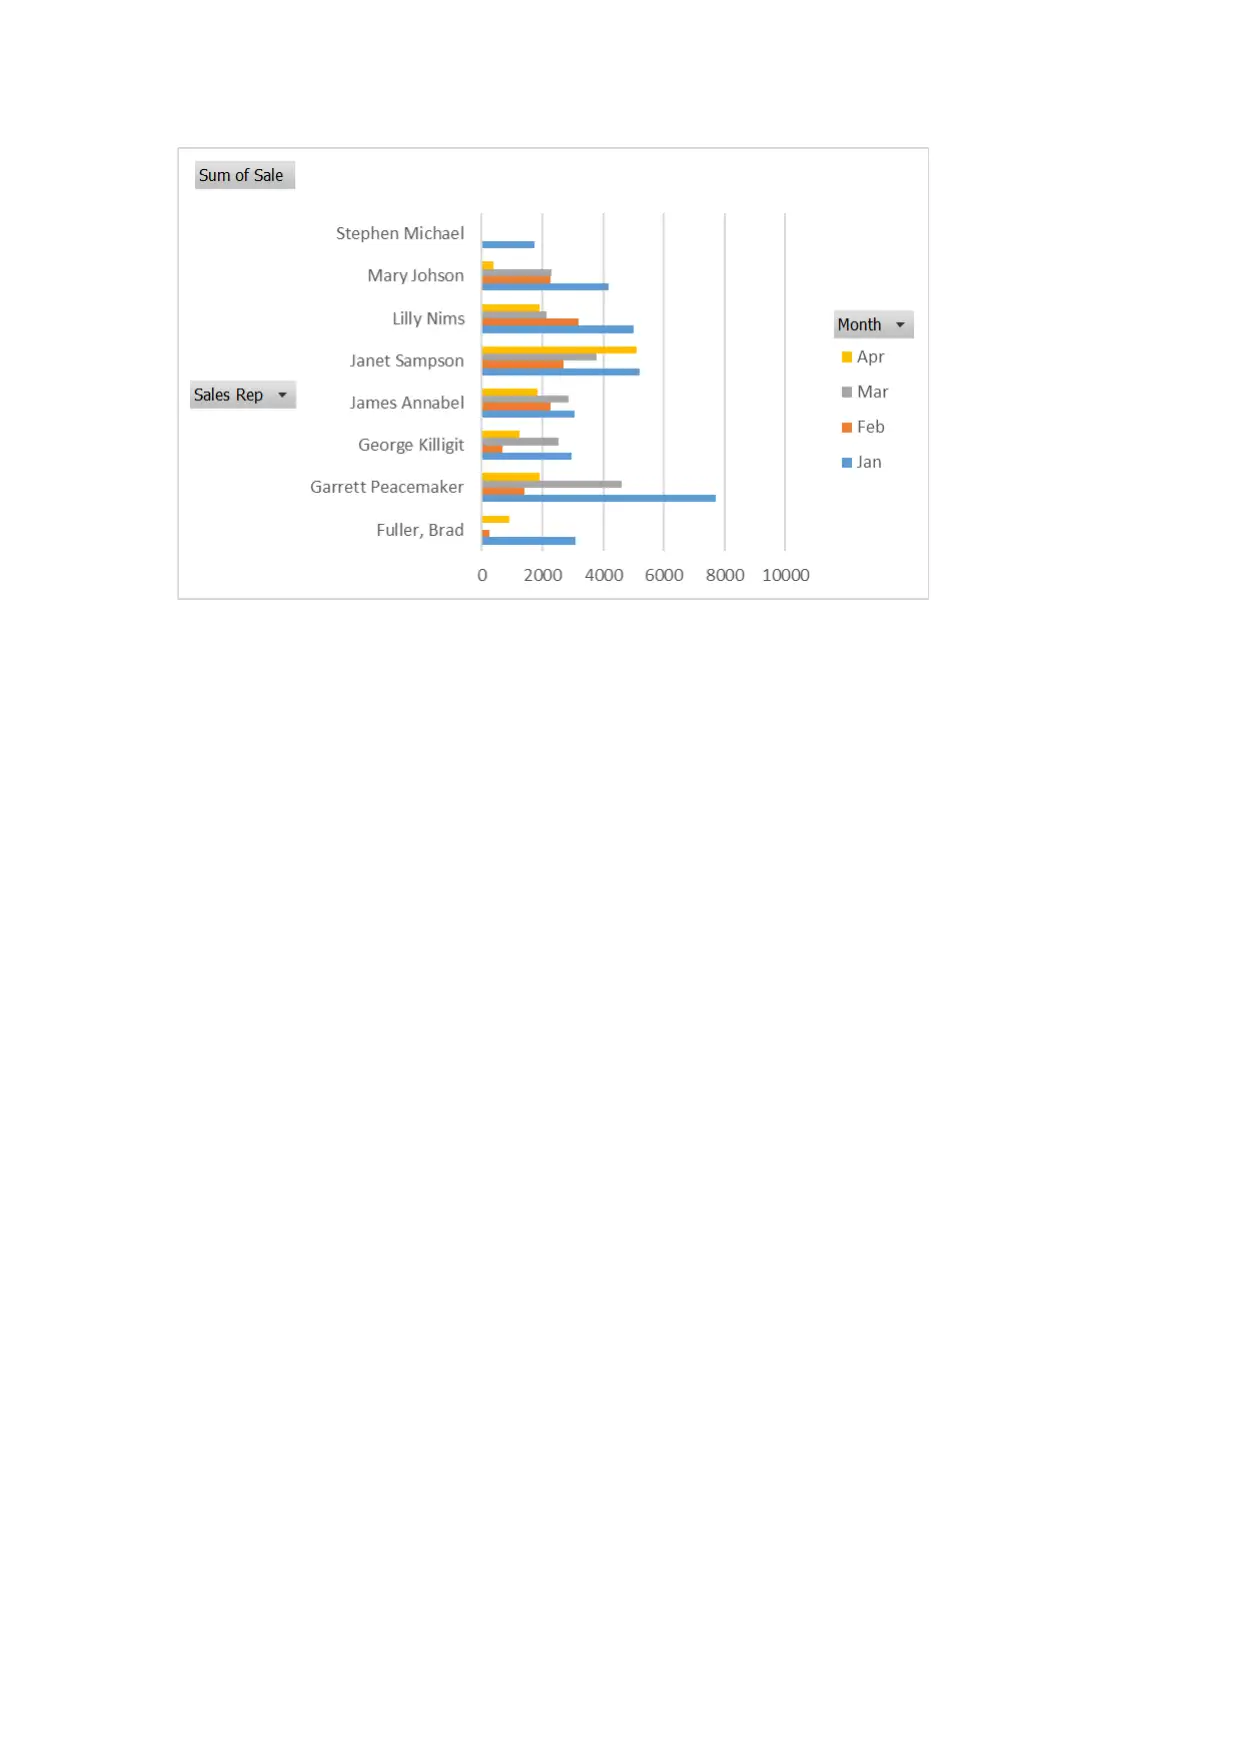
Practical Assignment
AI Summary
This Excel assignment focuses on applying Excel skills to analyze business data. The assignment covers several key areas, including creating an individual registration database using data validation to ensure data integrity. It also involves constructing a race budget worksheet utilizing IF and SUM formulas for expense and income calculations, followed by generating a budget report summarizing financial data. Furthermore, the assignment delves into product sales analysis, involving the creation of pivot tables and corresponding bar charts to visualize sales data by country, product, month and sales representative. The solution demonstrates the use of various Excel features, such as formatting, data validation, and chart creation, to effectively manage and interpret business-related information. The assignment is based on a case study of the Formula 1 Grand Prix in Australia, providing a practical context for the application of Excel skills.
Document Page
BUSINESS INFORMATION SYSTEM
EXCEL ASSIGNMENT
LAURA CATALINA POVEDA VARGAS
00161328T
TORRENS UNIVERSITY OF AUSTRALIA
2018-1
The objective of this report is to highlight the steps followed when creating excel data
base and practice the excel skills that have been gained in the course of the study.
In the first calculation worksheet named individual registration, the data used is
obtained from the formula 1 website and the information is based on the case study of
the Formula 1 Grand Prix in Australia.
The picture below provides details of the information that was needed so as to prepare
the registration database for the clients.
tabler-icon-diamond-filled.svg

Paraphrase This Document

Need a fresh take? Get an instant paraphrase of this document with our AI Paraphraser
Document Page
The steps highlighted below were followed when creating the individual registration
data sheet in the excel workbook.
a. Individual registration
The first step was to enter all the details that were needed so as to create the database for
a reservation system, these include basic information. The worksheet name is thereafter
changed and written as individual registration
The neext step is to align the title of the database on a row on top of the created table
Document Page
In the columns ticket type, cost of ticket and the number of tickets bought, data
validation was undertaken. This validation gives a restriction of the type of data that can
be accepted by the cells under these columns. This feature of Excel prevents the user of
the database from entering incorrect information in the Excel sheet.
Under the cell format option, the features available allows the user to perform a number
of functions examples being
Aligning the text
Changing the font size
Setting borders
Adding background colour as well as changing the colour of the texts.
Under the post code and telephone columns, it can be established that the
information presented in the cells will be numbers.
The cost column and the amount paid column contains currency. These can be
formatted to be in Australian dollar and necessary decimal places specified.
Document Page
b. Race Budget
The next worksheet in the excel file is titled Race budget and it was created using the
procedure mentioned below.
First, we click on the addition sign below the excel file to create a new worksheet then
change its name to Race Budget.
The sample data is thereafter used to create two tables one for expenses and the other
for income/funding.
Th expenses table applies the IF formula and give a result which is a multiplication of
the amount and quantity columns. For instance
The income table applies the sum formula to calculate the total current expenses as
presented in the table below.
tabler-icon-diamond-filled.svg

Paraphrase This Document

Need a fresh take? Get an instant paraphrase of this document with our AI Paraphraser
Document Page
c. Budget Report
Using the initially explained criteria we create a new worksheet and change its name to
budget report.
In the sheet we create a column titled budget summary that contains the information
regarding total expenses, the total income as well as the balance.
The value of the balance is obtained using subtraction where we get the difference
between the total income and the total expenses.
Afterwards we create another column that contains all the expenses categories and use
the IF formula to get the total sum of the expenses that fall in that category. This is
displayed in the table below.
The information presented above is thereafter displayed in a bar graph to give a visual
view.
Document Page
d. Product Sales
A new worksheet is created and named product sales; the data availed by the lecturer for
the purpose of generating the pivot tables are thereafter copied into the worksheet.
After entering the data, a cell is selected in the sheet and we go to the insert table option
with the headers box checked. This transforms the entered data into a table that Will
thereafter be applied to create the pivot tables.
e. Pivot table 1 & 2
Creating the pivot table 1
First go to the insert option and select pivot tables, afterwards select the country and
drag it to the column section, then drag the product to the row section and finally select
and drag sales into the values section.
Using the data in the pivot table generate a bar chart as displayed below;
Document Page
Creating pivot table 2
Once again go to the insert option and select pivot tables, select the month and drag it to
the column section, the sales representative is then dragged to the row section and
finally the sales dragged to the values section. This is displayed in the figure below
Sum of Sale Column Labels
Row Labels Jan Feb Mar Apr Grand Total
Fuller, Brad 3100 250 925 4275
Garrett Peacemaker 7700 1400 4620 1900 15620
George Killigit 2950 700 2520 1250 7420
James Annabel 3050 2280 2875 1830 10035
Janet Sampson 5200 2700 3800 5120 16820
Lilly Nims 5020 3200 2125 1900 12245
Mary Johson 4195 2280 2300 400 9175
Stephen Michael 1730 1730
Grand Total 32945 12810 18240 13325 77320
The information in the table is afterwards applied in drawing a bar chart as shown
tabler-icon-diamond-filled.svg

Paraphrase This Document

Need a fresh take? Get an instant paraphrase of this document with our AI Paraphraser
Document Page
chevron_up_icon
1 out of 8
circle_padding
hide_on_mobile
zoom_out_icon
[object Object]