Business Decision Making Report: London Restaurant Expansion Analysis
VerifiedAdded on 2019/12/03
|23
|3822
|92
Report
AI Summary
This report details the business decision-making process for a restaurant chain planning to open a second location in London. It begins with a plan for primary and secondary data collection, utilizing survey methodology and a sampling frame. The report includes a questionnaire and summarizes the collected data, analyzing it using representative values and measures of dispersion. Quartile, percentile, and correlation techniques are applied to draw conclusions and recommendations. The second task involves creating graphs and charts, along with trend lines for forecasting sales and profits. The analysis uses financial tools like Net Present Value (NPV). The report provides a business presentation and a formal business report, utilizing appropriate information processing tools to analyze the information and financial tools to make a decision about the expansion plan. The conclusion recommends increasing sales revenue through marketing and promotional activities to drive profitability.

BUSINESS
DECISION
MAKING
DECISION
MAKING
Paraphrase This Document
Need a fresh take? Get an instant paraphrase of this document with our AI Paraphraser
TABLE OF CONTENTS
INTRODUCTION...........................................................................................................................1
TASK 1............................................................................................................................................1
Plan for primary and secondary data collection with survey methodology and sampling frame
used..............................................................................................................................................1
Questionnaire...............................................................................................................................2
Collection of data and summering of information by using representative values.....................4
Analyzing the data using measures of dispersion........................................................................7
Quartile, percentile and correlation technique.............................................................................8
Suitable calculations to draw realistic conclusion and valid recommendations..........................9
TASK 2..........................................................................................................................................10
Graphs and charts......................................................................................................................10
Trend Lines for forecasting.......................................................................................................11
Business Presentation................................................................................................................12
Formal business report...............................................................................................................12
Appropriate information processing tools to analyse the information......................................12
Plan for the project.....................................................................................................................13
Financial tools............................................................................................................................14
CONCLUSION..............................................................................................................................16
REFERENCES..............................................................................................................................17
LIST OF TABLES
Table 1: Sales and Profit..................................................................................................................7
Table 2: Descriptive Statistics of sales figures................................................................................7
Table 3: Descriptive Statistics of Profit figures...............................................................................7
Table 4: Quartile..............................................................................................................................8
Table 5: Percentile...........................................................................................................................8
Table 6: Correlation Coefficient......................................................................................................8
Table 7: Net Present value method................................................................................................15
⊘ This is a preview!⊘
Do you want full access?
Subscribe today to unlock all pages.
Trusted by 1+ million students worldwide
INTRODUCTION
For making an optimal decision in the business organization there is need to application
of appropriate tools and techniques (Prieto, 2006). In the present report the purpose of effective
information for decision making in organization is detailed by using different techniques.
Restaurant chain is planning to open its second restaurant in London and for making an optimal
decision towards business expansion, range of analysis techniques were applied. In first task of
the study, data was collected from the primary and secondary sources and on the basis of which
techniques were applied to analyze the data for business purpose. Further in next part
information is produced fro decision purpose and also software generated information is used for
organizational decision making.
TASK 1
Plan for primary and secondary data collection with survey methodology and sampling frame
used
To open a second restaurant in London, Board of Directors have to collect the data from
different sources and on the basis of which they can make their decision whether it will be their
viable move or not.
Primary Data collection method: Accessing of information directly from primary sources
will help the company to know current information about the needs and wants of London
restaurant market (Pennink and Jonker, 2010). Primary data will be collected from the
customers of restaurants of London. There are different techniques of collecting primary
data such as survey, interview, observation etc. In context to primary research, survey
methodology will be used (Khotri, 2008).
Secondary method of data collection: Secondary data will be collected from different
sources such as research reports, internet, newspapers, articles etc. (Manion Cohen, and
Morrison, 2007). Collection of secondary data will helps to examine the information of
restaurant market of London.
Survey methodology and sampling frame for collection of primary data:
Survey Methodology: Data will be collected from the customers of restaurants and for this
questionnaire technique of survey methodology will be used. It is the type of primary
1
Paraphrase This Document
Need a fresh take? Get an instant paraphrase of this document with our AI Paraphraser
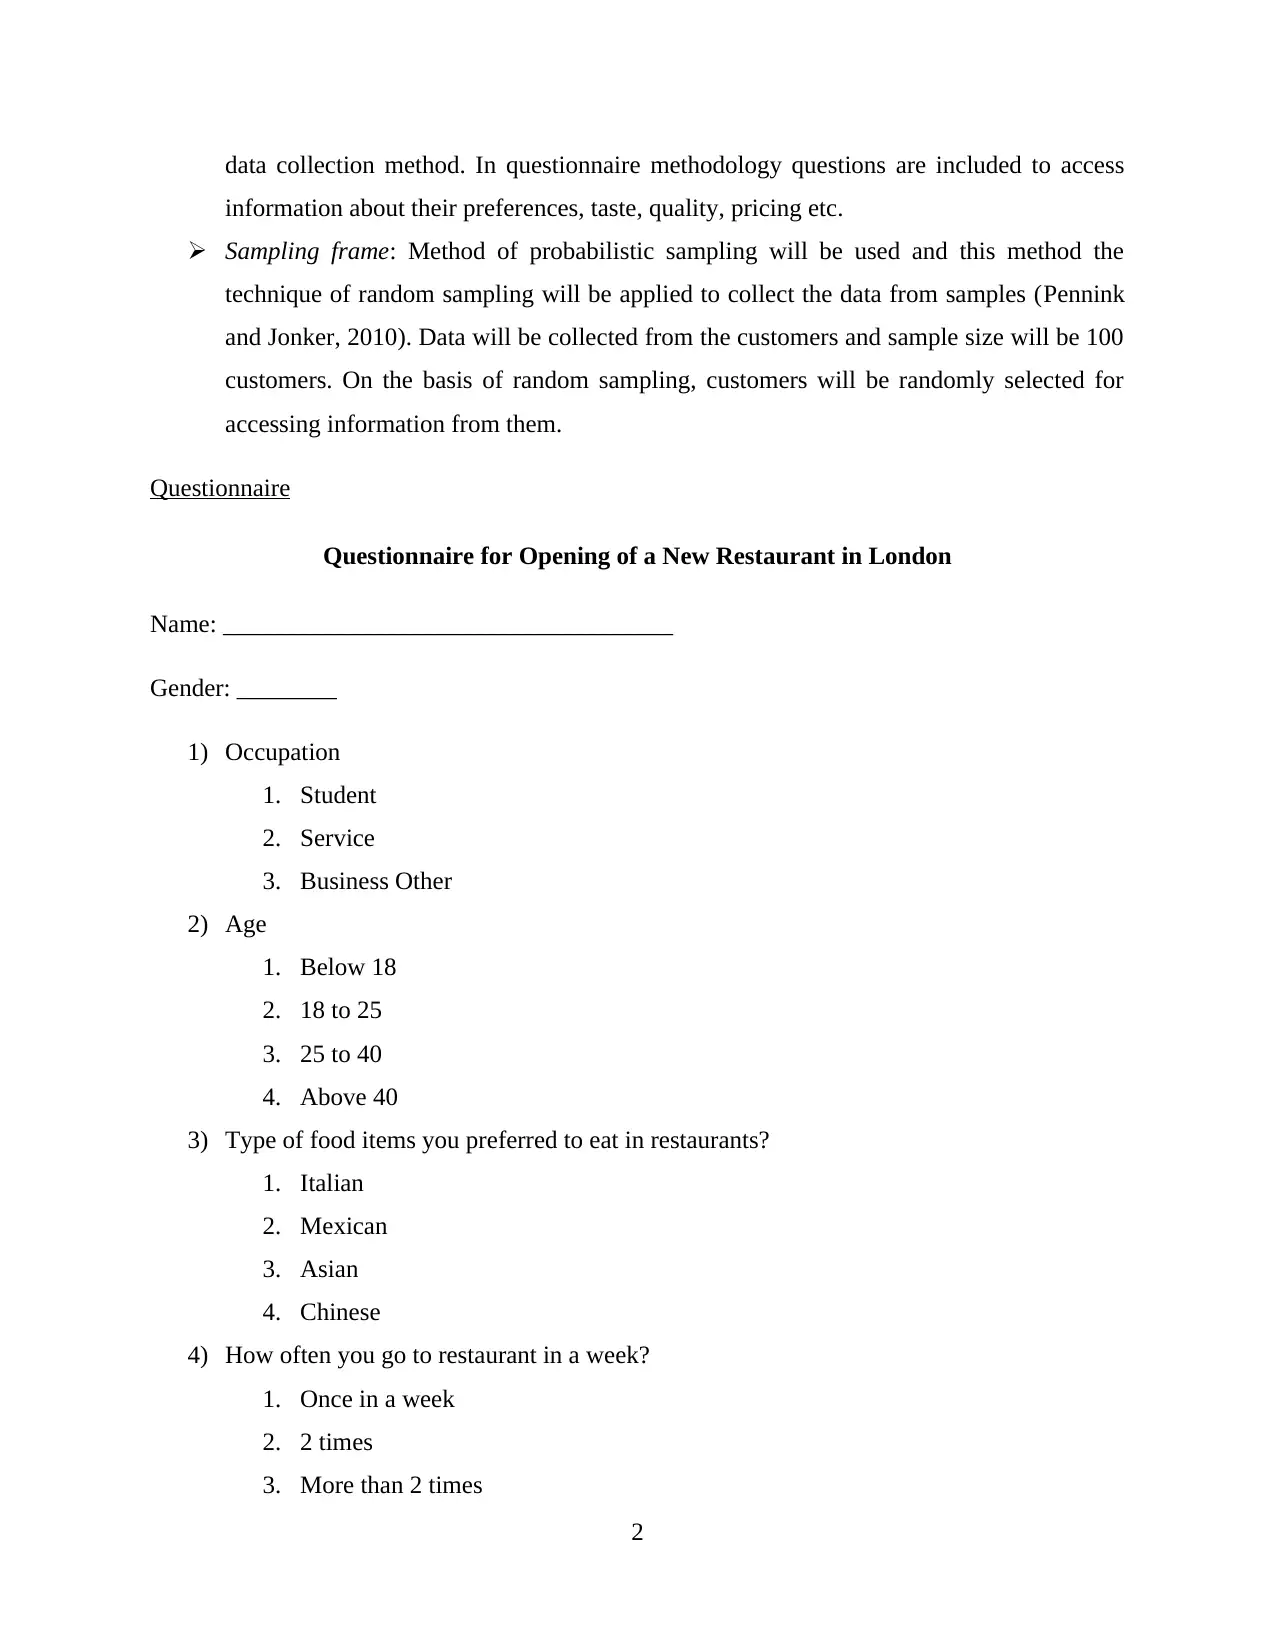
data collection method. In questionnaire methodology questions are included to access
information about their preferences, taste, quality, pricing etc.
Sampling frame: Method of probabilistic sampling will be used and this method the
technique of random sampling will be applied to collect the data from samples (Pennink
and Jonker, 2010). Data will be collected from the customers and sample size will be 100
customers. On the basis of random sampling, customers will be randomly selected for
accessing information from them.
Questionnaire
Questionnaire for Opening of a New Restaurant in London
Name: ____________________________________
Gender: ________
1) Occupation
1. Student
2. Service
3. Business Other
2) Age
1. Below 18
2. 18 to 25
3. 25 to 40
4. Above 40
3) Type of food items you preferred to eat in restaurants?
1. Italian
2. Mexican
3. Asian
4. Chinese
4) How often you go to restaurant in a week?
1. Once in a week
2. 2 times
3. More than 2 times
2
5) Type of factors which persuade you to eat food in particular restaurant?
1. Taste and Quality
2. Choices
3. Service
4. Ambience
5. All of the above
6) Do you agree that restaurants in London are serving food as a good value for money?
1. Strongly Agree
2. Agree
3. Neutral
4. Strongly Disagree
5. Disagree
7) In terms of range of pricing which type of restaurant you mostly preferred?
1. Low pricing
2. Economical prices
3. Higher prices
8) Would you like to prefer restaurant which offers discounts and schemes for customers?
1. Yes
2. No
3. Can’t Say
9) Does food served in restaurants meet in accordance with their price value?
1. Strongly Agree
2. Agree
3. Neutral
4. Strongly Disagree
5. Disagree
10) Any suggestions which you want to give regarding opening of new restaurant in London?
________________________________________________________________________
________________________________________________________________________
3
⊘ This is a preview!⊘
Do you want full access?
Subscribe today to unlock all pages.
Trusted by 1+ million students worldwide
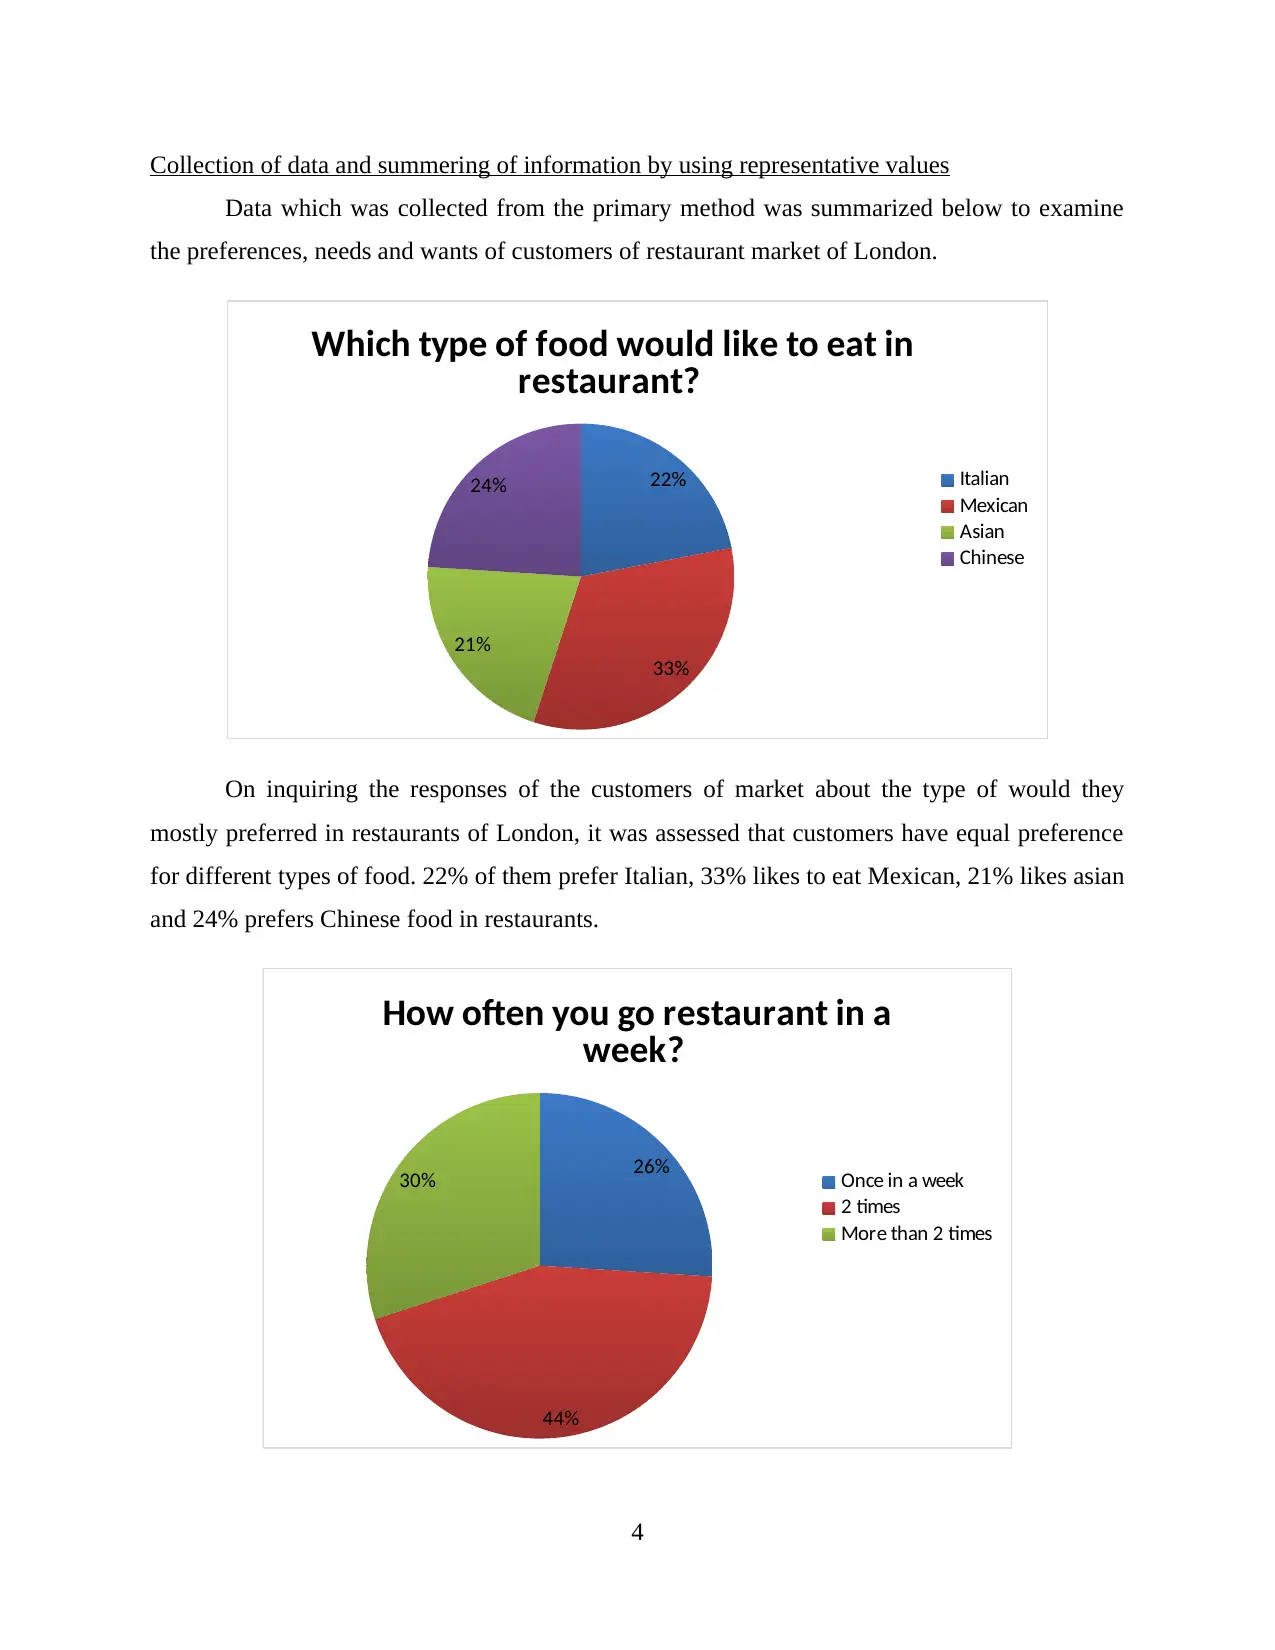
Collection of data and summering of information by using representative values
Data which was collected from the primary method was summarized below to examine
the preferences, needs and wants of customers of restaurant market of London.
22%
33%
21%
24%
Which type of food would like to eat in
restaurant?
Italian
Mexican
Asian
Chinese
On inquiring the responses of the customers of market about the type of would they
mostly preferred in restaurants of London, it was assessed that customers have equal preference
for different types of food. 22% of them prefer Italian, 33% likes to eat Mexican, 21% likes asian
and 24% prefers Chinese food in restaurants.
26%
44%
30%
How often you go restaurant in a
week?
Once in a week
2 times
More than 2 times
4
Paraphrase This Document
Need a fresh take? Get an instant paraphrase of this document with our AI Paraphraser
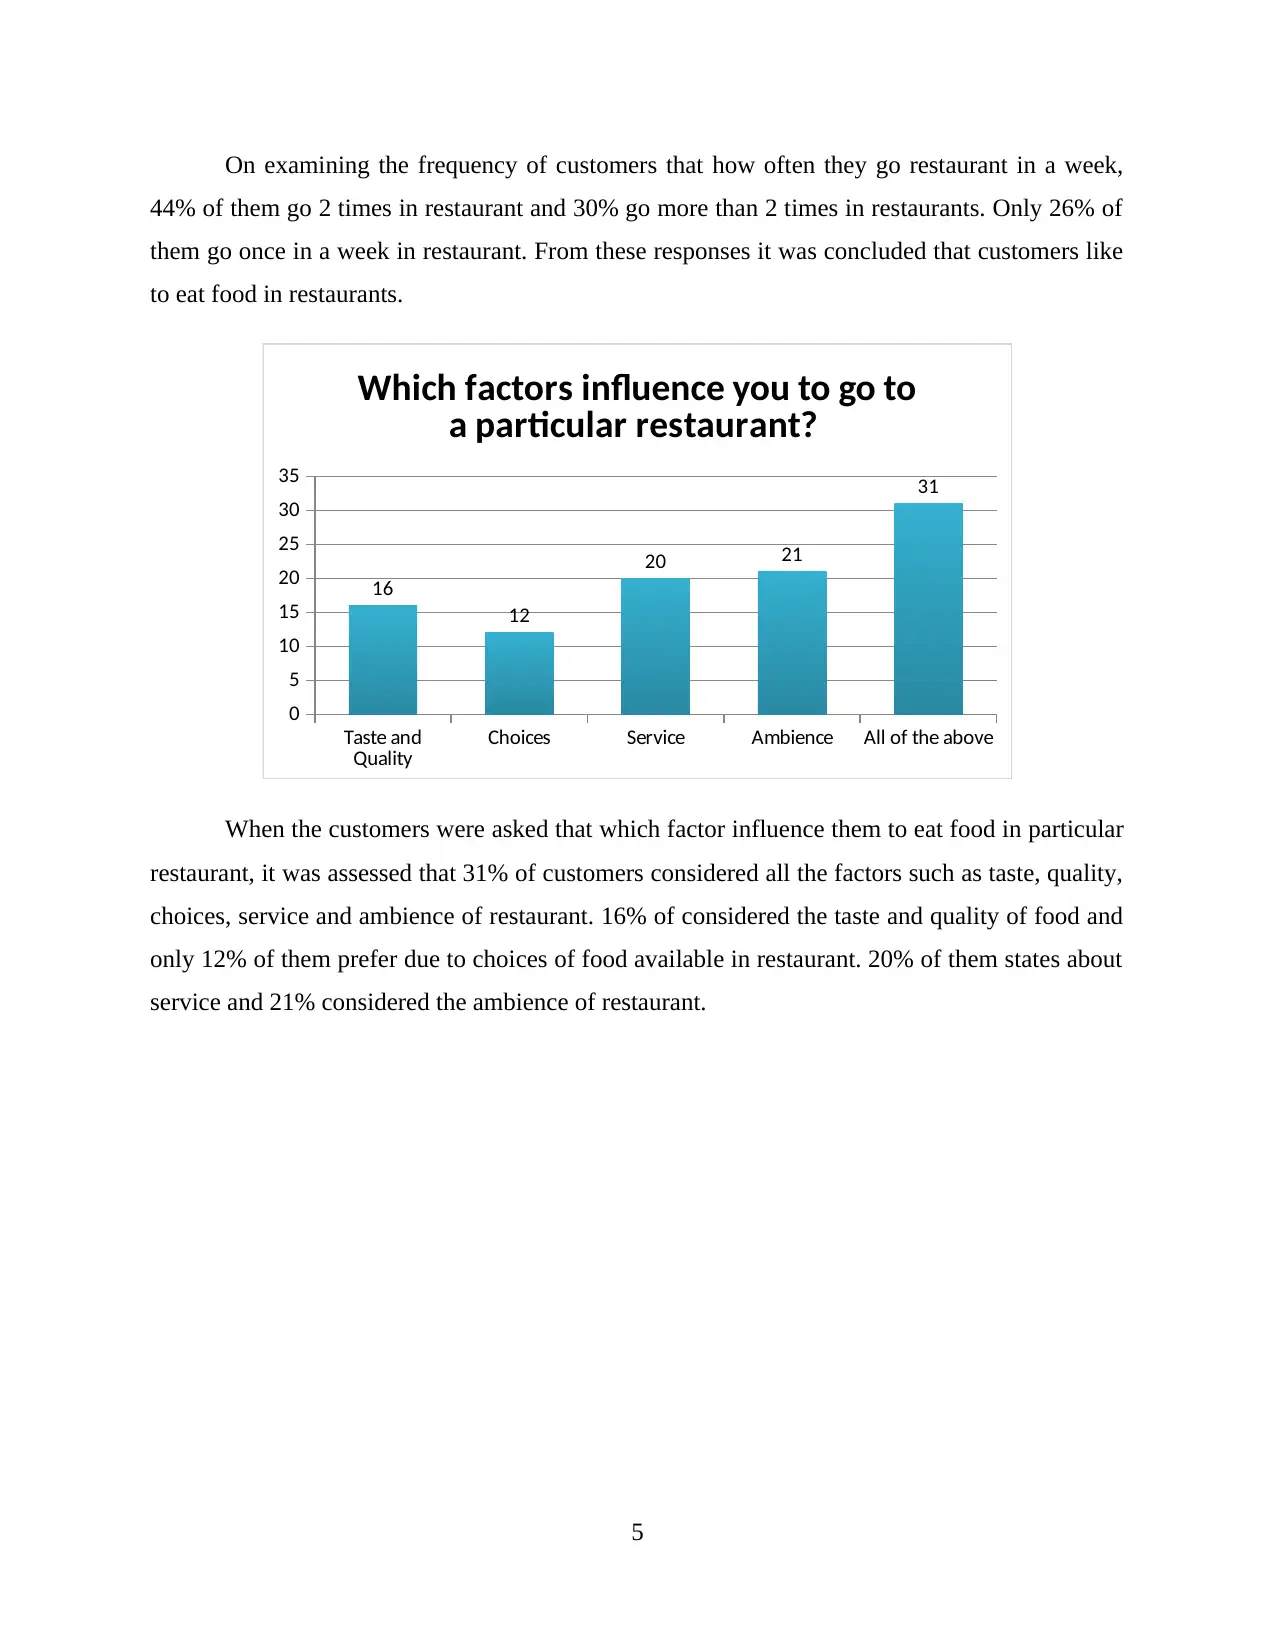
On examining the frequency of customers that how often they go restaurant in a week,
44% of them go 2 times in restaurant and 30% go more than 2 times in restaurants. Only 26% of
them go once in a week in restaurant. From these responses it was concluded that customers like
to eat food in restaurants.
Taste and
Quality Choices Service Ambience All of the above
0
5
10
15
20
25
30
35
16
12
20 21
31
Which factors influence you to go to
a particular restaurant?
When the customers were asked that which factor influence them to eat food in particular
restaurant, it was assessed that 31% of customers considered all the factors such as taste, quality,
choices, service and ambience of restaurant. 16% of considered the taste and quality of food and
only 12% of them prefer due to choices of food available in restaurant. 20% of them states about
service and 21% considered the ambience of restaurant.
5
Yes No Can’t Say
0
10
20
30
40
50
60
70 65
11
24
Would you like to prefer restaurant
which offers discounts and schemes
for customers?
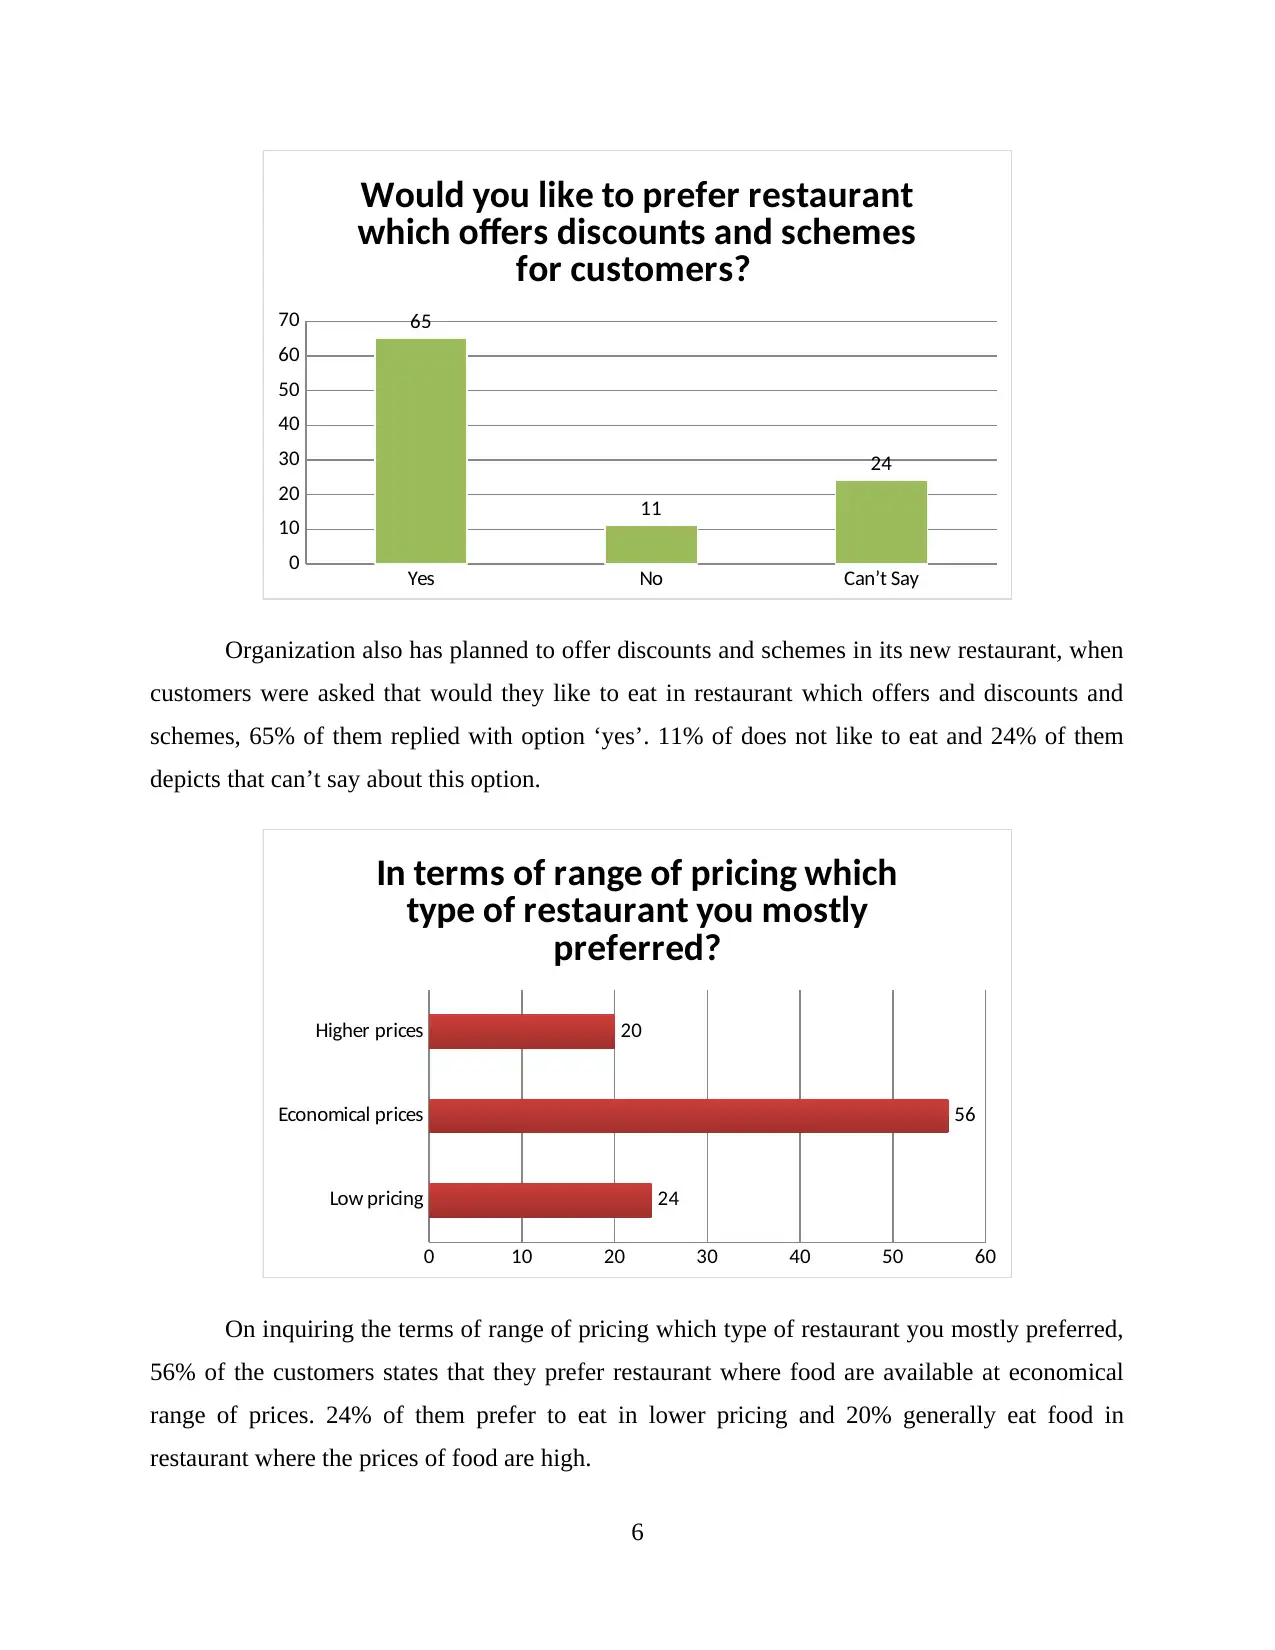
Organization also has planned to offer discounts and schemes in its new restaurant, when
customers were asked that would they like to eat in restaurant which offers and discounts and
schemes, 65% of them replied with option ‘yes’. 11% of does not like to eat and 24% of them
depicts that can’t say about this option.
Low pricing
Economical prices
Higher prices
0 10 20 30 40 50 60
24
56
20
In terms of range of pricing which
type of restaurant you mostly
preferred?
On inquiring the terms of range of pricing which type of restaurant you mostly preferred,
56% of the customers states that they prefer restaurant where food are available at economical
range of prices. 24% of them prefer to eat in lower pricing and 20% generally eat food in
restaurant where the prices of food are high.
6
0
10
20
30
40
50
60
70 65
11
24
Would you like to prefer restaurant
which offers discounts and schemes
for customers?
Organization also has planned to offer discounts and schemes in its new restaurant, when
customers were asked that would they like to eat in restaurant which offers and discounts and
schemes, 65% of them replied with option ‘yes’. 11% of does not like to eat and 24% of them
depicts that can’t say about this option.
Low pricing
Economical prices
Higher prices
0 10 20 30 40 50 60
24
56
20
In terms of range of pricing which
type of restaurant you mostly
preferred?
On inquiring the terms of range of pricing which type of restaurant you mostly preferred,
56% of the customers states that they prefer restaurant where food are available at economical
range of prices. 24% of them prefer to eat in lower pricing and 20% generally eat food in
restaurant where the prices of food are high.
6
⊘ This is a preview!⊘
Do you want full access?
Subscribe today to unlock all pages.
Trusted by 1+ million students worldwide
Analyzing the data using measures of dispersion
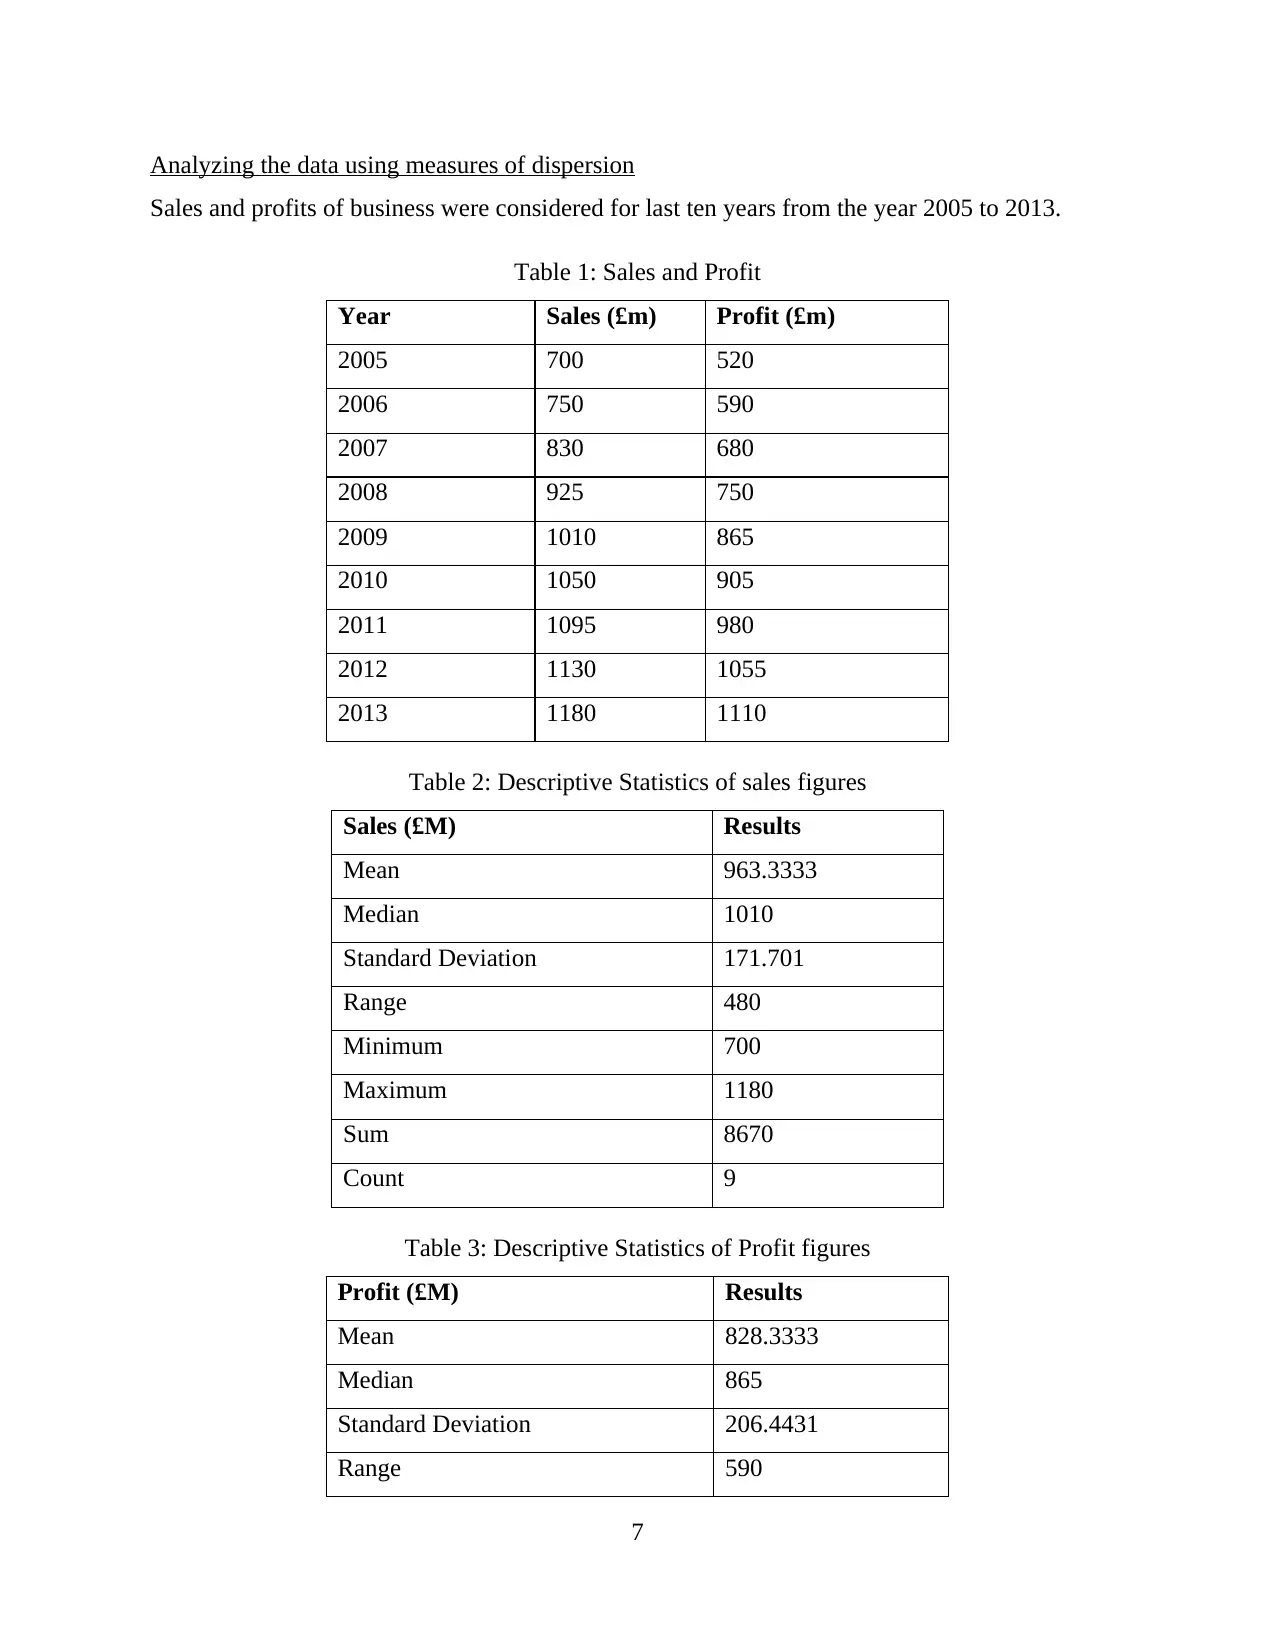
Sales and profits of business were considered for last ten years from the year 2005 to 2013.
Table 1: Sales and Profit
Year Sales (£m) Profit (£m)
2005 700 520
2006 750 590
2007 830 680
2008 925 750
2009 1010 865
2010 1050 905
2011 1095 980
2012 1130 1055
2013 1180 1110
Table 2: Descriptive Statistics of sales figures
Sales (£M) Results
Mean 963.3333
Median 1010
Standard Deviation 171.701
Range 480
Minimum 700
Maximum 1180
Sum 8670
Count 9
Table 3: Descriptive Statistics of Profit figures
Profit (£M) Results
Mean 828.3333
Median 865
Standard Deviation 206.4431
Range 590
7
Paraphrase This Document
Need a fresh take? Get an instant paraphrase of this document with our AI Paraphraser
Minimum 520
Maximum 1110
Sum 7455
Count 9
On analyzing the sales and profit data of business by using the descriptive statistics for
the period of last ten years, it was evaluated that mean which depicts about the average sales of
company from 2005 to 2013 was £963.33 million and profit was £828.33 million. Median of
sales was 1010 and of profit were 865. Likewise the value of standard deviation indicates about
the deviation of values from the average sales and profits of business (Woodside, 2010).
Standard deviation of sales 171.701 was lower in compare to standard deviation of profits 865.
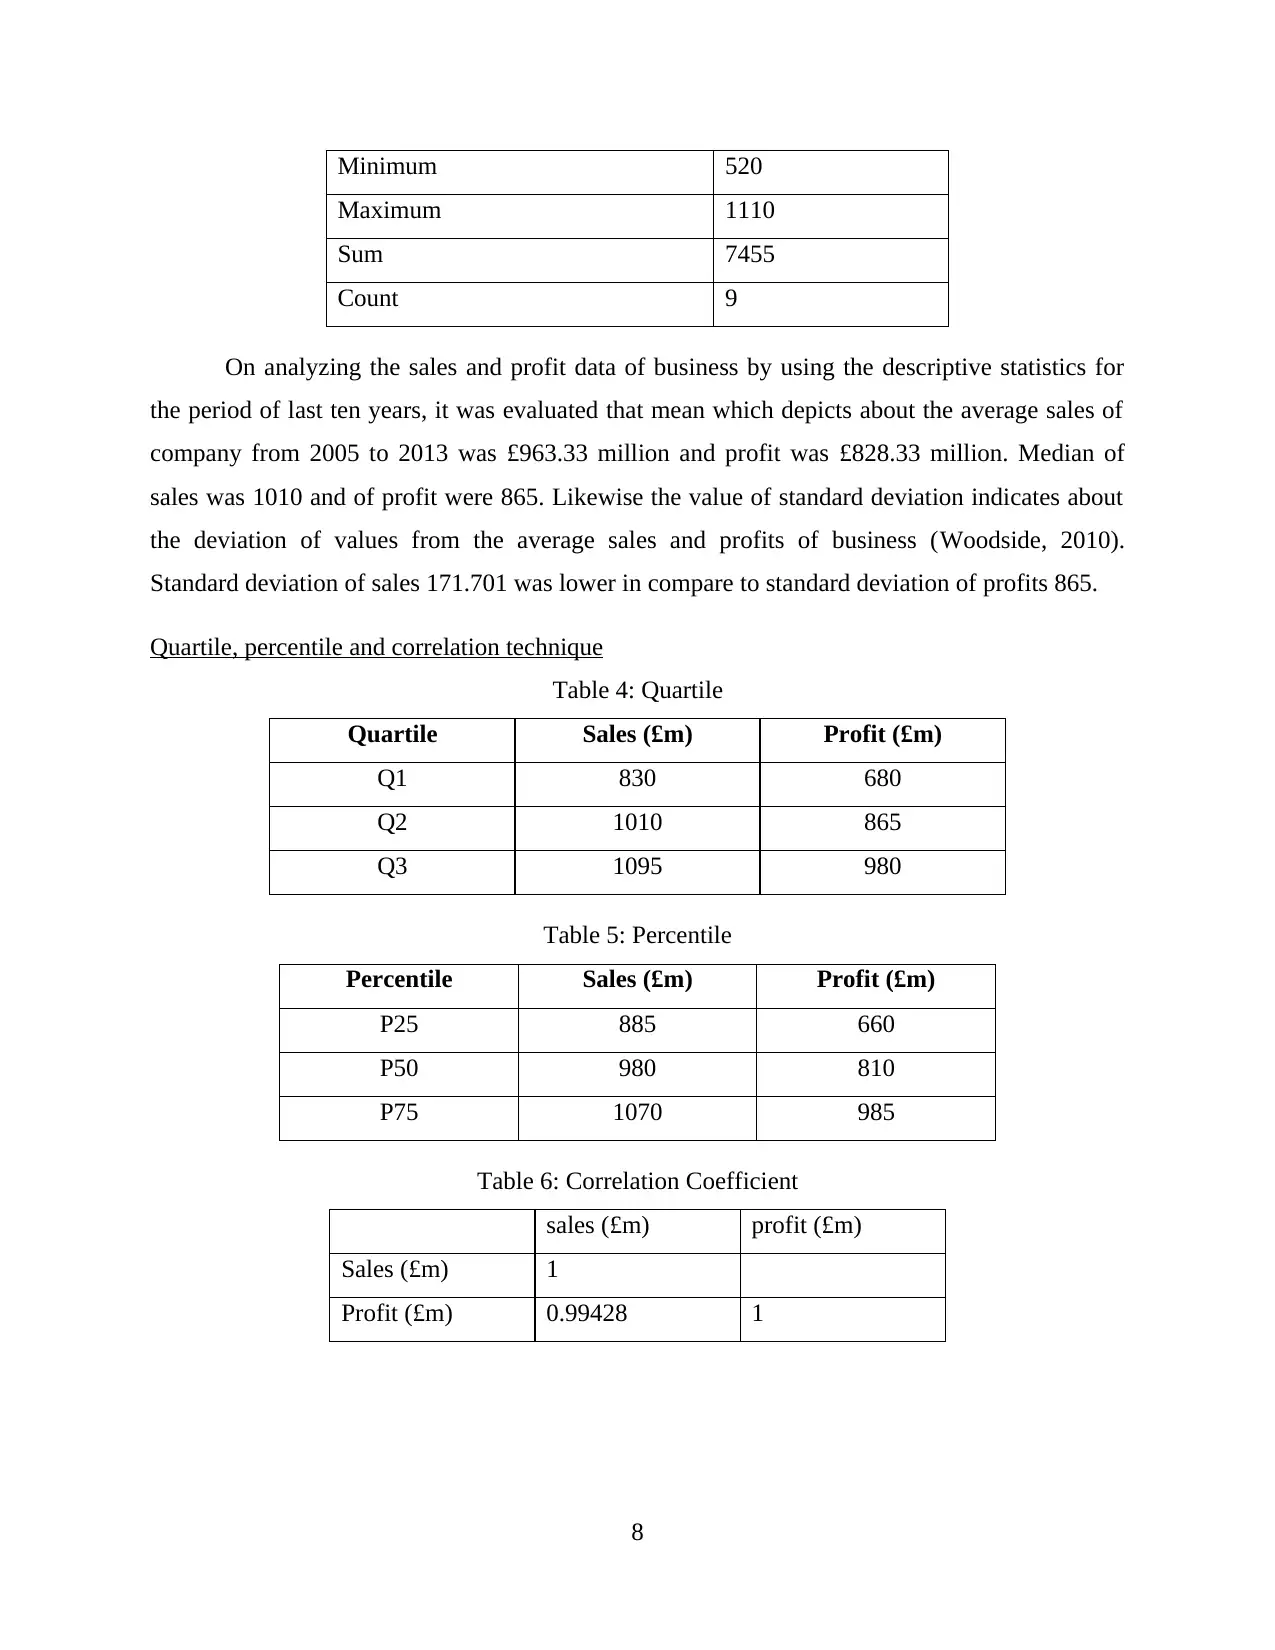
Quartile, percentile and correlation technique
Table 4: Quartile
Quartile Sales (£m) Profit (£m)
Q1 830 680
Q2 1010 865
Q3 1095 980
Table 5: Percentile
Percentile Sales (£m) Profit (£m)
P25 885 660
P50 980 810
P75 1070 985
Table 6: Correlation Coefficient
sales (£m) profit (£m)
Sales (£m) 1
Profit (£m) 0.99428 1
8
Maximum 1110
Sum 7455
Count 9
On analyzing the sales and profit data of business by using the descriptive statistics for
the period of last ten years, it was evaluated that mean which depicts about the average sales of
company from 2005 to 2013 was £963.33 million and profit was £828.33 million. Median of
sales was 1010 and of profit were 865. Likewise the value of standard deviation indicates about
the deviation of values from the average sales and profits of business (Woodside, 2010).
Standard deviation of sales 171.701 was lower in compare to standard deviation of profits 865.
Quartile, percentile and correlation technique
Table 4: Quartile
Quartile Sales (£m) Profit (£m)
Q1 830 680
Q2 1010 865
Q3 1095 980
Table 5: Percentile
Percentile Sales (£m) Profit (£m)
P25 885 660
P50 980 810
P75 1070 985
Table 6: Correlation Coefficient
sales (£m) profit (£m)
Sales (£m) 1
Profit (£m) 0.99428 1
8
600 700 800 900 1000 1100 1200 1300
0
200
400
600
800
1000
1200
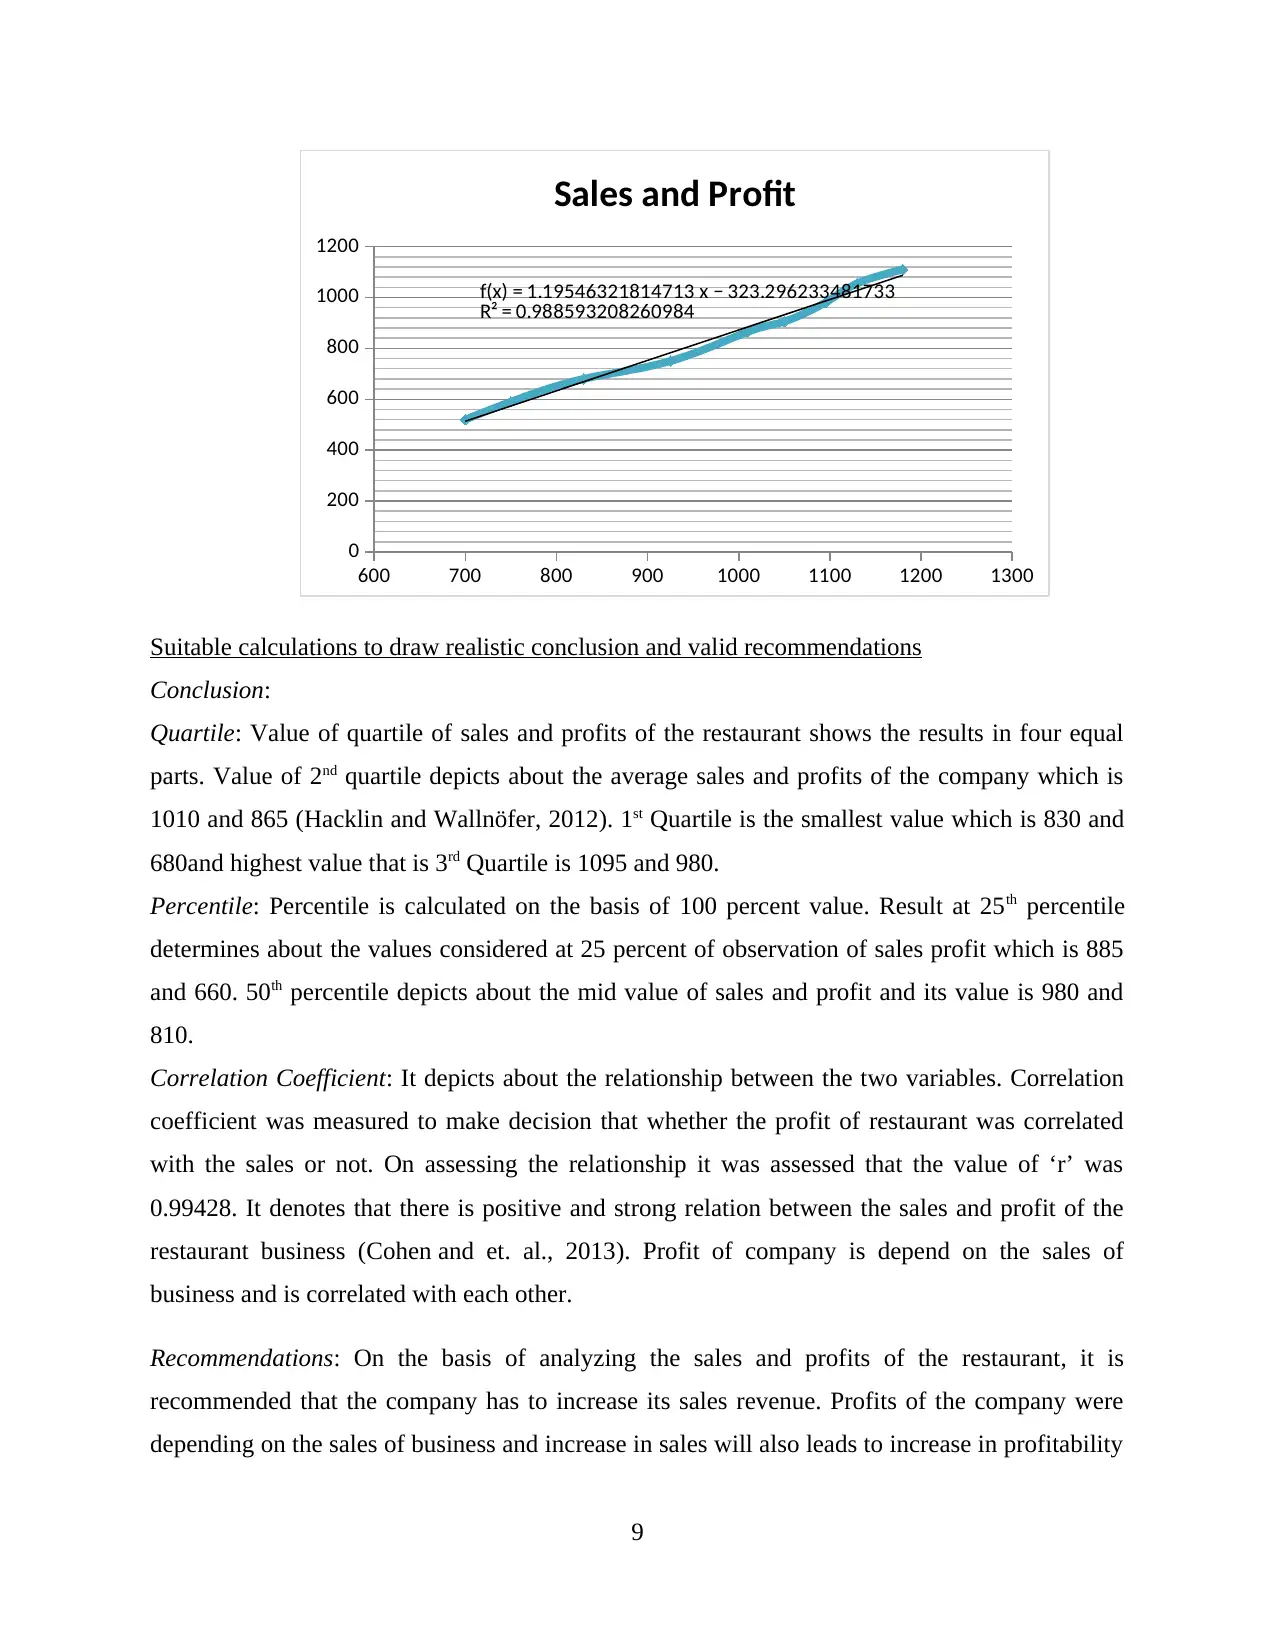
f(x) = 1.19546321814713 x − 323.296233481733
R² = 0.988593208260984
Sales and Profit
Suitable calculations to draw realistic conclusion and valid recommendations
Conclusion:
Quartile: Value of quartile of sales and profits of the restaurant shows the results in four equal
parts. Value of 2nd quartile depicts about the average sales and profits of the company which is
1010 and 865 (Hacklin and Wallnöfer, 2012). 1st Quartile is the smallest value which is 830 and
680and highest value that is 3rd Quartile is 1095 and 980.
Percentile: Percentile is calculated on the basis of 100 percent value. Result at 25th percentile
determines about the values considered at 25 percent of observation of sales profit which is 885
and 660. 50th percentile depicts about the mid value of sales and profit and its value is 980 and
810.
Correlation Coefficient: It depicts about the relationship between the two variables. Correlation
coefficient was measured to make decision that whether the profit of restaurant was correlated
with the sales or not. On assessing the relationship it was assessed that the value of ‘r’ was
0.99428. It denotes that there is positive and strong relation between the sales and profit of the
restaurant business (Cohen and et. al., 2013). Profit of company is depend on the sales of
business and is correlated with each other.
Recommendations: On the basis of analyzing the sales and profits of the restaurant, it is
recommended that the company has to increase its sales revenue. Profits of the company were
depending on the sales of business and increase in sales will also leads to increase in profitability
9
0
200
400
600
800
1000
1200
f(x) = 1.19546321814713 x − 323.296233481733
R² = 0.988593208260984
Sales and Profit
Suitable calculations to draw realistic conclusion and valid recommendations
Conclusion:
Quartile: Value of quartile of sales and profits of the restaurant shows the results in four equal
parts. Value of 2nd quartile depicts about the average sales and profits of the company which is
1010 and 865 (Hacklin and Wallnöfer, 2012). 1st Quartile is the smallest value which is 830 and
680and highest value that is 3rd Quartile is 1095 and 980.
Percentile: Percentile is calculated on the basis of 100 percent value. Result at 25th percentile
determines about the values considered at 25 percent of observation of sales profit which is 885
and 660. 50th percentile depicts about the mid value of sales and profit and its value is 980 and
810.
Correlation Coefficient: It depicts about the relationship between the two variables. Correlation
coefficient was measured to make decision that whether the profit of restaurant was correlated
with the sales or not. On assessing the relationship it was assessed that the value of ‘r’ was
0.99428. It denotes that there is positive and strong relation between the sales and profit of the
restaurant business (Cohen and et. al., 2013). Profit of company is depend on the sales of
business and is correlated with each other.
Recommendations: On the basis of analyzing the sales and profits of the restaurant, it is
recommended that the company has to increase its sales revenue. Profits of the company were
depending on the sales of business and increase in sales will also leads to increase in profitability
9
⊘ This is a preview!⊘
Do you want full access?
Subscribe today to unlock all pages.
Trusted by 1+ million students worldwide
1 out of 23
Related Documents


Your All-in-One AI-Powered Toolkit for Academic Success.
+13062052269
info@desklib.com
Available 24*7 on WhatsApp / Email
![[object Object]](/_next/static/media/star-bottom.7253800d.svg)
Unlock your academic potential
Copyright © 2020–2026 A2Z Services. All Rights Reserved. Developed and managed by ZUCOL.