Duque Papers: Business Expansion Report for German Stationary Market

Verified

Added on  2020/12/29

|16
|2603
|281
Report
AI Summary
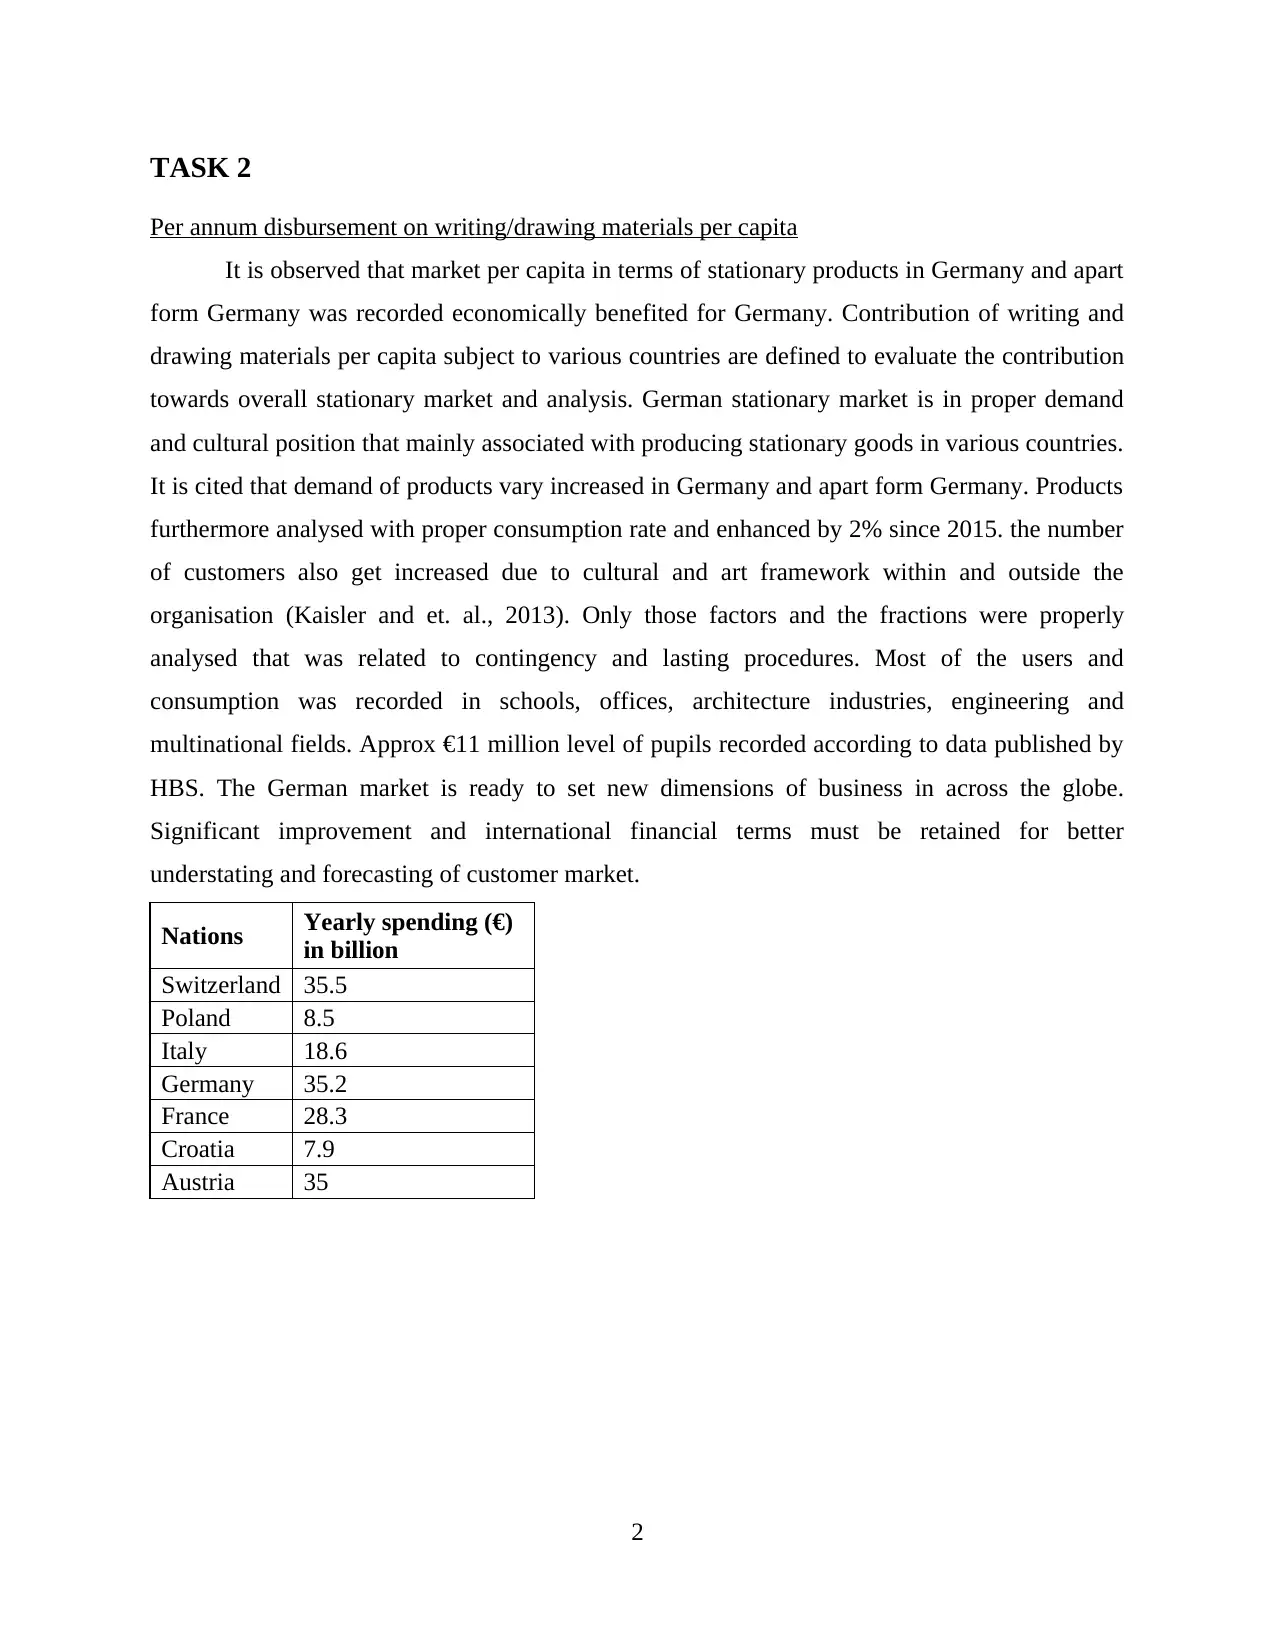
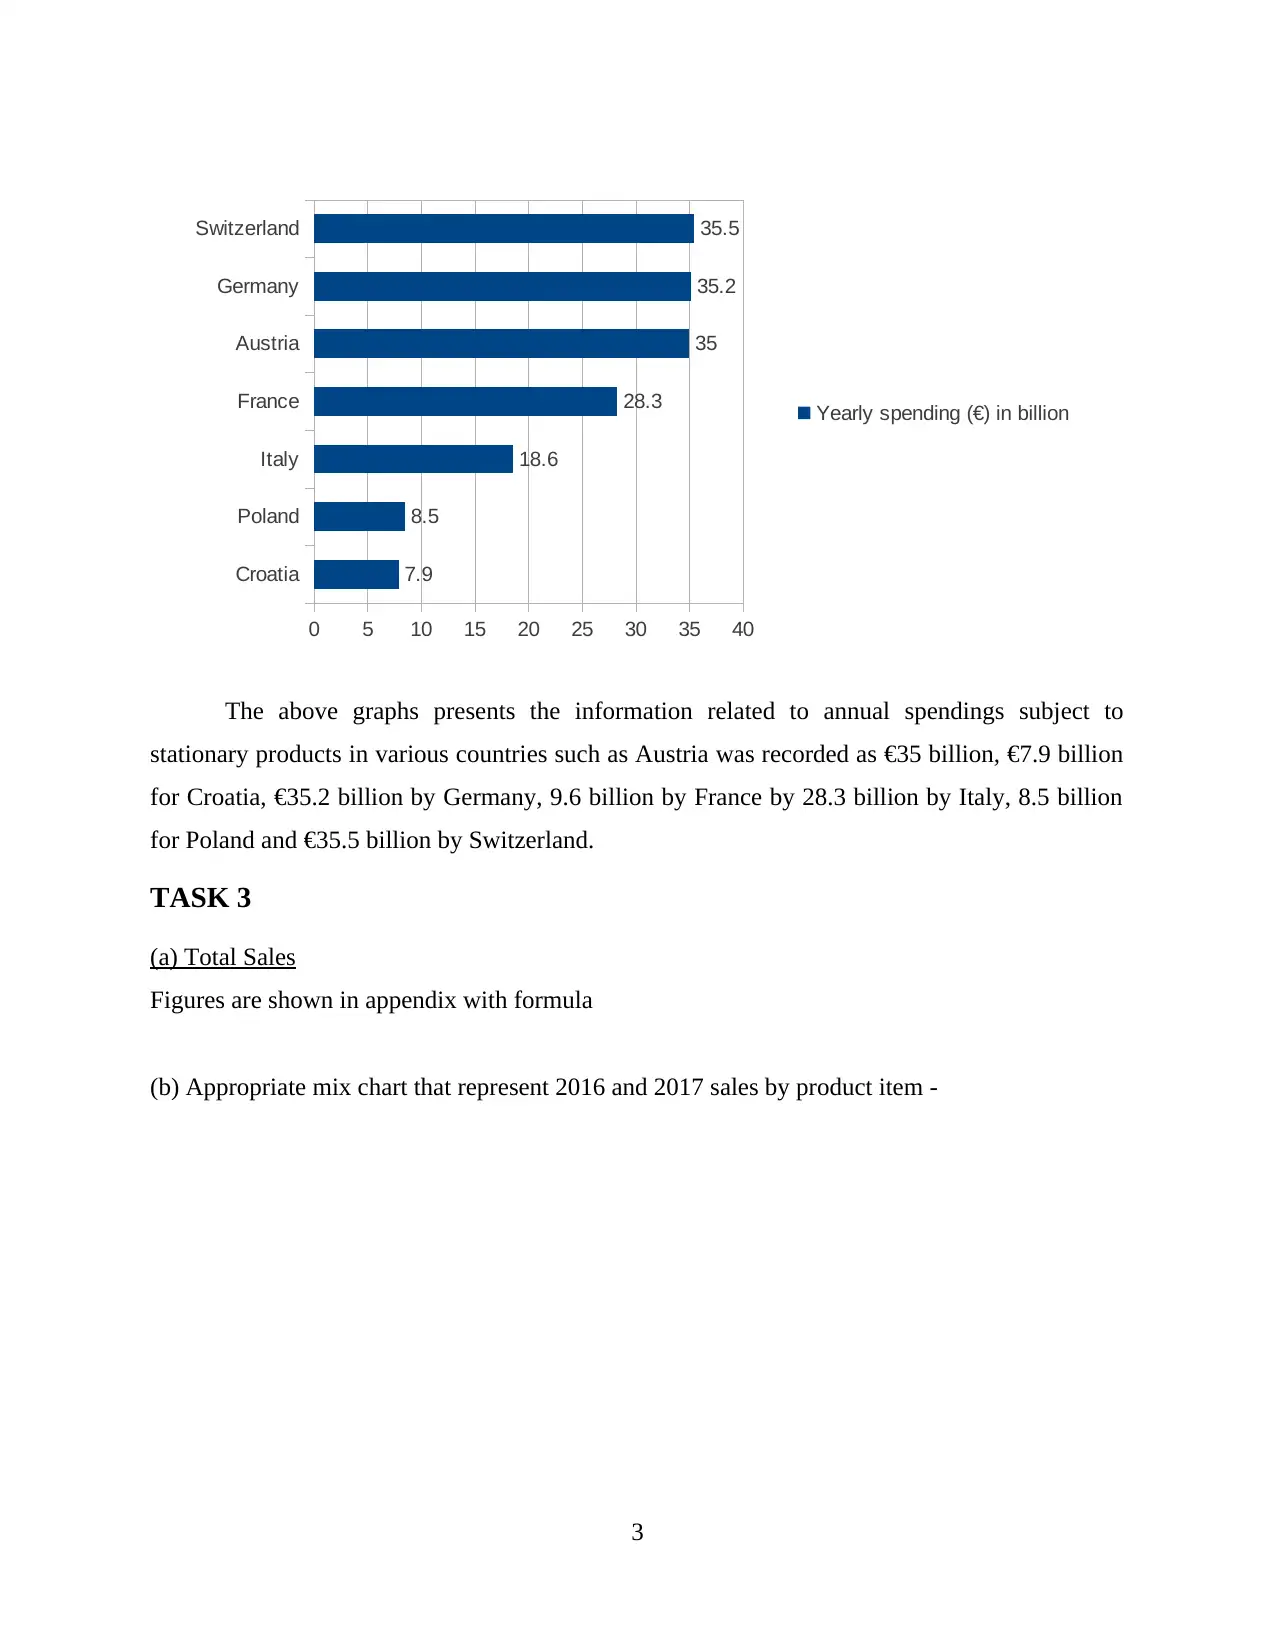
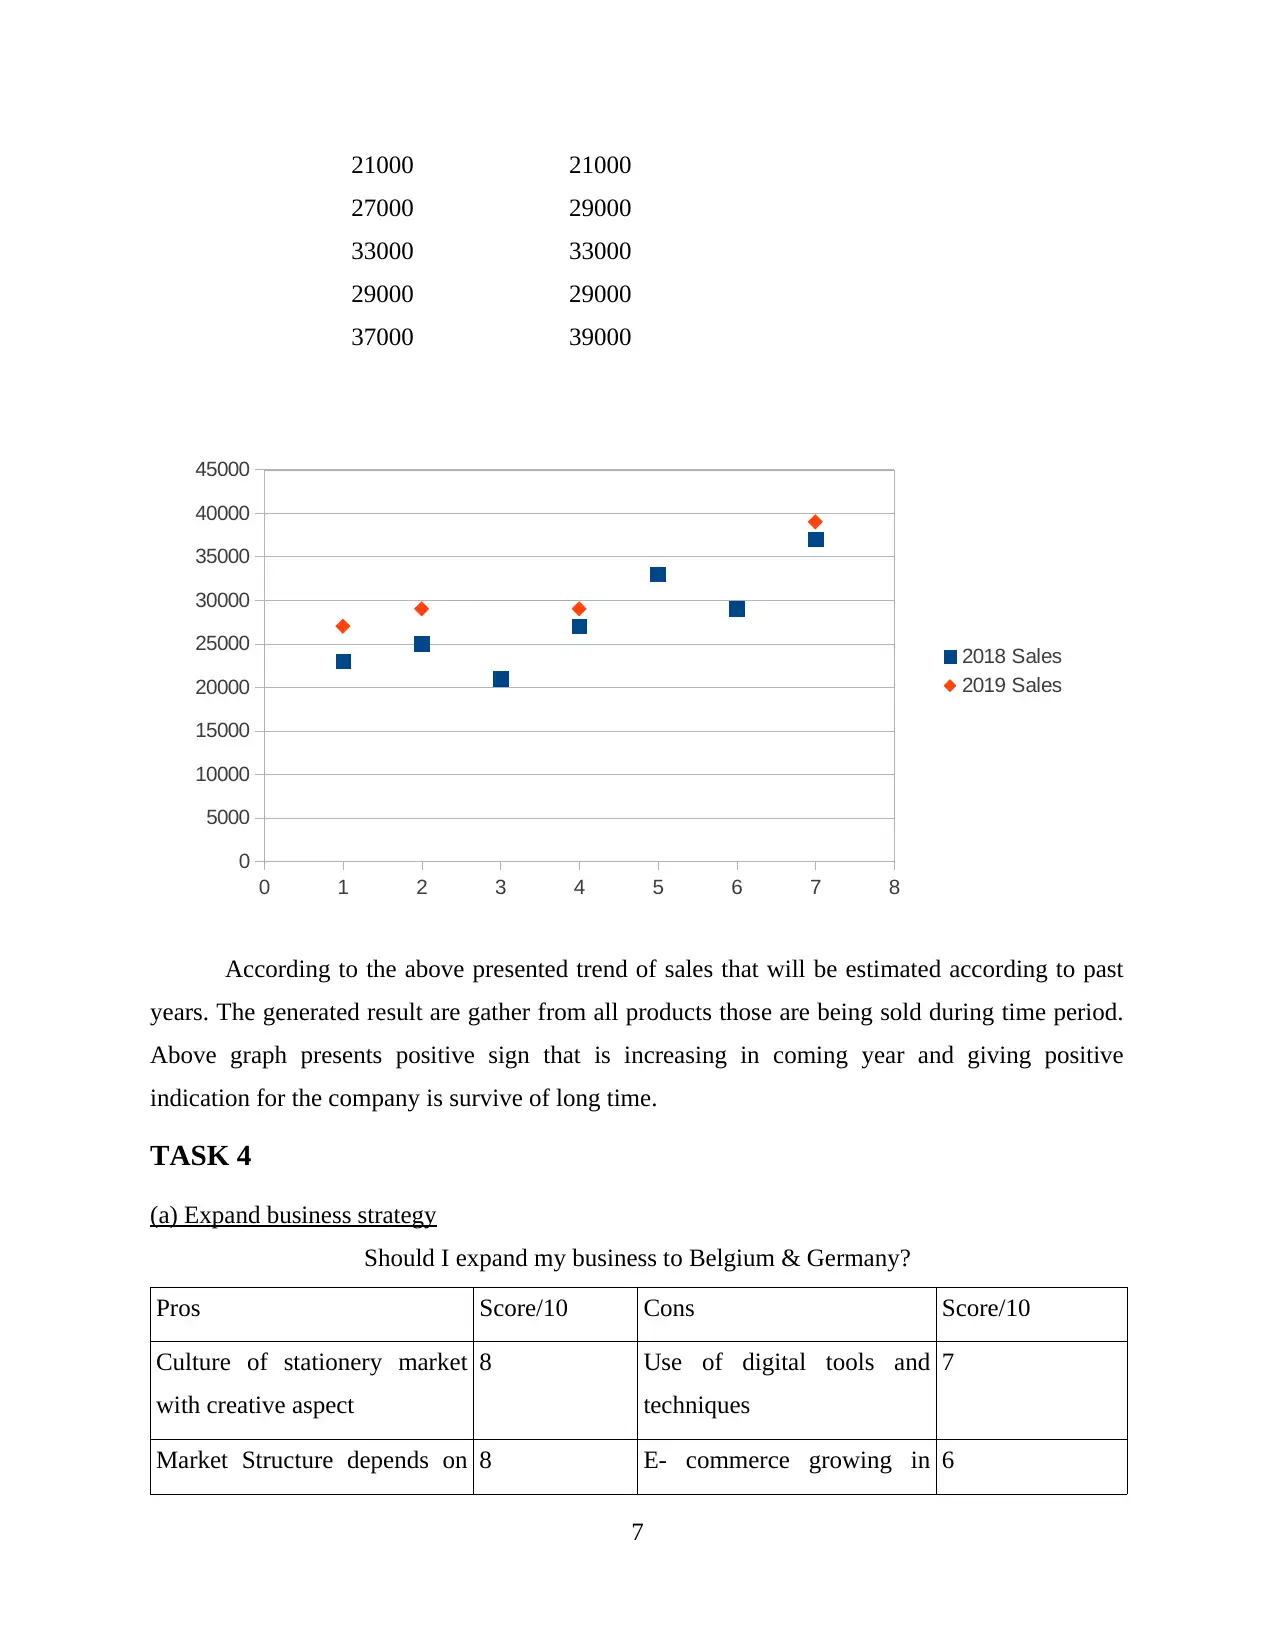
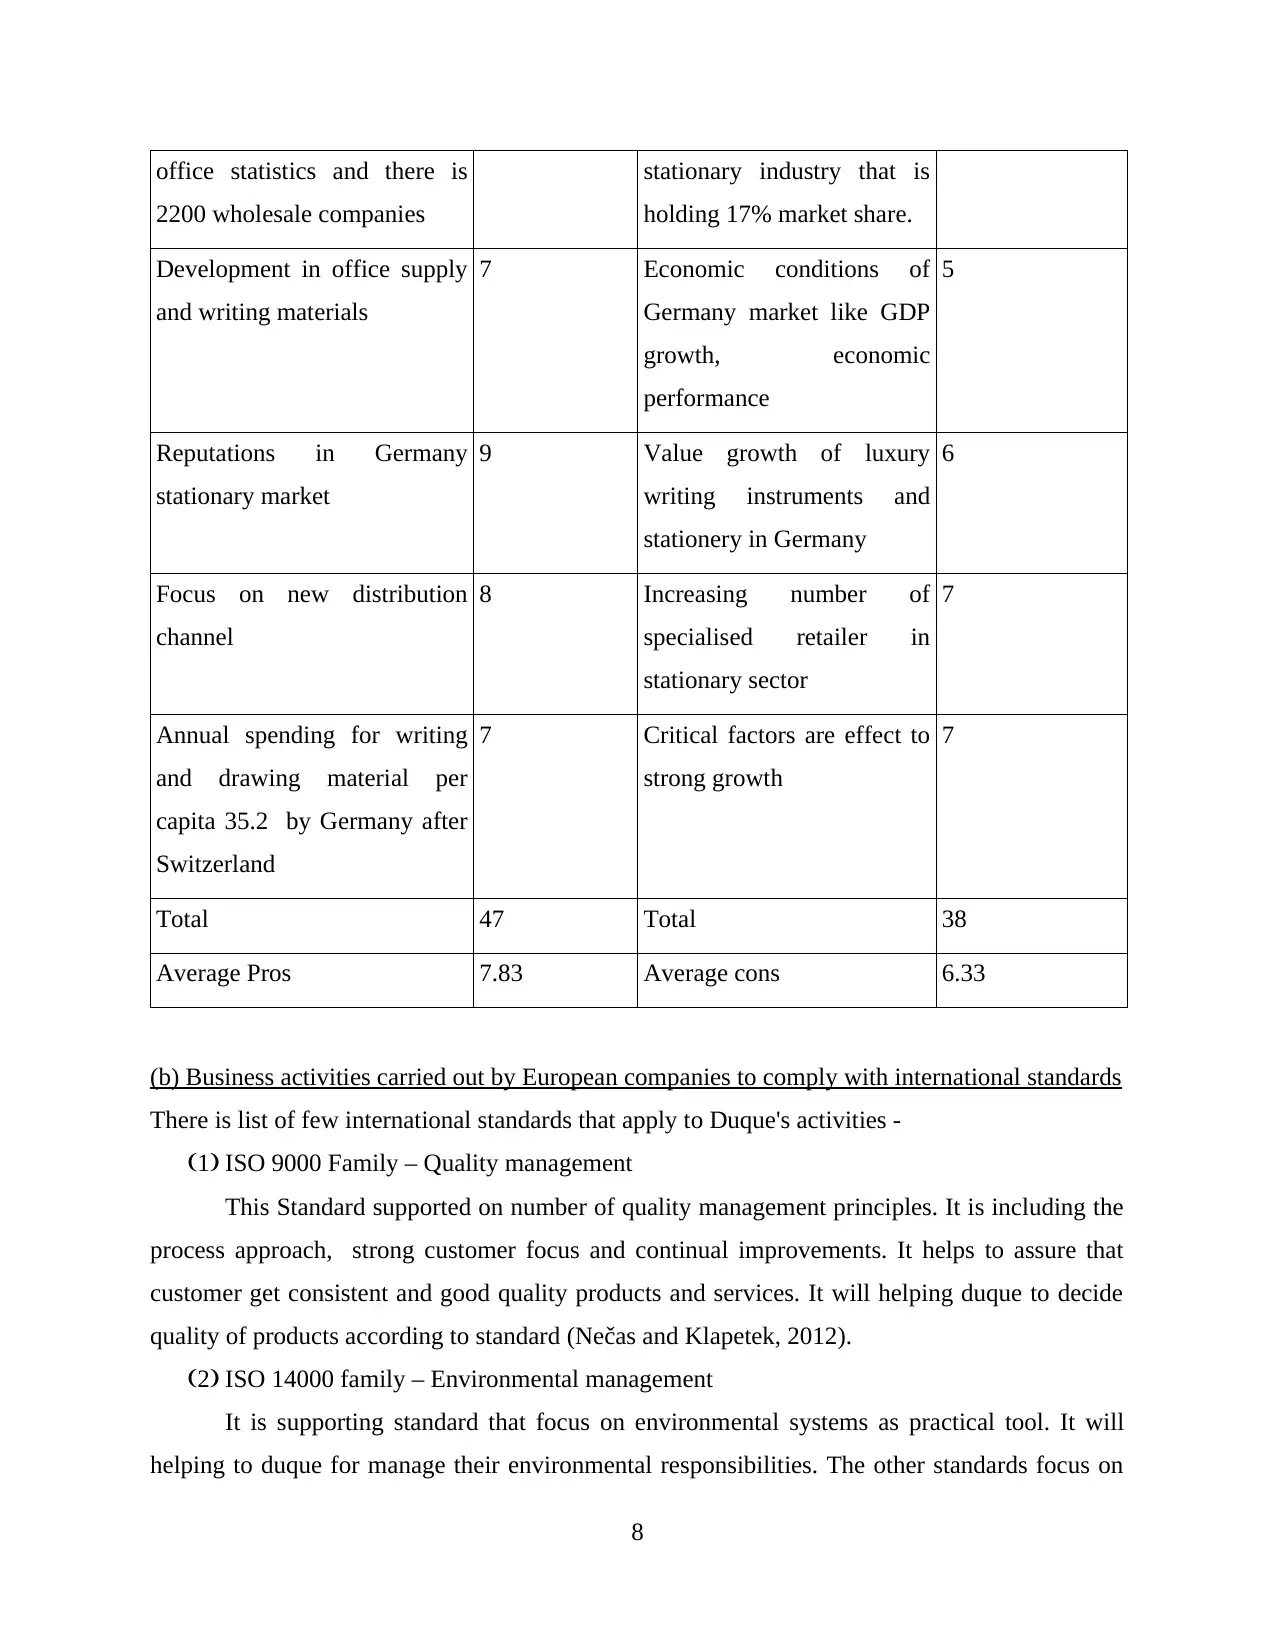
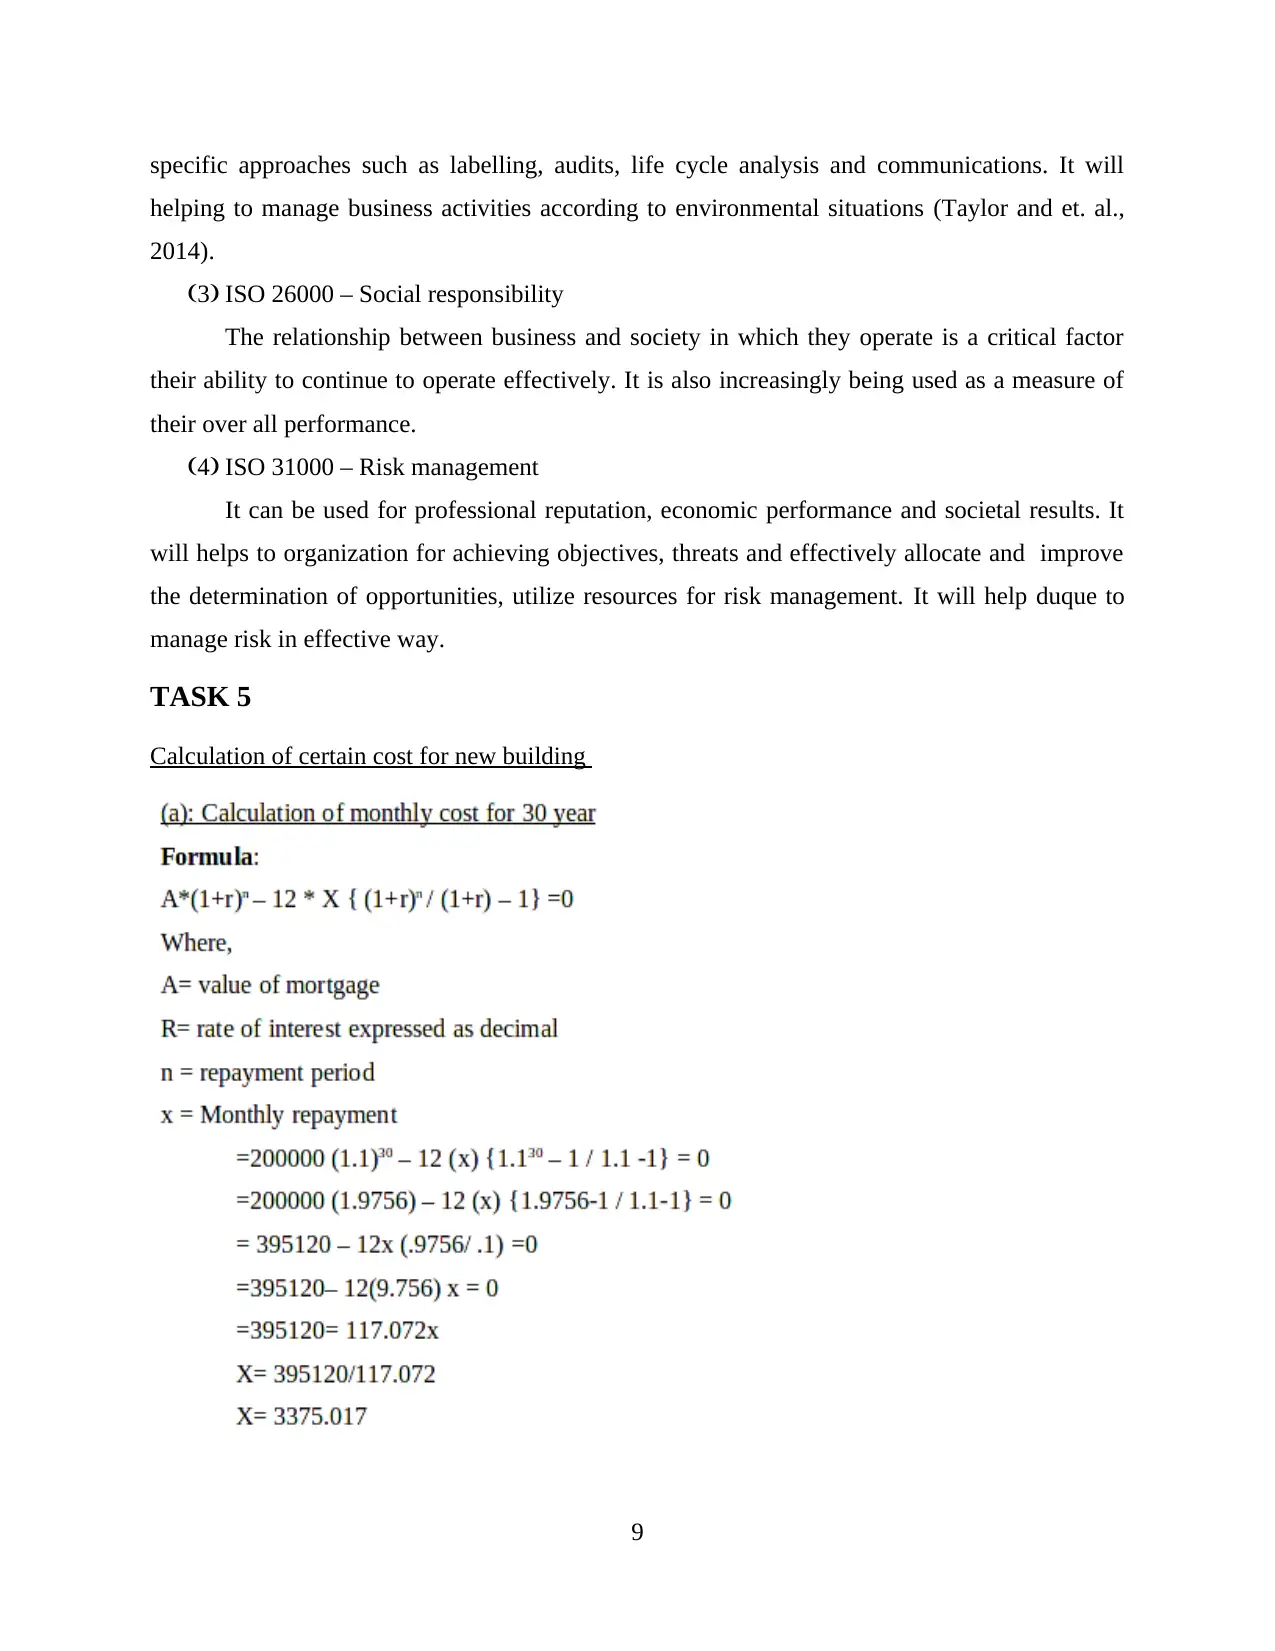
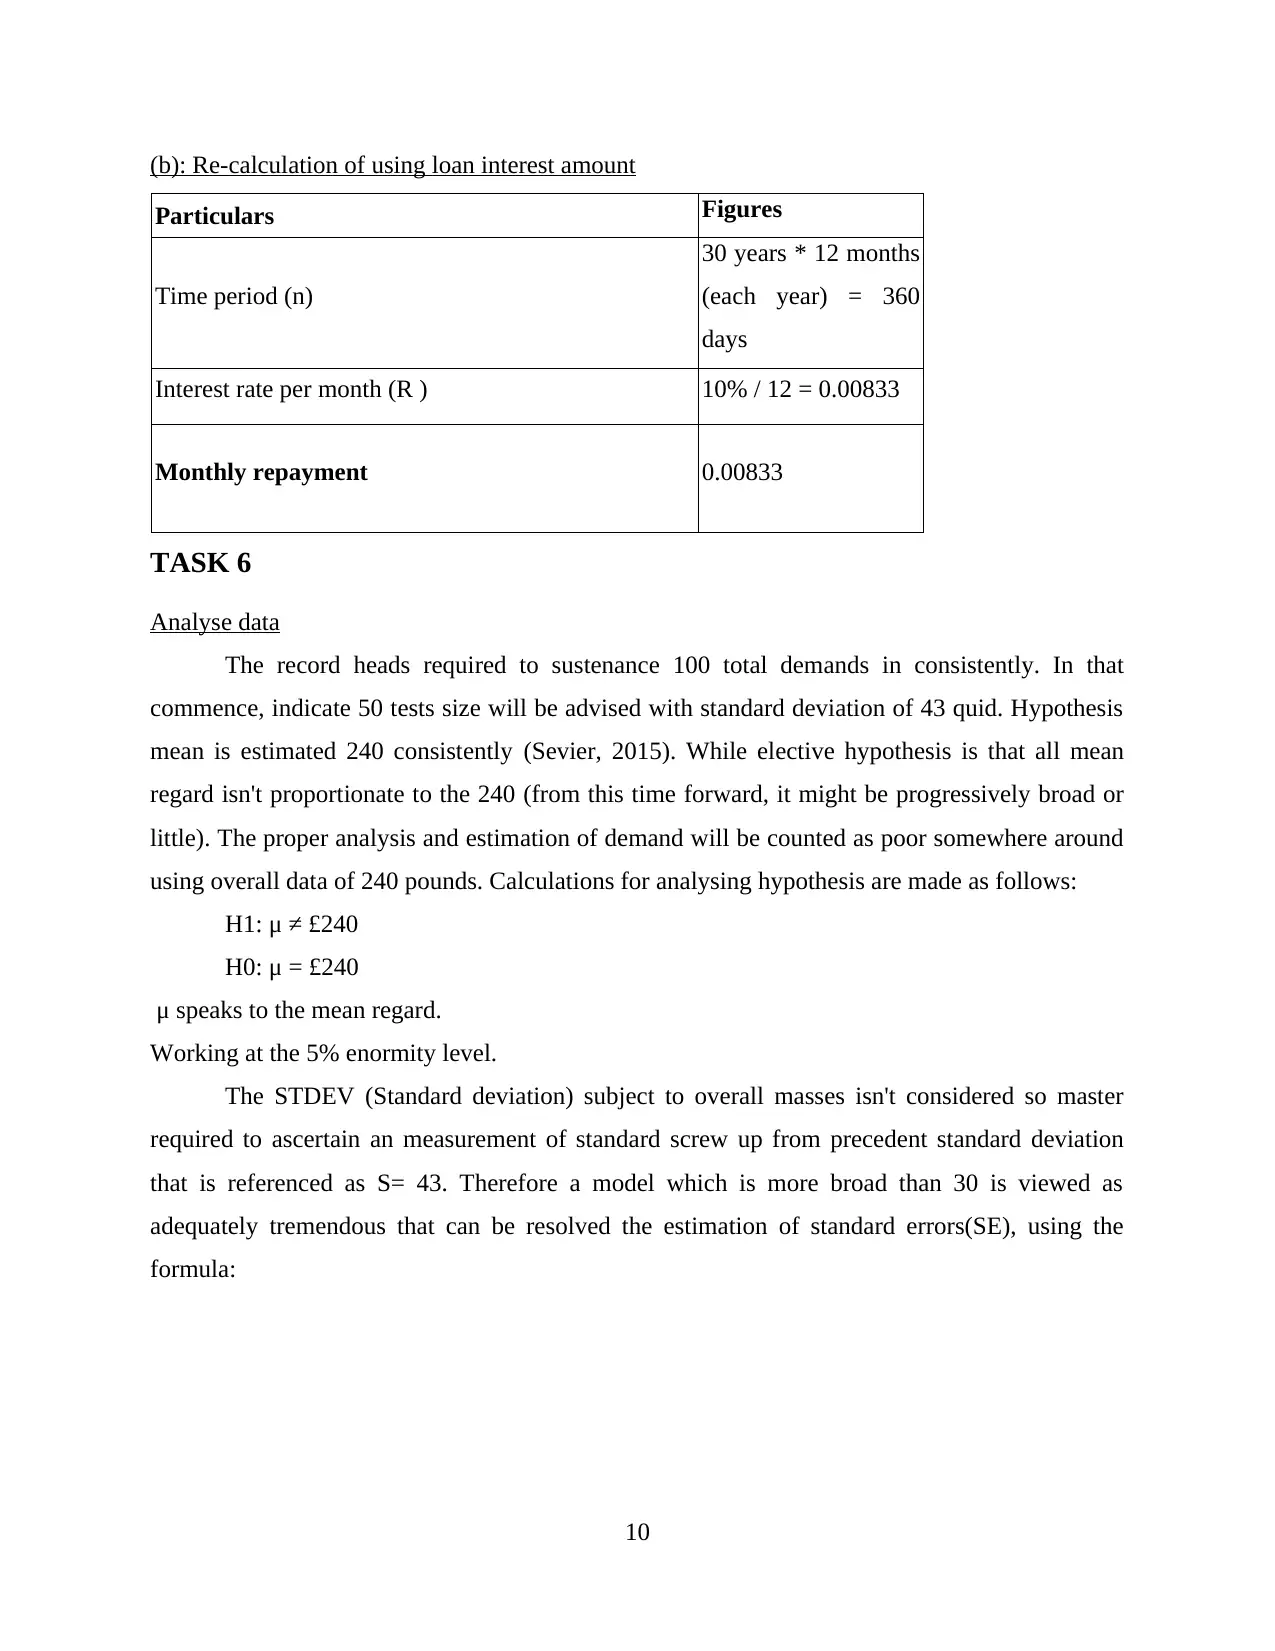
This report analyzes the business data of Donald Duque's stationary business, focusing on potential expansion into the German market. It assesses the German stationary market, evaluating market size, key players, and consumer behavior. The report includes an analysis of per capita spending on stationary products across various countries, providing a comparative perspective. Task 3 presents sales figures, mix charts, and correlation coefficients to evaluate the company's performance. Based on this analysis, the report predicts future sales and develops an expansion strategy, weighing the pros and cons of expanding into Belgium and Germany. It also examines international standards relevant to Duque's business activities and calculates costs associated with a new building and loan interest. The report concludes with an analysis of customer reports and provides recommendations for effective decision-making to support the business expansion in Germany.
Document Page
DUQUE PAPETIERS GROS
tabler-icon-diamond-filled.svg

Paraphrase This Document

Need a fresh take? Get an instant paraphrase of this document with our AI Paraphraser
Document Page
Table of Contents
Document Page
INTRODUCTION
Assessment of data for a business expansion, decision making and strategic management
are recognised as data handling. This report is based upon the business data of Donald Duque's
domestic stationary business in Northern France (Bardach and Patashnik, 2015). Duque has
successfully established customer market in Northern France due to increasing scope of customer
market and demand of stationary market organisation is seeking opportunities to explore the
business in European countries. Type of business information is summarised and presented to
managers by implementing statistical and logical tools as graphs, hypothesis analysis.
Possibilities of expanding business in Germany analysed with pros and cons table and viability
evaluated on the basis of international standards.
TASK 1
Analysis of potential stationary market in Germany
Stationary market in Germany is in stable and well position. The market is full of various
stationary brands such as Staedtler, Faber-Castell, Stabilo and Lamy, edding etc. The market is
mainly associated with analysing the habits and interpretations with creating new stationary
products to emerge the imagination and art for architects and sketch artist. As per MGSS report
the stationary market attained the level of turnover to €14.8 billion per year that is equal to
individual spendings more than €182 annually. It is evaluated that 70% of the Germany
stationary brands have been increased their sales records due to favourable business conditions
and business roles. It is analysed that Verband-der and PBS- Markenindustri has gain the total
Germany market by 3.5% till 2014. It is expected that domestic demand will be increased by
2.5% and the international demand is expected to grow as 5%.
Development is the essential requirement for sustainable success and base of
organisation. Net turnover was analysed as 5500 specialist and retailers form which net turnover
generated as €250000. AS per HBS quality of goods are analysed adequate and stable in terms of
products and services. Drawing and painting materials are high on demand these days that are
creating the products sales and average rate of products with countermovement to enhanced use
of digital products (Charnes and et. al., 2013). It is assessed that German retailers provide
fermium quality of stationary products in Malaysia that has enhanced the structure of business at
international level.
1
Document Page
TASK 2
Per annum disbursement on writing/drawing materials per capita
It is observed that market per capita in terms of stationary products in Germany and apart
form Germany was recorded economically benefited for Germany. Contribution of writing and
drawing materials per capita subject to various countries are defined to evaluate the contribution
towards overall stationary market and analysis. German stationary market is in proper demand
and cultural position that mainly associated with producing stationary goods in various countries.
It is cited that demand of products vary increased in Germany and apart form Germany. Products
furthermore analysed with proper consumption rate and enhanced by 2% since 2015. the number
of customers also get increased due to cultural and art framework within and outside the
organisation (Kaisler and et. al., 2013). Only those factors and the fractions were properly
analysed that was related to contingency and lasting procedures. Most of the users and
consumption was recorded in schools, offices, architecture industries, engineering and
multinational fields. Approx €11 million level of pupils recorded according to data published by
HBS. The German market is ready to set new dimensions of business in across the globe.
Significant improvement and international financial terms must be retained for better
understating and forecasting of customer market.
Nations Yearly spending (€)
in billion
Switzerland 35.5
Poland 8.5
Italy 18.6
Germany 35.2
France 28.3
Croatia 7.9
Austria 35
2
tabler-icon-diamond-filled.svg

Paraphrase This Document

Need a fresh take? Get an instant paraphrase of this document with our AI Paraphraser
Document Page
Croatia
Poland
Italy
France
Austria
Germany
Switzerland
0 5 10 15 20 25 30 35 40
7.9
8.5
18.6
28.3
35
35.2
35.5
Yearly spending (€) in billion
The above graphs presents the information related to annual spendings subject to
stationary products in various countries such as Austria was recorded as €35 billion, €7.9 billion
for Croatia, €35.2 billion by Germany, 9.6 billion by France by 28.3 billion by Italy, 8.5 billion
for Poland and €35.5 billion by Switzerland.
TASK 3
(a) Total Sales
Figures are shown in appendix with formula
(b) Appropriate mix chart that represent 2016 and 2017 sales by product item -
3
Document Page
26000
27000
18000
25000
29000
27000
30000
printer cartridges
general office supplies
low-cost printers
office furniture
shredders
paper-based supplies
writing/drawing materials
(c) Computation of Coefficient correlation
4
Document Page
Scatter Chart of 2015-16 sales
0 1 2 3 4 5 6 7 8
0
5000
10000
15000
20000
25000
30000
35000
2015 Sales (€)
2016 Sales (€)
Scatter chart of 2016-17 sales
5
tabler-icon-diamond-filled.svg

Paraphrase This Document

Need a fresh take? Get an instant paraphrase of this document with our AI Paraphraser
Document Page
0 1 2 3 4 5 6 7 8
0
5000
10000
15000
20000
25000
30000
35000
2016 Sales (€)
2017 Sales (€)
As indicated by the above displayed dissipated graphs, it has been demonstrating sure
budgetary data of organization by expanding the consistently organizations position. The
outcomes gathered in the year 2015 to 2016 is especially close and giving better development
and maintainability to the organization. There is wellbeing relationships among deals volume in
2015 and 2016 individually with adequate results of 0.90088 and 0.847. It is plotted by utilizing
a dissipate outline in regard to look at the relations among each another. It has been just
dependable and profitable measure which will be connected with the estimation of r that can be
utilized by the record directors to help the organization and give guidance of direct connection
between the two arrangement of information factors.
(d) Predication of total sales during the period of 2018-19
After all data analysis, it has been seen that financial position of the company presenting
that there is must to reach effective level of decision. For developing plan relating to the sales
need to taken sales report from 2017 by the company (Munson and et. al., 2014). It is develop for
future time period for targeted to increase overall sales that will be 2% increasing from past
years. In order to ascertain the predication sale for upcoming year are as follows -
2018 Sales (€) 2019 Sales (€)
23000 27000
25000 29000
6
Document Page
21000 21000
27000 29000
33000 33000
29000 29000
37000 39000
0 1 2 3 4 5 6 7 8
0
5000
10000
15000
20000
25000
30000
35000
40000
45000
2018 Sales
2019 Sales
According to the above presented trend of sales that will be estimated according to past
years. The generated result are gather from all products those are being sold during time period.
Above graph presents positive sign that is increasing in coming year and giving positive
indication for the company is survive of long time.
TASK 4
(a) Expand business strategy
Should I expand my business to Belgium & Germany?
Pros Score/10 Cons Score/10
Culture of stationery market
with creative aspect
8 Use of digital tools and
techniques
7
Market Structure depends on 8 E- commerce growing in 6
7
Document Page
office statistics and there is
2200 wholesale companies
stationary industry that is
holding 17% market share.
Development in office supply
and writing materials
7 Economic conditions of
Germany market like GDP
growth, economic
performance
5
Reputations in Germany
stationary market
9 Value growth of luxury
writing instruments and
stationery in Germany
6
Focus on new distribution
channel
8 Increasing number of
specialised retailer in
stationary sector
7
Annual spending for writing
and drawing material per
capita 35.2 by Germany after
Switzerland
7 Critical factors are effect to
strong growth
7
Total 47 Total 38
Average Pros 7.83 Average cons 6.33
(b) Business activities carried out by European companies to comply with international standards
There is list of few international standards that apply to Duque's activities -
(1) ISO 9000 Family – Quality management
This Standard supported on number of quality management principles. It is including the
process approach, strong customer focus and continual improvements. It helps to assure that
customer get consistent and good quality products and services. It will helping duque to decide
quality of products according to standard (Nečas and Klapetek, 2012).
(2) ISO 14000 family – Environmental management
It is supporting standard that focus on environmental systems as practical tool. It will
helping to duque for manage their environmental responsibilities. The other standards focus on
8
tabler-icon-diamond-filled.svg

Paraphrase This Document

Need a fresh take? Get an instant paraphrase of this document with our AI Paraphraser
Document Page
specific approaches such as labelling, audits, life cycle analysis and communications. It will
helping to manage business activities according to environmental situations (Taylor and et. al.,
2014).
(3) ISO 26000 – Social responsibility
The relationship between business and society in which they operate is a critical factor
their ability to continue to operate effectively. It is also increasingly being used as a measure of
their over all performance.
(4) ISO 31000 – Risk management
It can be used for professional reputation, economic performance and societal results. It
will helps to organization for achieving objectives, threats and effectively allocate and improve
the determination of opportunities, utilize resources for risk management. It will help duque to
manage risk in effective way.
TASK 5
Calculation of certain cost for new building
9
Document Page
(b): Re-calculation of using loan interest amount
Particulars Figures
Time period (n)
30 years * 12 months
(each year) = 360
days
Interest rate per month (R ) 10% / 12 = 0.00833
Monthly repayment 0.00833
TASK 6
Analyse data
The record heads required to sustenance 100 total demands in consistently. In that
commence, indicate 50 tests size will be advised with standard deviation of 43 quid. Hypothesis
mean is estimated 240 consistently (Sevier, 2015). While elective hypothesis is that all mean
regard isn't proportionate to the 240 (from this time forward, it might be progressively broad or
little). The proper analysis and estimation of demand will be counted as poor somewhere around
using overall data of 240 pounds. Calculations for analysing hypothesis are made as follows:
H1: μ ≠ £240
H0: μ = £240
μ speaks to the mean regard.
Working at the 5% enormity level.
The STDEV (Standard deviation) subject to overall masses isn't considered so master
required to ascertain an measurement of standard screw up from precedent standard deviation
that is referenced as S= 43. Therefore a model which is more broad than 30 is viewed as
adequately tremendous that can be resolved the estimation of standard errors(SE), using the
formula:
10
chevron_up_icon
1 out of 16
circle_padding
hide_on_mobile
zoom_out_icon
[object Object]