Business Decision Making Report: Data Analysis and Strategies
VerifiedAdded on 2020/07/23
|22
|4351
|38
Report
AI Summary
This report provides a detailed analysis of business decision-making processes, focusing on data collection, analysis, and strategic planning for the expansion of Murano restaurant. It covers the use of primary and secondary data sources, survey methodologies, and questionnaire design to gather customer insights. The report summarizes data using representative values, evaluates results to draw conclusions, and utilizes measures of dispersion and correlation coefficients. It also demonstrates the creation of graphs and trend lines for forecasting, along with the development of business presentations and formal reports. Furthermore, the report addresses the use of information processing tools, project planning, and financial tools for decision-making. The findings aim to inform effective strategies for organizational growth and development. The report also includes key findings from a customer survey, assessing preferences and satisfaction levels, and provides recommendations for the expansion of Murano restaurant based on the data analysis.

BUSINESS DECISION
MAKING
MAKING
Paraphrase This Document
Need a fresh take? Get an instant paraphrase of this document with our AI Paraphraser
Table of Contents
INTRODUCTION...........................................................................................................................1
TASK 1............................................................................................................................................1
1.1 Plan for the collection of primary and secondary data..........................................................1
1.2 The survey methodology and sampling frame used..............................................................2
1.3 Questionnaire for a given business problem.........................................................................3
TASK 2............................................................................................................................................5
2.1 information for decision making by summarising data using representative values............5
2.2 Evaluation of results to draw valid conclusions in an organisational context......................7
2.3 the data using measures of dispersion to information a given business scenario.................8
2.4 Quartile percentiles and the correlation coefficient to draw useful conclusion....................9
TASK 3..........................................................................................................................................10
3.1 Produce graphs using spreadsheets and draw valid conclusion..........................................10
3.2 Create trend lines in spreadsheet graphs to assist in forecasting for specified business
information................................................................................................................................14
3.3 Business presentation using suitable software and techniques to disseminate information
effectively..................................................................................................................................15
3.4 Produce a formal business report........................................................................................15
TASK 4..........................................................................................................................................16
4.1 Use of appropriate information processing tools................................................................16
4.2 Prepare a project plan for an activity and determine the critical path.................................17
4.3 Use financial tools for decision making..............................................................................18
CONCLUSION..............................................................................................................................18
REFERENCES..............................................................................................................................20
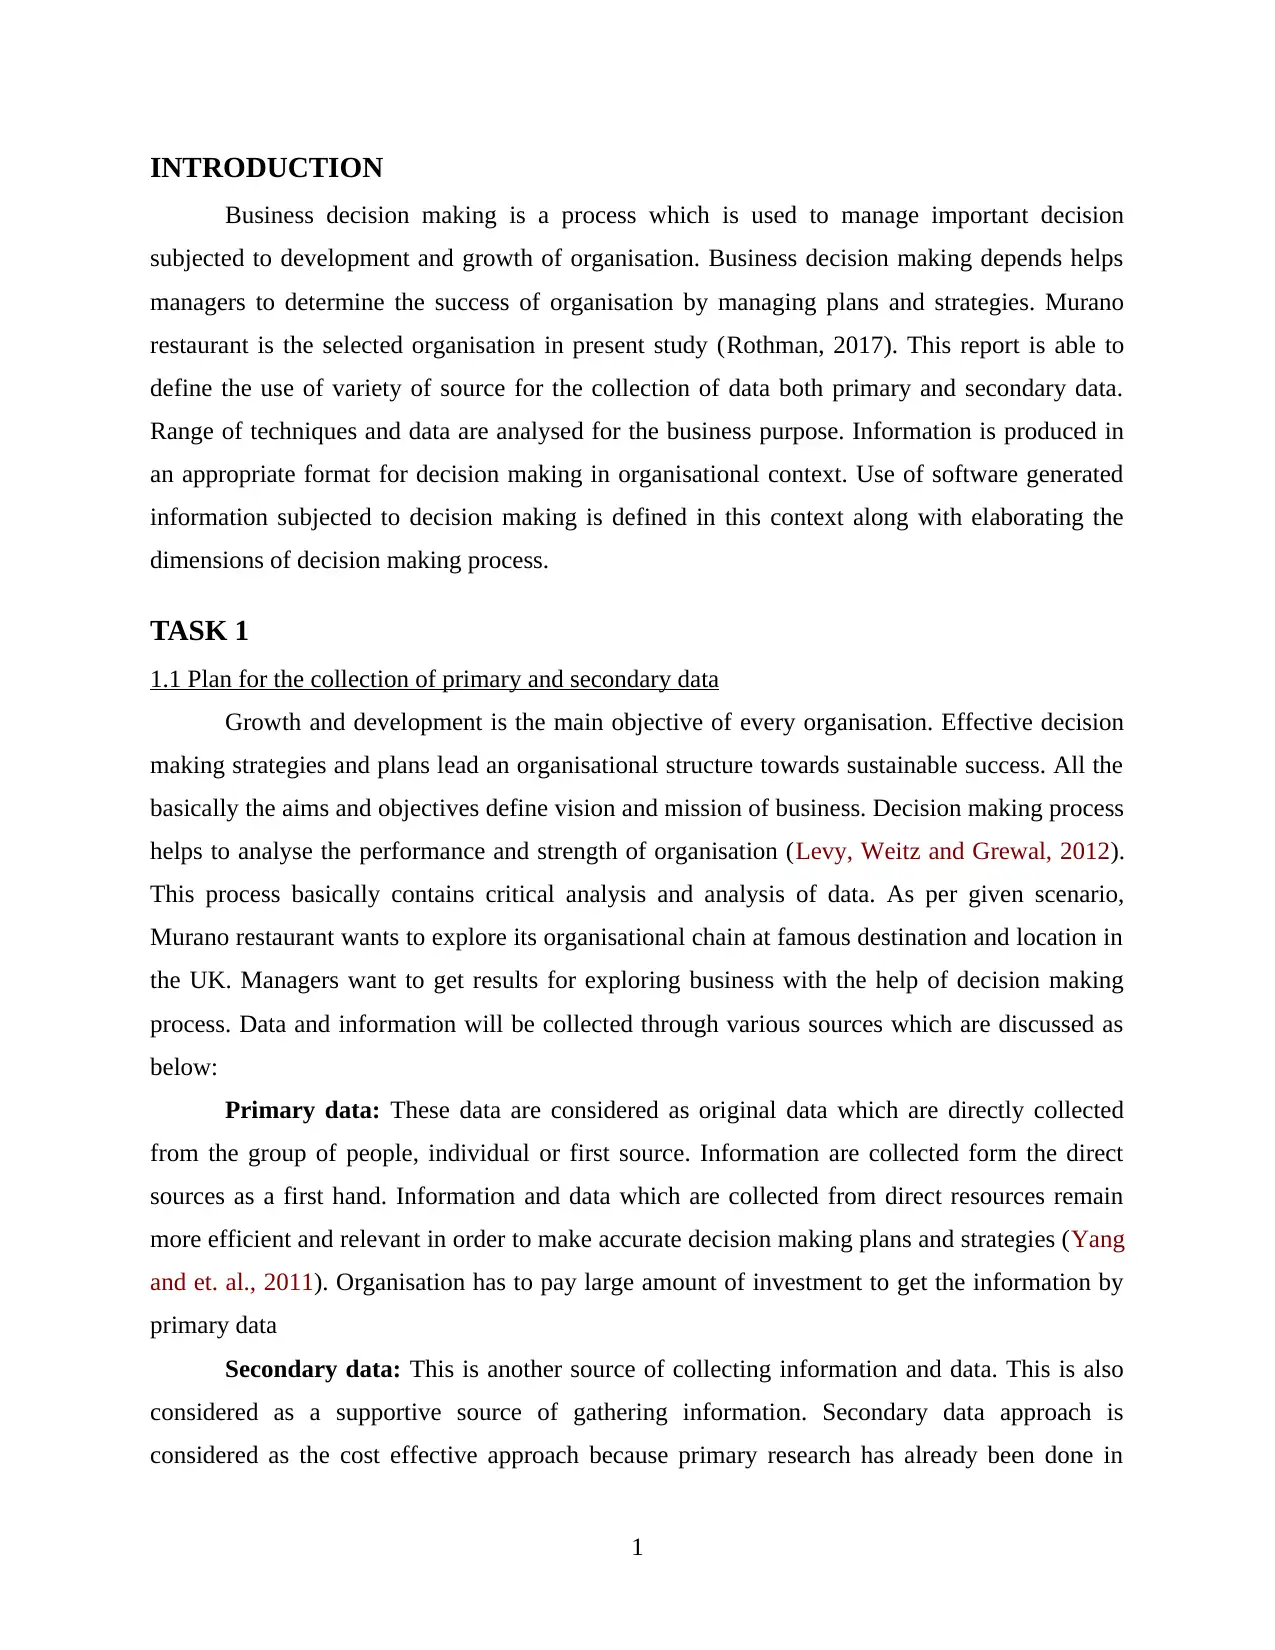
INTRODUCTION
Business decision making is a process which is used to manage important decision
subjected to development and growth of organisation. Business decision making depends helps
managers to determine the success of organisation by managing plans and strategies. Murano
restaurant is the selected organisation in present study (Rothman, 2017). This report is able to
define the use of variety of source for the collection of data both primary and secondary data.
Range of techniques and data are analysed for the business purpose. Information is produced in
an appropriate format for decision making in organisational context. Use of software generated
information subjected to decision making is defined in this context along with elaborating the
dimensions of decision making process.
TASK 1
1.1 Plan for the collection of primary and secondary data
Growth and development is the main objective of every organisation. Effective decision
making strategies and plans lead an organisational structure towards sustainable success. All the
basically the aims and objectives define vision and mission of business. Decision making process
helps to analyse the performance and strength of organisation (Levy, Weitz and Grewal, 2012).
This process basically contains critical analysis and analysis of data. As per given scenario,
Murano restaurant wants to explore its organisational chain at famous destination and location in
the UK. Managers want to get results for exploring business with the help of decision making
process. Data and information will be collected through various sources which are discussed as
below:
Primary data: These data are considered as original data which are directly collected
from the group of people, individual or first source. Information are collected form the direct
sources as a first hand. Information and data which are collected from direct resources remain
more efficient and relevant in order to make accurate decision making plans and strategies (Yang
and et. al., 2011). Organisation has to pay large amount of investment to get the information by
primary data
Secondary data: This is another source of collecting information and data. This is also
considered as a supportive source of gathering information. Secondary data approach is
considered as the cost effective approach because primary research has already been done in
1
⊘ This is a preview!⊘
Do you want full access?
Subscribe today to unlock all pages.
Trusted by 1+ million students worldwide
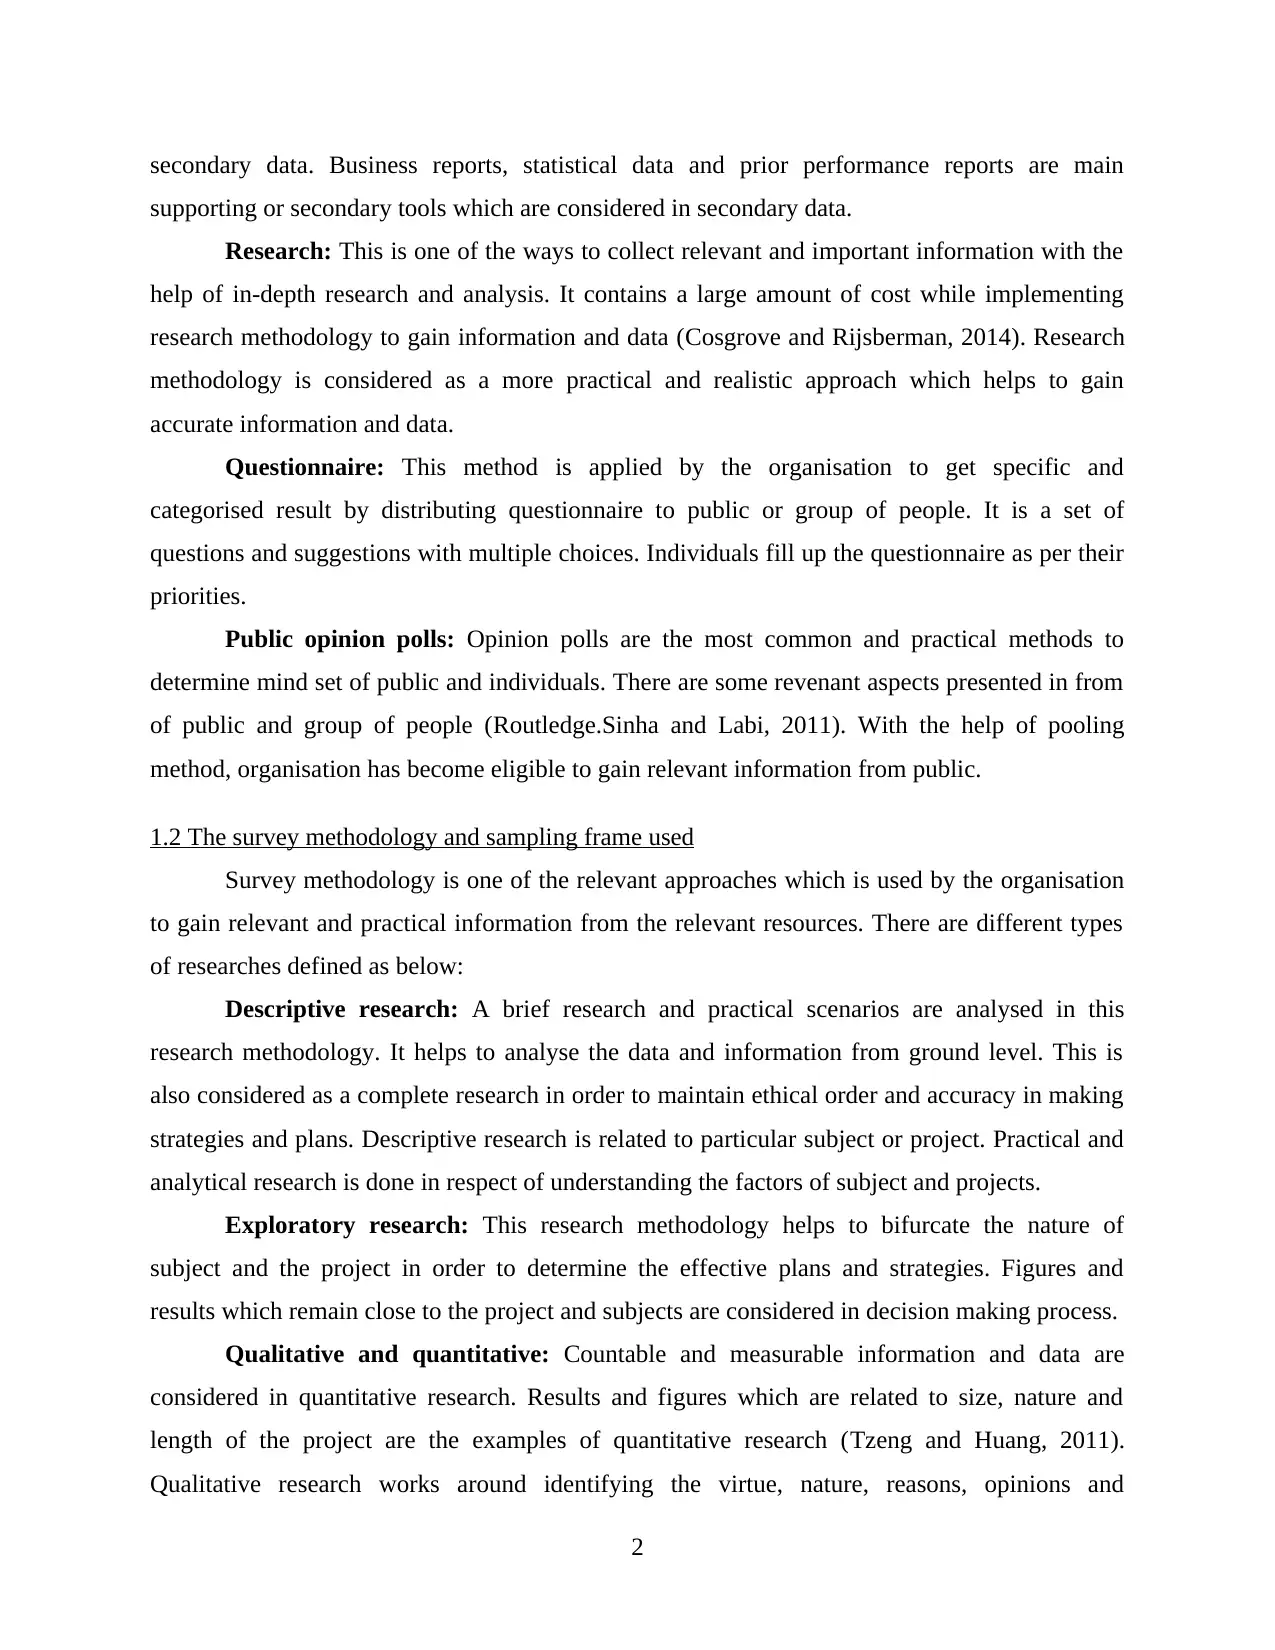
secondary data. Business reports, statistical data and prior performance reports are main
supporting or secondary tools which are considered in secondary data.
Research: This is one of the ways to collect relevant and important information with the
help of in-depth research and analysis. It contains a large amount of cost while implementing
research methodology to gain information and data (Cosgrove and Rijsberman, 2014). Research
methodology is considered as a more practical and realistic approach which helps to gain
accurate information and data.
Questionnaire: This method is applied by the organisation to get specific and
categorised result by distributing questionnaire to public or group of people. It is a set of
questions and suggestions with multiple choices. Individuals fill up the questionnaire as per their
priorities.
Public opinion polls: Opinion polls are the most common and practical methods to
determine mind set of public and individuals. There are some revenant aspects presented in from
of public and group of people (Routledge.Sinha and Labi, 2011). With the help of pooling
method, organisation has become eligible to gain relevant information from public.
1.2 The survey methodology and sampling frame used
Survey methodology is one of the relevant approaches which is used by the organisation
to gain relevant and practical information from the relevant resources. There are different types
of researches defined as below:
Descriptive research: A brief research and practical scenarios are analysed in this
research methodology. It helps to analyse the data and information from ground level. This is
also considered as a complete research in order to maintain ethical order and accuracy in making
strategies and plans. Descriptive research is related to particular subject or project. Practical and
analytical research is done in respect of understanding the factors of subject and projects.
Exploratory research: This research methodology helps to bifurcate the nature of
subject and the project in order to determine the effective plans and strategies. Figures and
results which remain close to the project and subjects are considered in decision making process.
Qualitative and quantitative: Countable and measurable information and data are
considered in quantitative research. Results and figures which are related to size, nature and
length of the project are the examples of quantitative research (Tzeng and Huang, 2011).
Qualitative research works around identifying the virtue, nature, reasons, opinions and
2
Paraphrase This Document
Need a fresh take? Get an instant paraphrase of this document with our AI Paraphraser
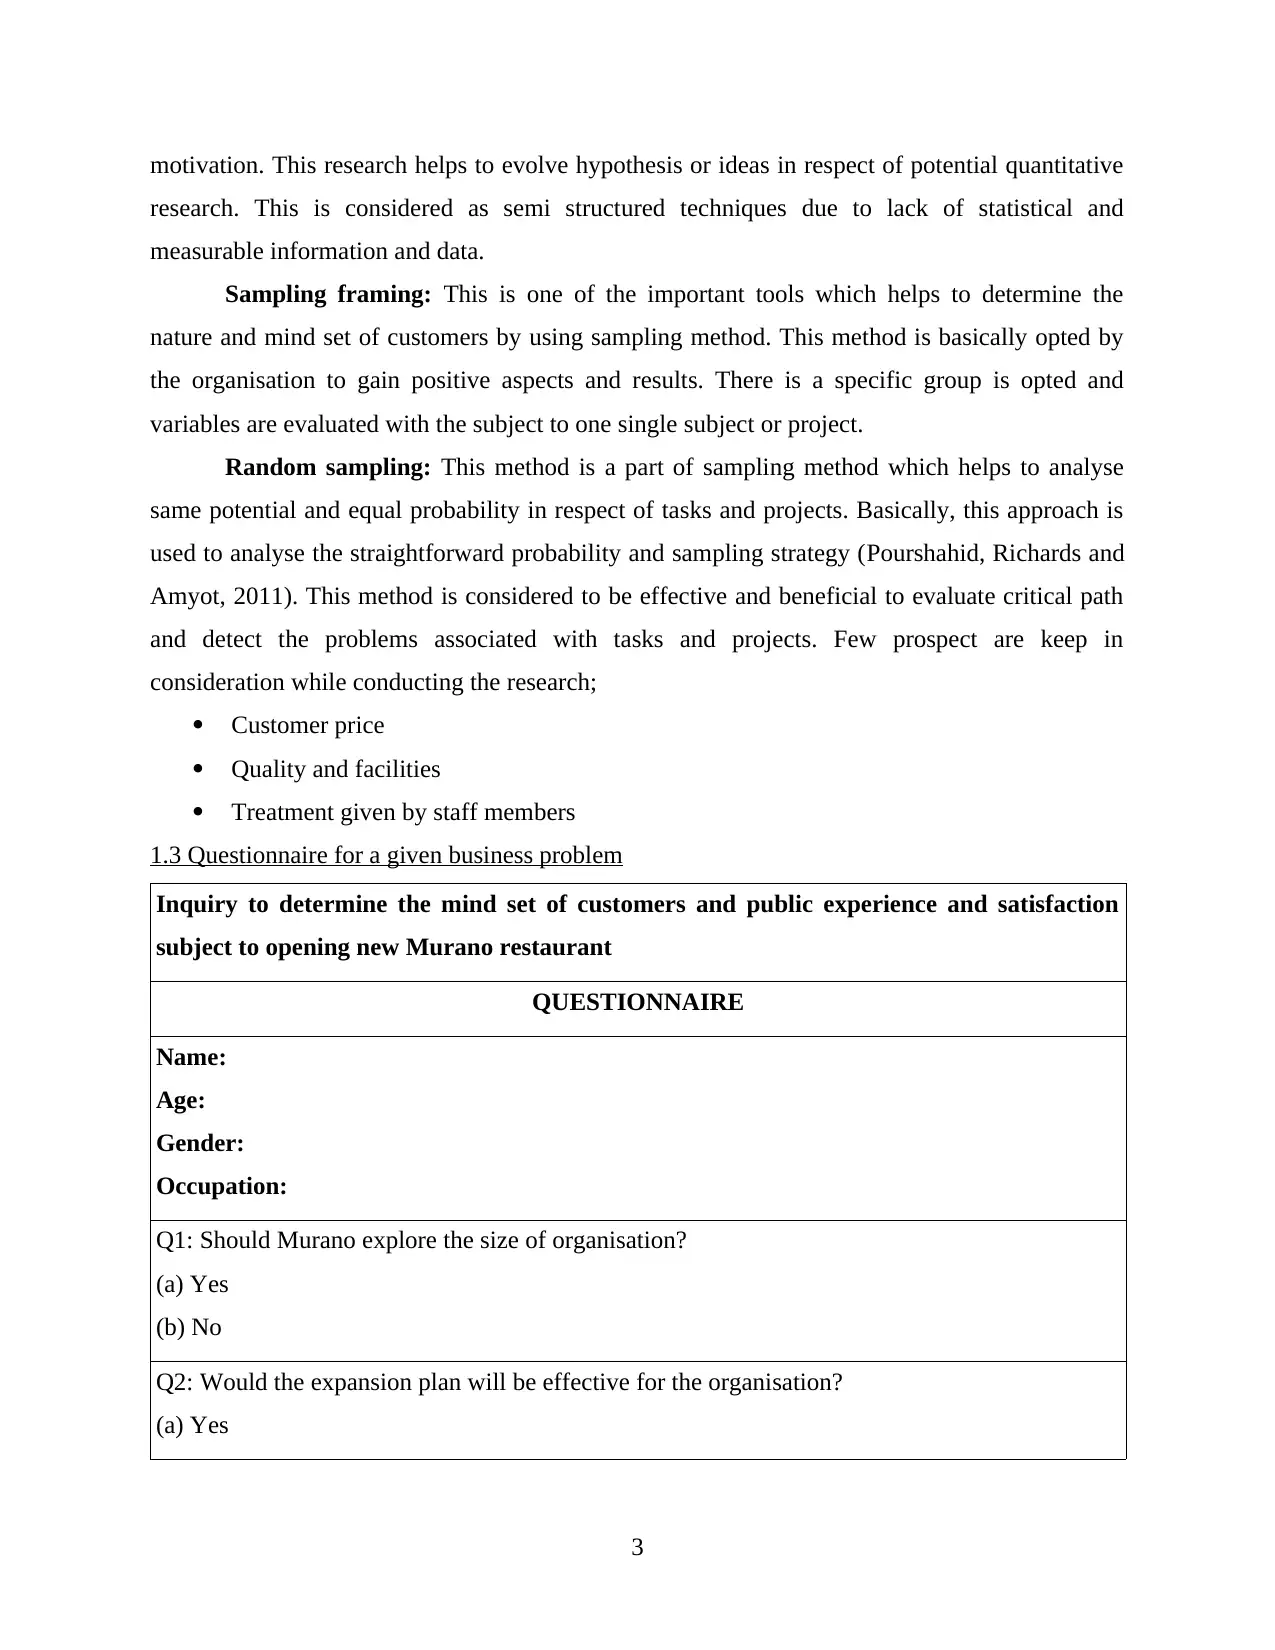
motivation. This research helps to evolve hypothesis or ideas in respect of potential quantitative
research. This is considered as semi structured techniques due to lack of statistical and
measurable information and data.
Sampling framing: This is one of the important tools which helps to determine the
nature and mind set of customers by using sampling method. This method is basically opted by
the organisation to gain positive aspects and results. There is a specific group is opted and
variables are evaluated with the subject to one single subject or project.
Random sampling: This method is a part of sampling method which helps to analyse
same potential and equal probability in respect of tasks and projects. Basically, this approach is
used to analyse the straightforward probability and sampling strategy (Pourshahid, Richards and
Amyot, 2011). This method is considered to be effective and beneficial to evaluate critical path
and detect the problems associated with tasks and projects. Few prospect are keep in
consideration while conducting the research;
Customer price
Quality and facilities
Treatment given by staff members
1.3 Questionnaire for a given business problem
Inquiry to determine the mind set of customers and public experience and satisfaction
subject to opening new Murano restaurant
QUESTIONNAIRE
Name:
Age:
Gender:
Occupation:
Q1: Should Murano explore the size of organisation?
(a) Yes
(b) No
Q2: Would the expansion plan will be effective for the organisation?
(a) Yes
3
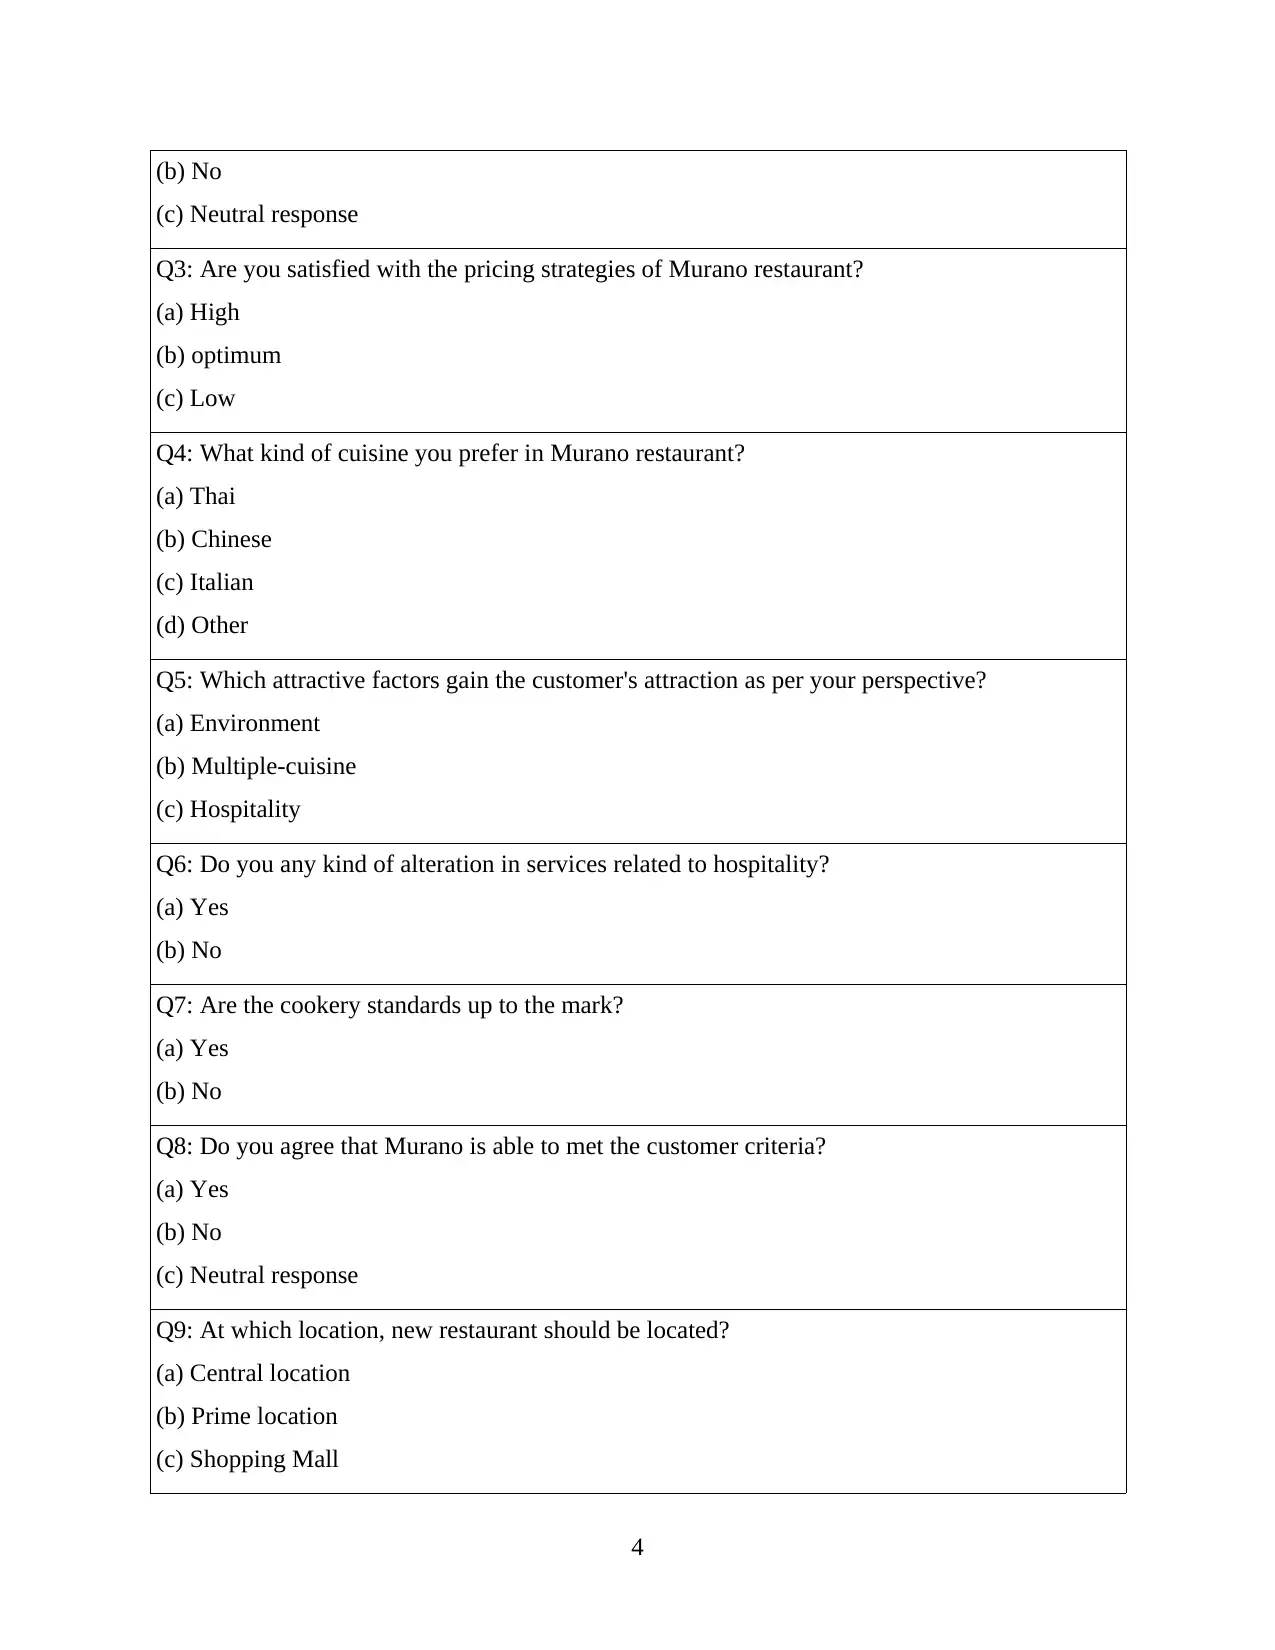
(b) No
(c) Neutral response
Q3: Are you satisfied with the pricing strategies of Murano restaurant?
(a) High
(b) optimum
(c) Low
Q4: What kind of cuisine you prefer in Murano restaurant?
(a) Thai
(b) Chinese
(c) Italian
(d) Other
Q5: Which attractive factors gain the customer's attraction as per your perspective?
(a) Environment
(b) Multiple-cuisine
(c) Hospitality
Q6: Do you any kind of alteration in services related to hospitality?
(a) Yes
(b) No
Q7: Are the cookery standards up to the mark?
(a) Yes
(b) No
Q8: Do you agree that Murano is able to met the customer criteria?
(a) Yes
(b) No
(c) Neutral response
Q9: At which location, new restaurant should be located?
(a) Central location
(b) Prime location
(c) Shopping Mall
4
(c) Neutral response
Q3: Are you satisfied with the pricing strategies of Murano restaurant?
(a) High
(b) optimum
(c) Low
Q4: What kind of cuisine you prefer in Murano restaurant?
(a) Thai
(b) Chinese
(c) Italian
(d) Other
Q5: Which attractive factors gain the customer's attraction as per your perspective?
(a) Environment
(b) Multiple-cuisine
(c) Hospitality
Q6: Do you any kind of alteration in services related to hospitality?
(a) Yes
(b) No
Q7: Are the cookery standards up to the mark?
(a) Yes
(b) No
Q8: Do you agree that Murano is able to met the customer criteria?
(a) Yes
(b) No
(c) Neutral response
Q9: At which location, new restaurant should be located?
(a) Central location
(b) Prime location
(c) Shopping Mall
4
⊘ This is a preview!⊘
Do you want full access?
Subscribe today to unlock all pages.
Trusted by 1+ million students worldwide
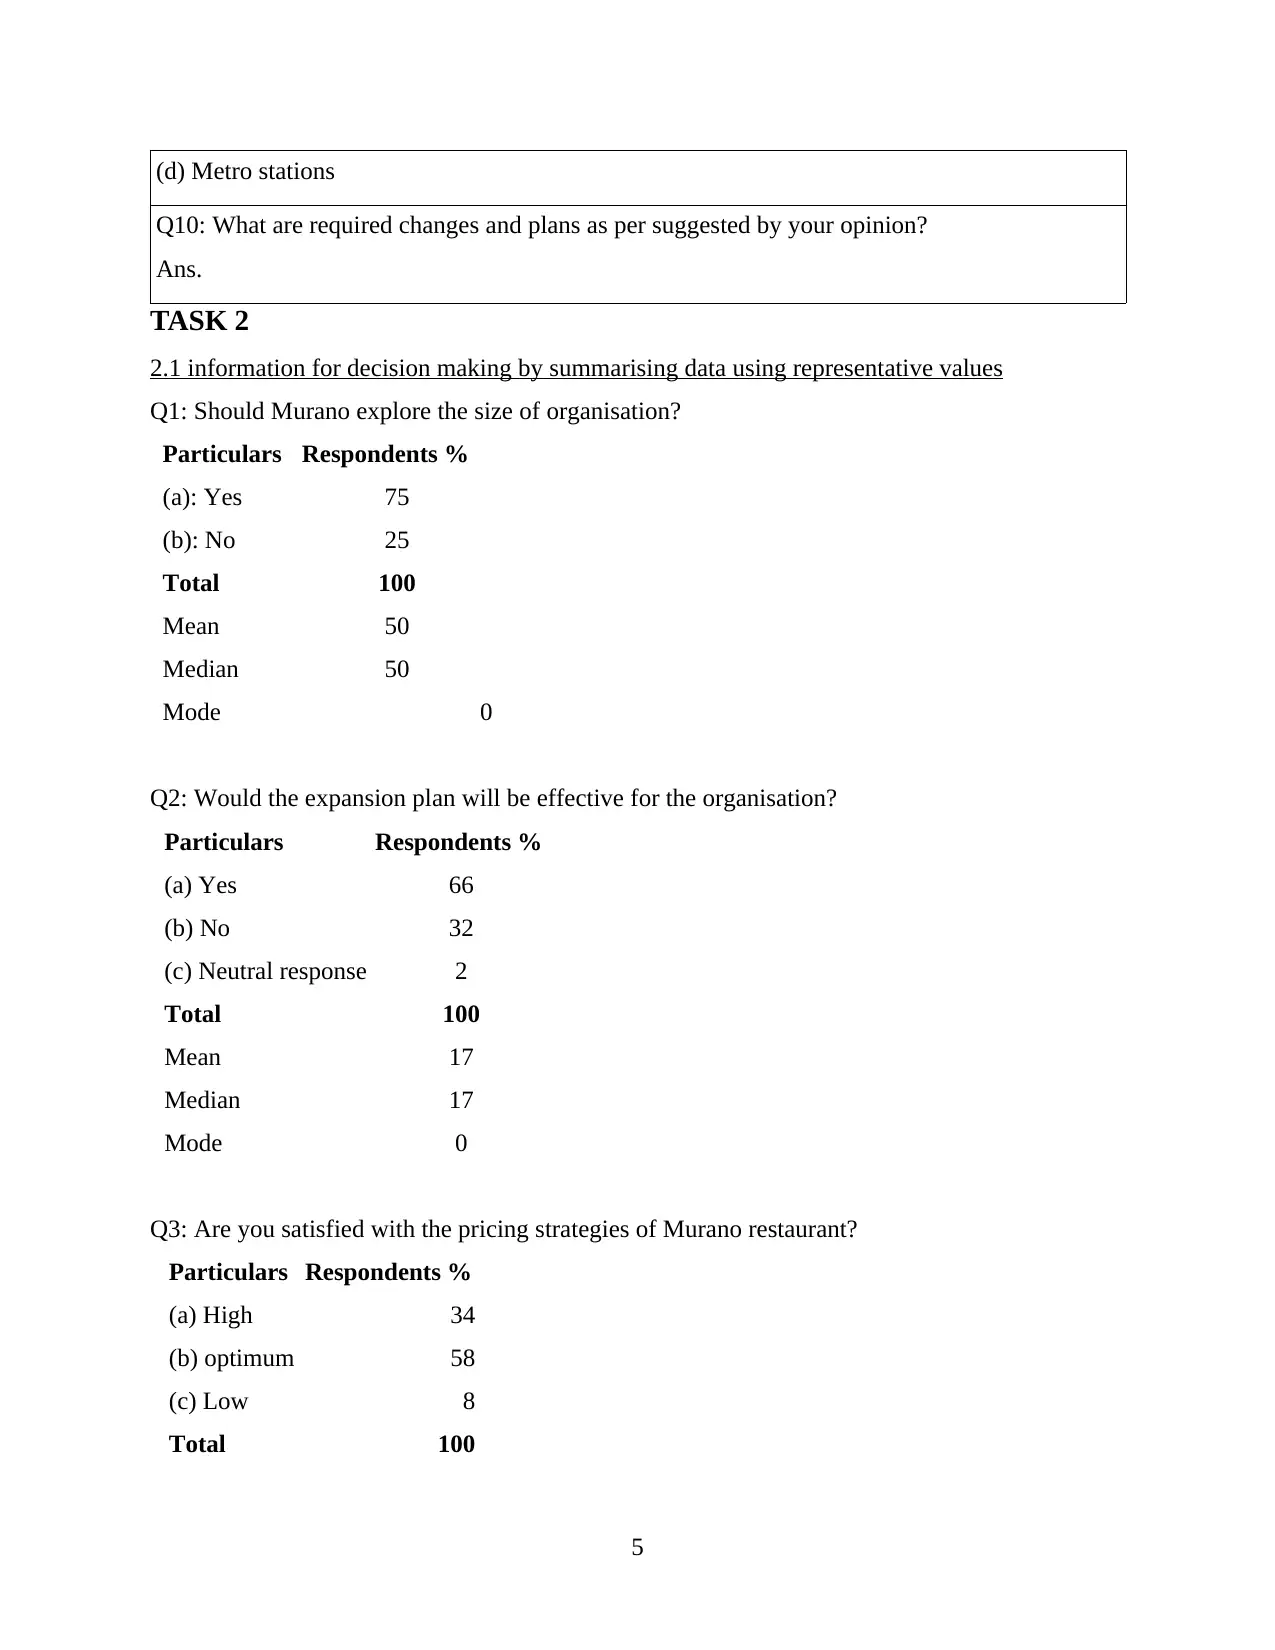
(d) Metro stations
Q10: What are required changes and plans as per suggested by your opinion?
Ans.
TASK 2
2.1 information for decision making by summarising data using representative values
Q1: Should Murano explore the size of organisation?
Particulars Respondents %
(a): Yes 75
(b): No 25
Total 100
Mean 50
Median 50
Mode 0
Q2: Would the expansion plan will be effective for the organisation?
Particulars Respondents %
(a) Yes 66
(b) No 32
(c) Neutral response 2
Total 100
Mean 17
Median 17
Mode 0
Q3: Are you satisfied with the pricing strategies of Murano restaurant?
Particulars Respondents %
(a) High 34
(b) optimum 58
(c) Low 8
Total 100
5
Paraphrase This Document
Need a fresh take? Get an instant paraphrase of this document with our AI Paraphraser
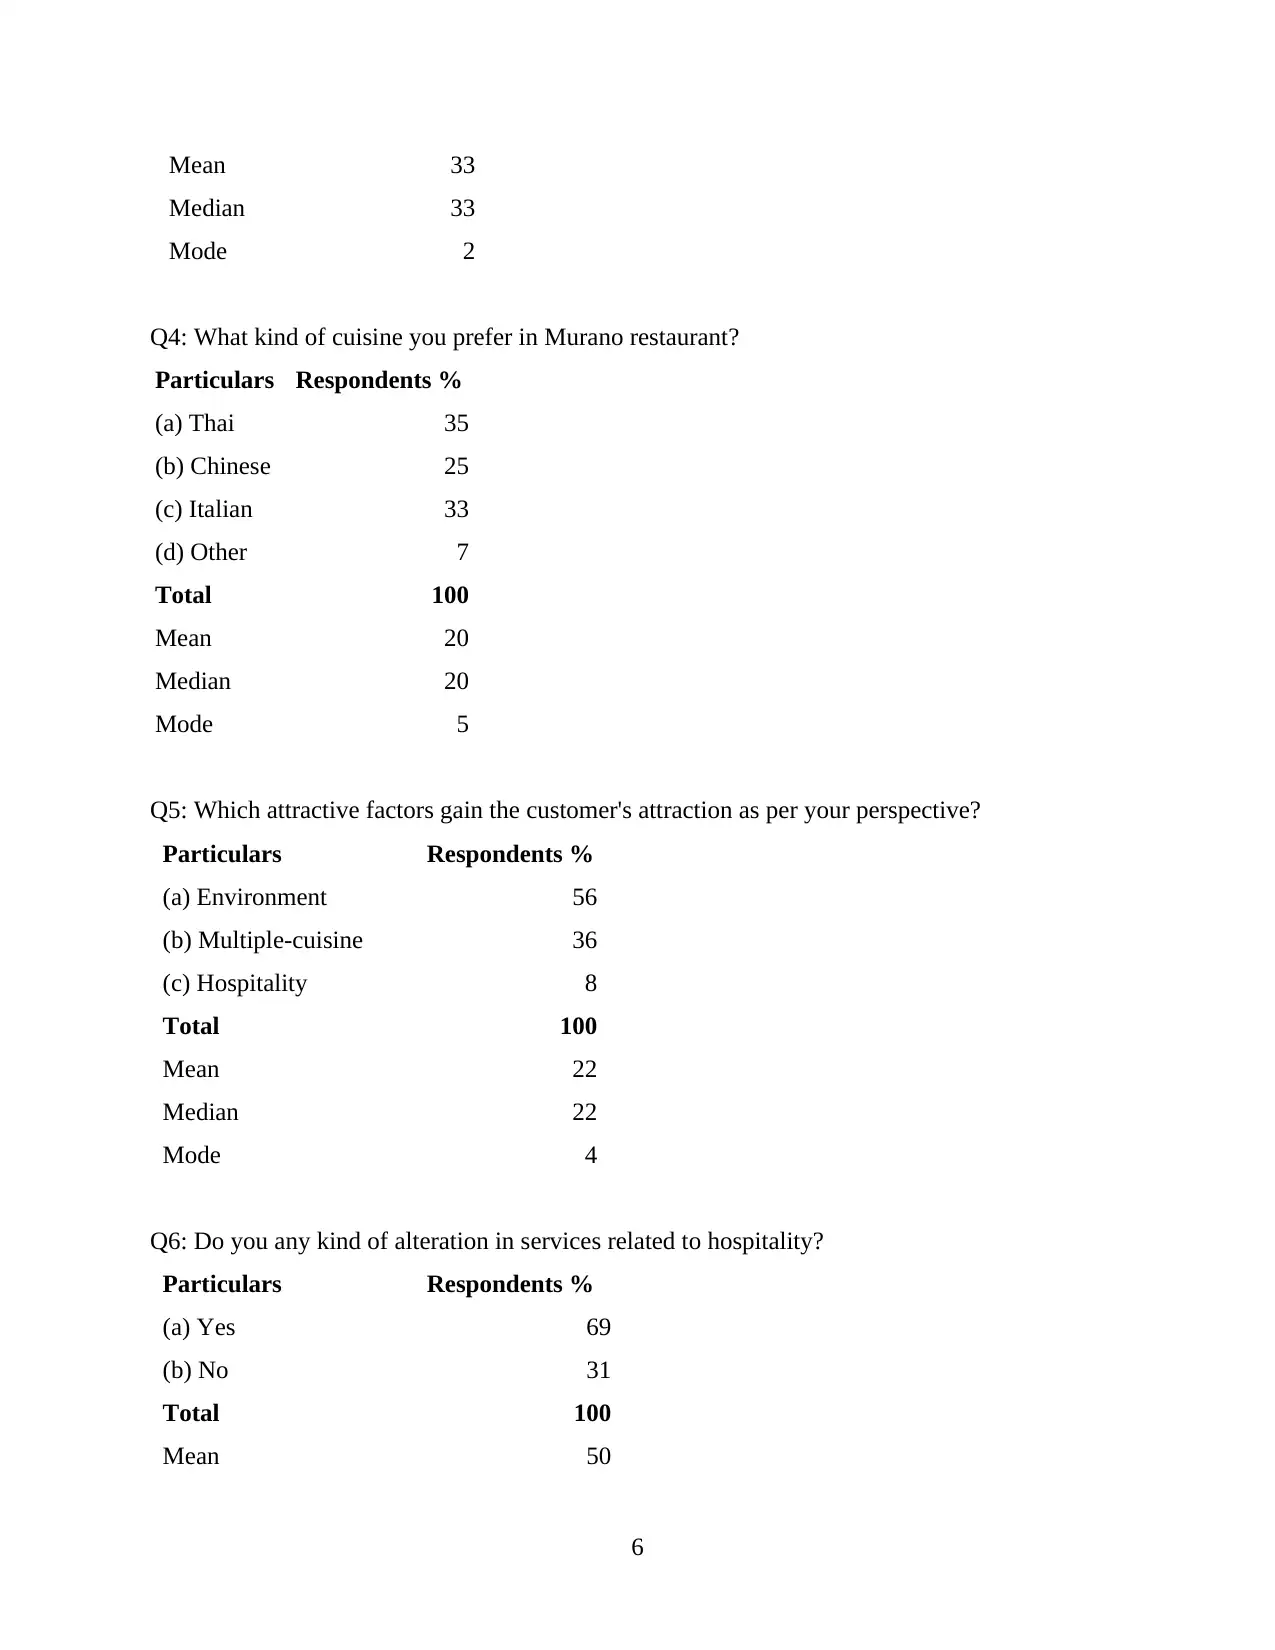
Mean 33
Median 33
Mode 2
Q4: What kind of cuisine you prefer in Murano restaurant?
Particulars Respondents %
(a) Thai 35
(b) Chinese 25
(c) Italian 33
(d) Other 7
Total 100
Mean 20
Median 20
Mode 5
Q5: Which attractive factors gain the customer's attraction as per your perspective?
Particulars Respondents %
(a) Environment 56
(b) Multiple-cuisine 36
(c) Hospitality 8
Total 100
Mean 22
Median 22
Mode 4
Q6: Do you any kind of alteration in services related to hospitality?
Particulars Respondents %
(a) Yes 69
(b) No 31
Total 100
Mean 50
6
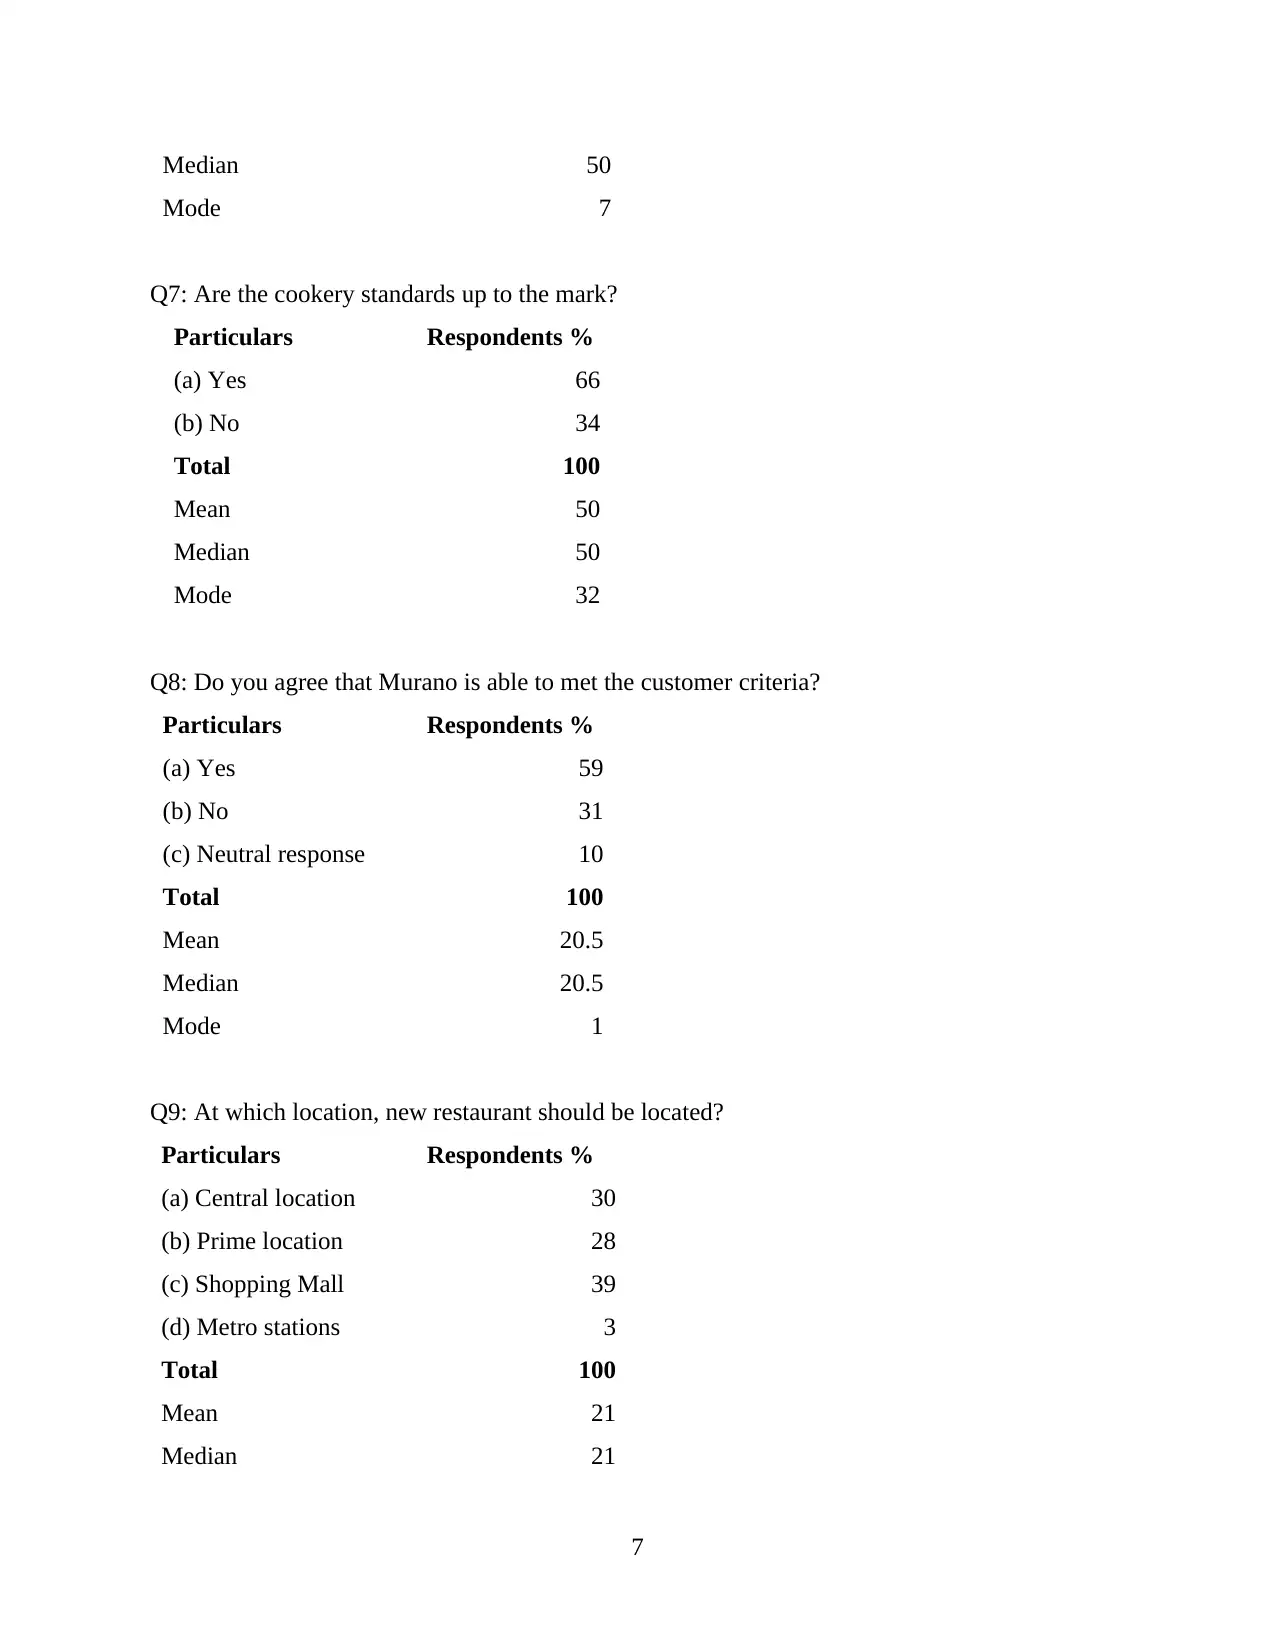
Median 50
Mode 7
Q7: Are the cookery standards up to the mark?
Particulars Respondents %
(a) Yes 66
(b) No 34
Total 100
Mean 50
Median 50
Mode 32
Q8: Do you agree that Murano is able to met the customer criteria?
Particulars Respondents %
(a) Yes 59
(b) No 31
(c) Neutral response 10
Total 100
Mean 20.5
Median 20.5
Mode 1
Q9: At which location, new restaurant should be located?
Particulars Respondents %
(a) Central location 30
(b) Prime location 28
(c) Shopping Mall 39
(d) Metro stations 3
Total 100
Mean 21
Median 21
7
⊘ This is a preview!⊘
Do you want full access?
Subscribe today to unlock all pages.
Trusted by 1+ million students worldwide
Mode 0
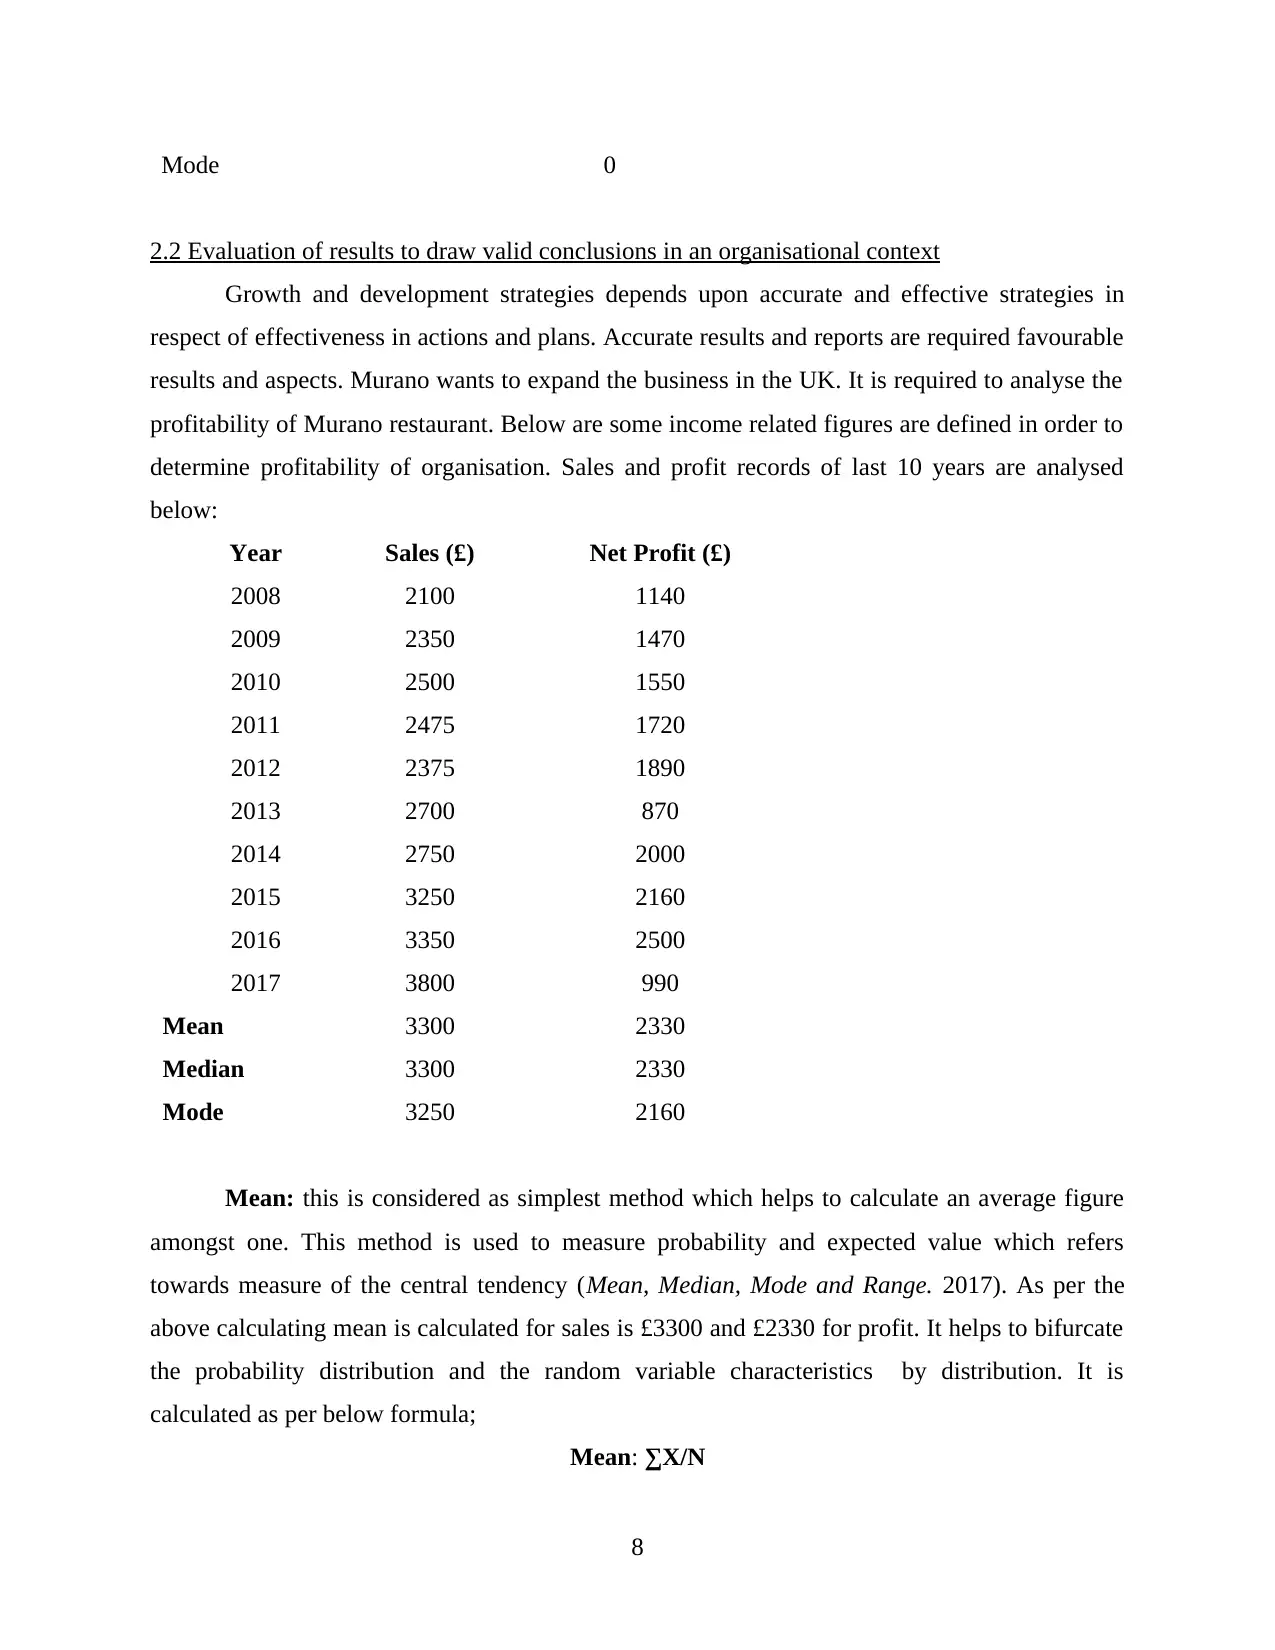
2.2 Evaluation of results to draw valid conclusions in an organisational context
Growth and development strategies depends upon accurate and effective strategies in
respect of effectiveness in actions and plans. Accurate results and reports are required favourable
results and aspects. Murano wants to expand the business in the UK. It is required to analyse the
profitability of Murano restaurant. Below are some income related figures are defined in order to
determine profitability of organisation. Sales and profit records of last 10 years are analysed
below:
Year Sales (£) Net Profit (£)
2008 2100 1140
2009 2350 1470
2010 2500 1550
2011 2475 1720
2012 2375 1890
2013 2700 870
2014 2750 2000
2015 3250 2160
2016 3350 2500
2017 3800 990
Mean 3300 2330
Median 3300 2330
Mode 3250 2160
Mean: this is considered as simplest method which helps to calculate an average figure
amongst one. This method is used to measure probability and expected value which refers
towards measure of the central tendency (Mean, Median, Mode and Range. 2017). As per the
above calculating mean is calculated for sales is £3300 and £2330 for profit. It helps to bifurcate
the probability distribution and the random variable characteristics by distribution. It is
calculated as per below formula;
Mean: ∑X/N
8
Paraphrase This Document
Need a fresh take? Get an instant paraphrase of this document with our AI Paraphraser
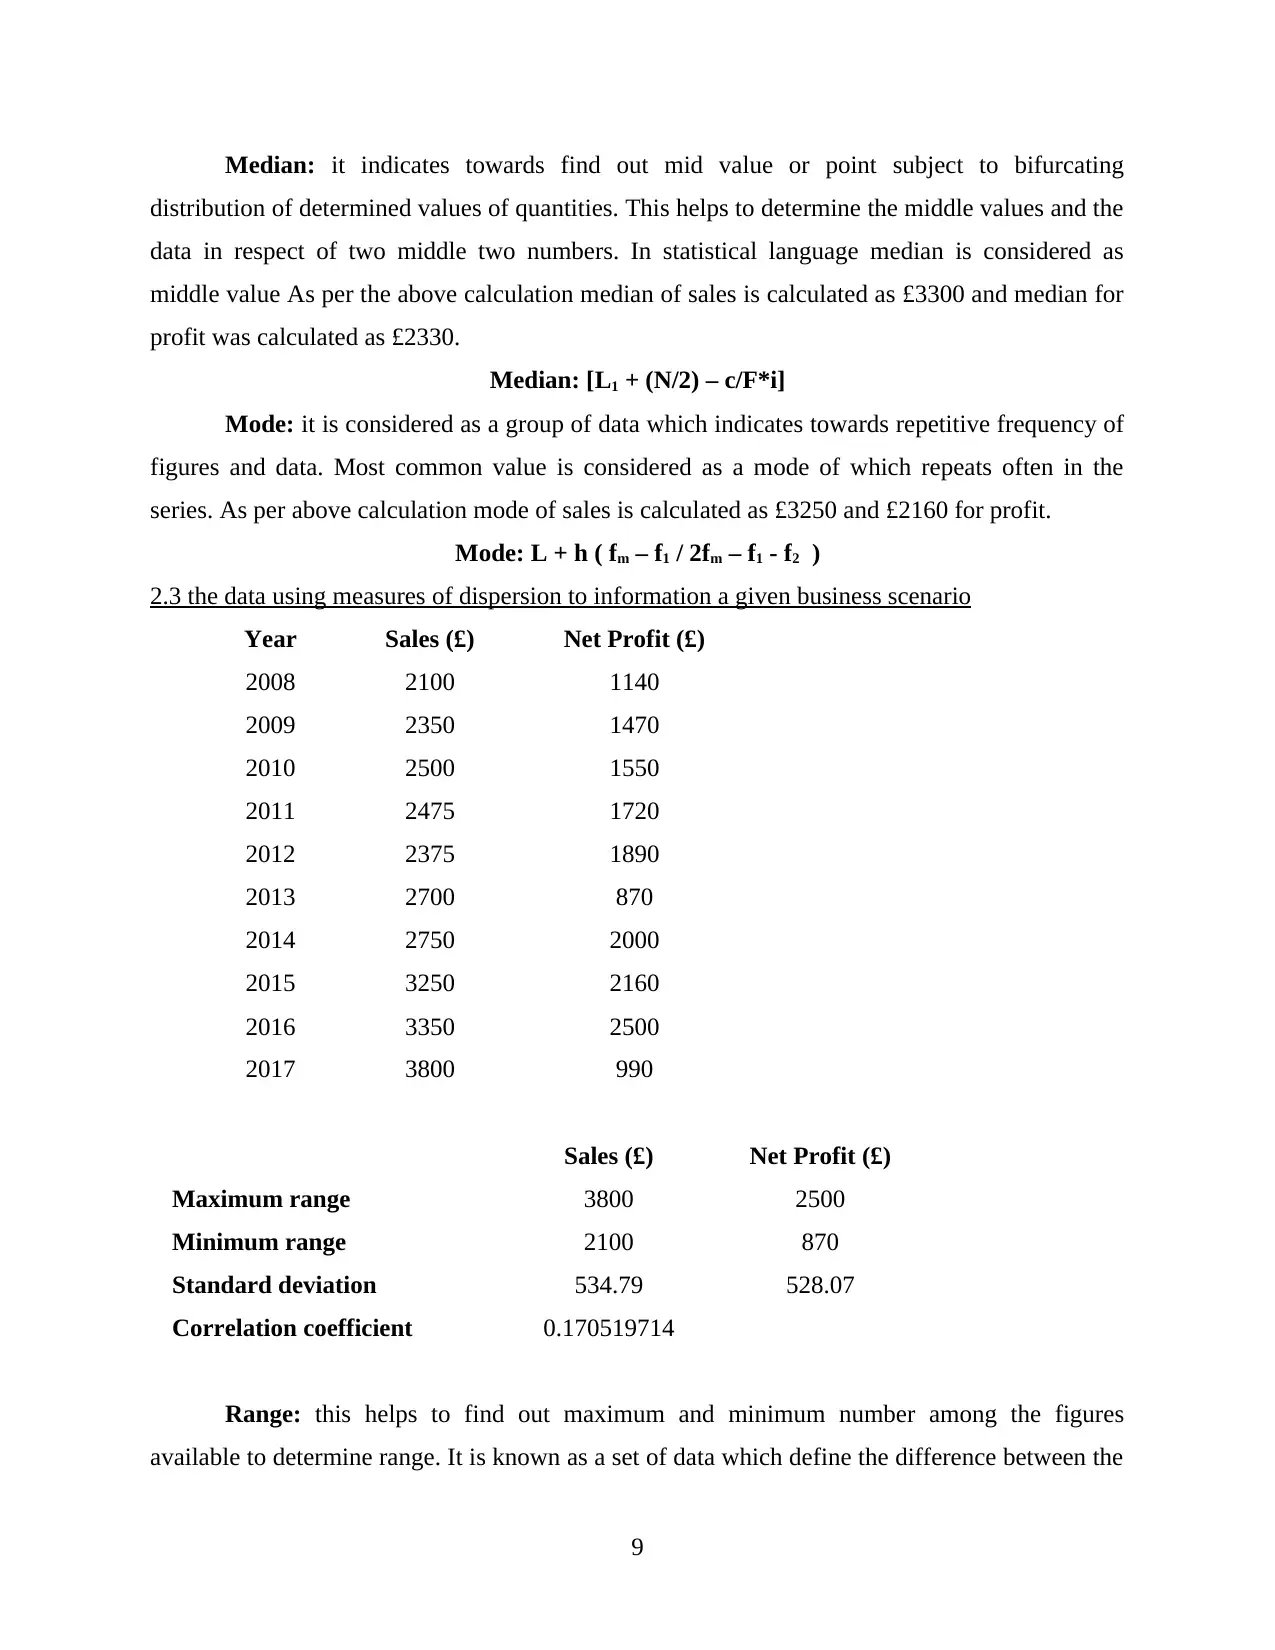
Median: it indicates towards find out mid value or point subject to bifurcating
distribution of determined values of quantities. This helps to determine the middle values and the
data in respect of two middle two numbers. In statistical language median is considered as
middle value As per the above calculation median of sales is calculated as £3300 and median for
profit was calculated as £2330.
Median: [L1 + (N/2) – c/F*i]
Mode: it is considered as a group of data which indicates towards repetitive frequency of
figures and data. Most common value is considered as a mode of which repeats often in the
series. As per above calculation mode of sales is calculated as £3250 and £2160 for profit.
Mode: L + h ( fm – f1 / 2fm – f1 - f2 )
2.3 the data using measures of dispersion to information a given business scenario
Year Sales (£) Net Profit (£)
2008 2100 1140
2009 2350 1470
2010 2500 1550
2011 2475 1720
2012 2375 1890
2013 2700 870
2014 2750 2000
2015 3250 2160
2016 3350 2500
2017 3800 990
Sales (£) Net Profit (£)
Maximum range 3800 2500
Minimum range 2100 870
Standard deviation 534.79 528.07
Correlation coefficient 0.170519714
Range: this helps to find out maximum and minimum number among the figures
available to determine range. It is known as a set of data which define the difference between the
9
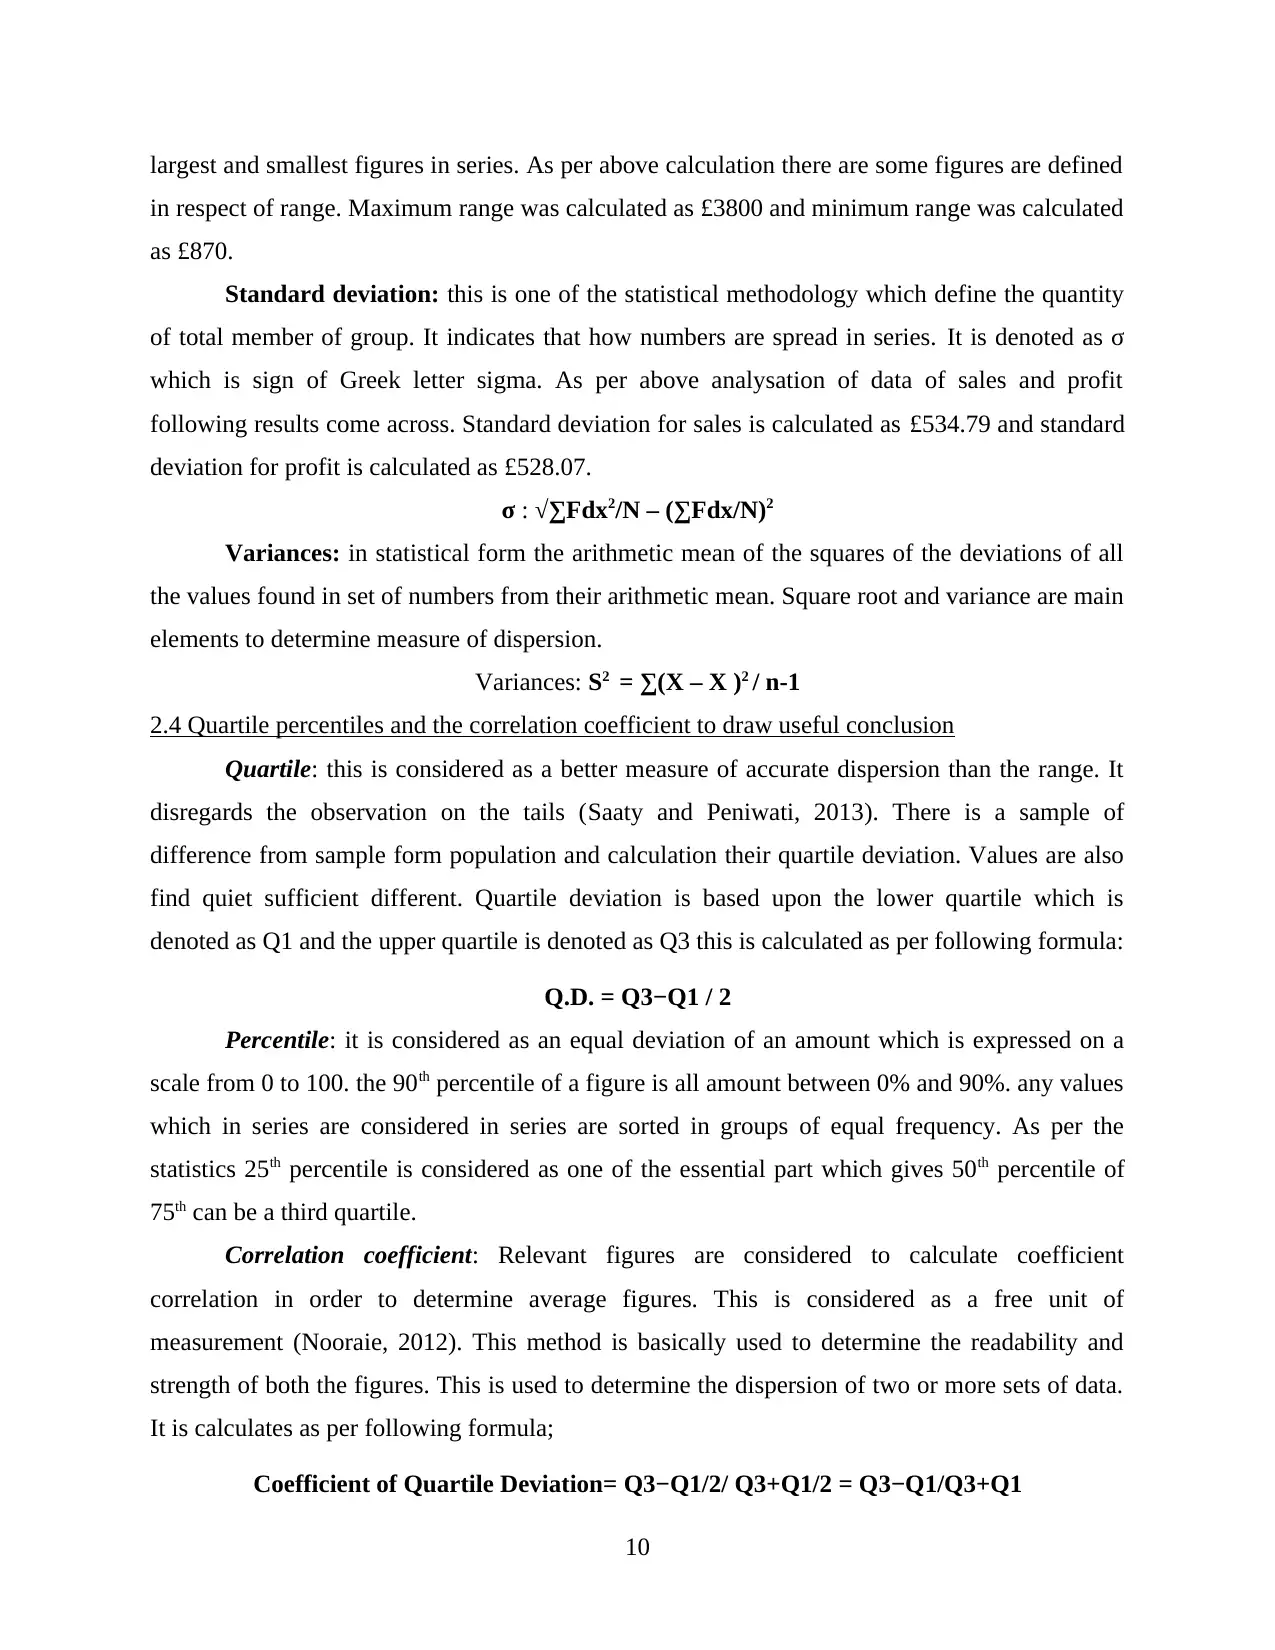
largest and smallest figures in series. As per above calculation there are some figures are defined
in respect of range. Maximum range was calculated as £3800 and minimum range was calculated
as £870.
Standard deviation: this is one of the statistical methodology which define the quantity
of total member of group. It indicates that how numbers are spread in series. It is denoted as σ
which is sign of Greek letter sigma. As per above analysation of data of sales and profit
following results come across. Standard deviation for sales is calculated as £534.79 and standard
deviation for profit is calculated as £528.07.
σ : √∑Fdx2/N – (∑Fdx/N)2
Variances: in statistical form the arithmetic mean of the squares of the deviations of all
the values found in set of numbers from their arithmetic mean. Square root and variance are main
elements to determine measure of dispersion.
Variances: S2 = ∑(X – X )2 / n-1
2.4 Quartile percentiles and the correlation coefficient to draw useful conclusion
Quartile: this is considered as a better measure of accurate dispersion than the range. It
disregards the observation on the tails (Saaty and Peniwati, 2013). There is a sample of
difference from sample form population and calculation their quartile deviation. Values are also
find quiet sufficient different. Quartile deviation is based upon the lower quartile which is
denoted as Q1 and the upper quartile is denoted as Q3 this is calculated as per following formula:
Q.D. = Q3−Q1 / 2
Percentile: it is considered as an equal deviation of an amount which is expressed on a
scale from 0 to 100. the 90th percentile of a figure is all amount between 0% and 90%. any values
which in series are considered in series are sorted in groups of equal frequency. As per the
statistics 25th percentile is considered as one of the essential part which gives 50th percentile of
75th can be a third quartile.
Correlation coefficient: Relevant figures are considered to calculate coefficient
correlation in order to determine average figures. This is considered as a free unit of
measurement (Nooraie, 2012). This method is basically used to determine the readability and
strength of both the figures. This is used to determine the dispersion of two or more sets of data.
It is calculates as per following formula;
Coefficient of Quartile Deviation= Q3−Q1/2/ Q3+Q1/2 = Q3−Q1/Q3+Q1
10
⊘ This is a preview!⊘
Do you want full access?
Subscribe today to unlock all pages.
Trusted by 1+ million students worldwide
1 out of 22
Related Documents


Your All-in-One AI-Powered Toolkit for Academic Success.
+13062052269
info@desklib.com
Available 24*7 on WhatsApp / Email
![[object Object]](/_next/static/media/star-bottom.7253800d.svg)
Unlock your academic potential
Copyright © 2020–2026 A2Z Services. All Rights Reserved. Developed and managed by ZUCOL.