Business Report: Data Analysis and Decision Making for Balti Palace
VerifiedAdded on 2020/06/04
|27
|4210
|484
Report
AI Summary
This report analyzes the business decision-making process for Balti Palace restaurant, focusing on the potential opening of a second unit in London. The report begins with an introduction to the increasing tourism in London and its impact on the restaurant industry. It outlines the methodology for collecting primary and secondary data, including survey design and sampling techniques. The report then presents the data analysis, summarizing findings on customer preferences, such as the importance of food taste and European cuisine. Statistical tools like descriptive statistics, measures of dispersion, quartile, percentile, and correlation coefficients are used to analyze sales and profit data. The report also includes graphical representations of the data and discusses the use of information processing tools for decision-making, project planning, and investment appraisal techniques. The conclusion summarizes the key findings and recommendations for Balti Palace's expansion strategy.

Business Decision Making
Paraphrase This Document
Need a fresh take? Get an instant paraphrase of this document with our AI Paraphraser
TABLE OF CONTENTS
INTRODUCTION......................................................................................................................3
1.1 Planning for the collection of primary and secondary data..............................................3
1.2 Designing survey methodology and sampling frame used..............................................4
1.3 Preparing questionnaire for survey..................................................................................5
TASK 2......................................................................................................................................7
2.1 Summarization of data using representative values.........................................................7
2.2 Analyzing results for drawing valid conclusion...............................................................9
2.3 Measures of dispersion...................................................................................................10
2.4 Computation of quartile, percentile and correlation co-efficient...................................10
3.1 Presentation of data set graphically................................................................................12
3.2 Creating trend line for forecasting future aspects..........................................................14
3.3 Dissemination of information using power point...........................................................14
3.4 Business report...............................................................................................................14
TASK 3....................................................................................................................................15
4.1 Use of appropriate information processing tools for decision making..........................15
4.2 Preparing project plan for an activity and determining critical path..............................16
4.3 Decision making using investment appraisal techniques...............................................17
CONCLUSION........................................................................................................................18
REFERENCES.........................................................................................................................20
INTRODUCTION
In the recent times, tourism is increasing with the very high pace in London, which in
turn recognized as dynamic city of the world. Each year, several visitors, including both
inbound and outbound, visit London for several purposes commerce or business, studies, fun
etc. London is known for the combination of both amazing culture and commerce activities.
Hence, such tourism trend significantly contributes in the growth of firms operating in travel
and tourism sector. Considering such trend, business entity of Balti Palace is planning to open
second restaurant unit in London. In this regard, report will depict the manner in which
primary and secondary can be gathered for assessing the expectation level of both existing as
well as potential customers. Besides this, report will also provide deeper insight about how
statistical, information processing, project management and investment appraisal tools
facilitates quick decision making and thereby aid in profitability.
1.1 Planning for the collection of primary and secondary data
Now, research activity has gained high level of importance in every field or plan
whether it’s related to expansion or new offerings. R&D helps in gathering information about
target market and thereby assists in developing competent as well as strategic framework
(Ward and Peppard, 2016). By keeping in mind the significance of research, business entity
of Balti Palace, who is planning to establish second restaurant in London, contacted to
researcher for the collection of primary and secondary data. Hence, plan that will be followed
by the researcher for gathering primary and secondary data is enumerated below.
Primary data collection plan: Data that is specifically gathered by the scholar
specifically for meeting research objectives via survey, observation, focus group, interview
etc known as primary. Hence, following plan will be considered by the researcher for primary
data collection such as:
In the first step, data collection technique has been selected by the researcher such as
survey. The reason behind making selection of such technique is that it helps in
collecting information as per the issue.
At this stage, using non-probabilistic technique, such as purposive 30 customers of
restaurant units have been selected. Hence, survey will be focused on such
respondents rather than whole population.
⊘ This is a preview!⊘
Do you want full access?
Subscribe today to unlock all pages.
Trusted by 1+ million students worldwide
In the third stage, researcher will design questionnaire by including both open and
close ended questions into it regarding services, pricing strategies, promotional
aspects as well as preferences pertaining to location.
In the last stage, by sending questionnaires on the respondent’s mail-id data survey
will be conducted or completed.
Thus, by following the above mentioned process primary data will be collected by the
scholar in a prominent way.
Secondary data collection plan: To analyze the trend of restaurant sector and tourism
level in the different areas of London, articles as well as governmental reports will be
evaluated by the researcher. This in turn gives input regarding location aspects, restaurant
styles etc. Besides this, other secondary sources such as books, journals and scholarly articles
will also be evaluated by the researcher to assess the factors that have impact on customer
decision making. Hence, for the collection of secondary data, internet surfing will be done,
that contains wide collection pertaining to books, journals and articles.
1.2 Designing survey methodology and sampling frame used
Survey methodology: For conducing survey in the best possible way there is a
requirement to prepare appropriate plan. Hence, survey methodology entails the way that
needs to be followed for collecting data from the selected respondents (Varmuza and
Filzmoser, 2016). Thus, referring the availability of limited time frame, online survey
technique has been chosen by the researcher. Hence, for conducting survey in accordance
with online methodology researcher will primarily acquire the mail-id of individuals who
selected as sample. Once mail-id of the respondents have acquired, thereafter by sending
questionnaire on the same responses will be gathered. Hence, by undertaking the above
mentioned tool and process survey will be initiated.
Sampling frame: In research, sample selection is vital due to having limited resources
such as time and finance. Thus, focus needs to be placed on sample selection from concerned
population by taking into account either probabilistic or non-probabilistic techniques
(Albright, Winston and Zappe, 2010). Hence, in this, using purposive sampling technique,
part of non-probabilistic, 30 respondents have been selected by the researcher. Hence, by
taking views from 30 customers of Balti Palace suitable information can be gathered for the
purpose of decision making.
Paraphrase This Document
Need a fresh take? Get an instant paraphrase of this document with our AI Paraphraser
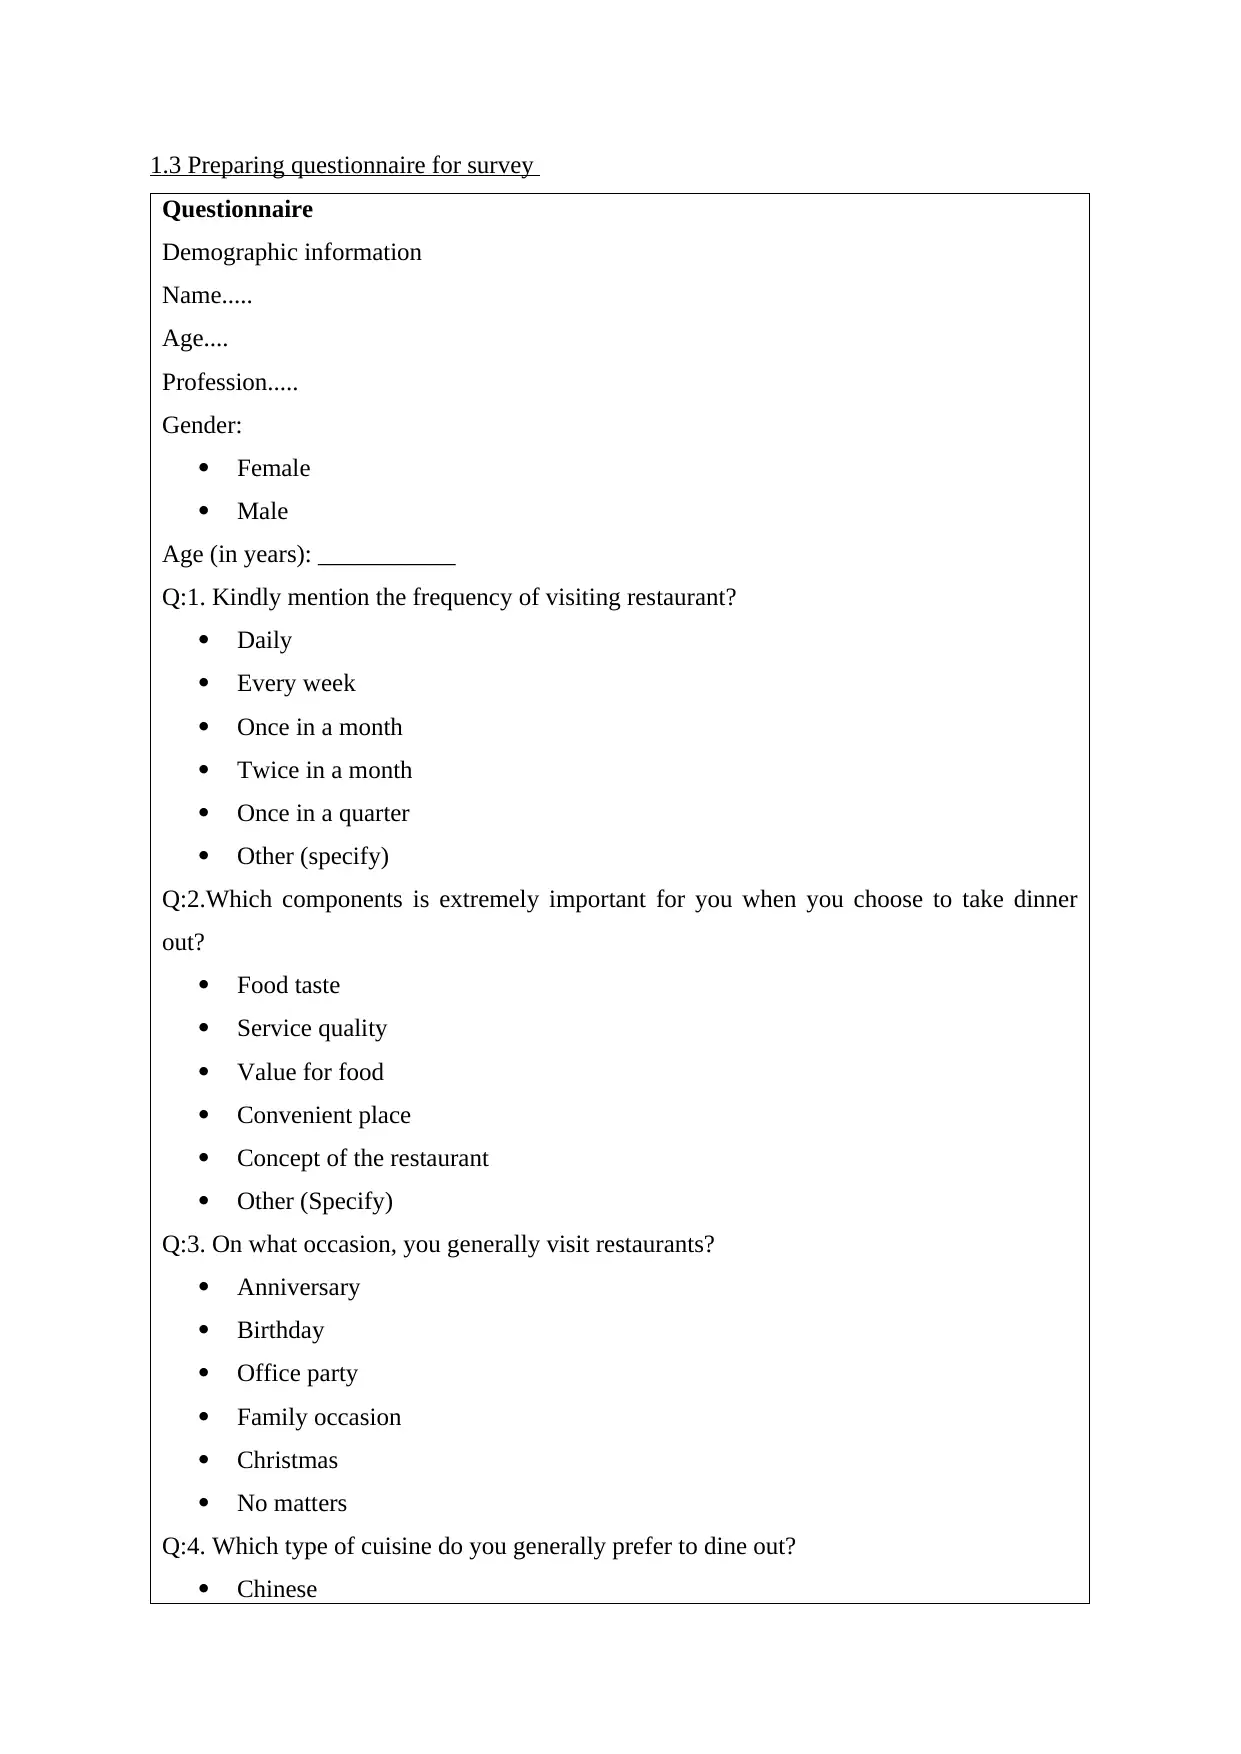
1.3 Preparing questionnaire for survey
Questionnaire
Demographic information
Name.....
Age....
Profession.....
Gender:
Female
Male
Age (in years): ___________
Q:1. Kindly mention the frequency of visiting restaurant?
Daily
Every week
Once in a month
Twice in a month
Once in a quarter
Other (specify)
Q:2.Which components is extremely important for you when you choose to take dinner
out?
Food taste
Service quality
Value for food
Convenient place
Concept of the restaurant
Other (Specify)
Q:3. On what occasion, you generally visit restaurants?
Anniversary
Birthday
Office party
Family occasion
Christmas
No matters
Q:4. Which type of cuisine do you generally prefer to dine out?
Chinese
European
Mexican
Italian
American
Mexican
Indian
Other (Specify)
Q:5. How well staff at Balti Palace serves you?
Extremely well
Quite well
Poor services
Terrible
Q:6. What time, do you usually go restaurant?
Breakfast time
Lunch time
Dinner time
Doesn’t matter
Q:7. How much amount do you spend per visit to Balti Palace?
Below £80
£80-£120
£120 - £150
More than £150
Q:8. Does the source of ingredients impacts your buying decisions?
Yes
No
Sometimes
Q:9. Does proper cleanliness are maintained by the staff at Balti Palace?
Yes
No
Sometimes
Q:10 Give some suggestion to us to serve you better?
_____________________________________________________________________
Mexican
Italian
American
Mexican
Indian
Other (Specify)
Q:5. How well staff at Balti Palace serves you?
Extremely well
Quite well
Poor services
Terrible
Q:6. What time, do you usually go restaurant?
Breakfast time
Lunch time
Dinner time
Doesn’t matter
Q:7. How much amount do you spend per visit to Balti Palace?
Below £80
£80-£120
£120 - £150
More than £150
Q:8. Does the source of ingredients impacts your buying decisions?
Yes
No
Sometimes
Q:9. Does proper cleanliness are maintained by the staff at Balti Palace?
Yes
No
Sometimes
Q:10 Give some suggestion to us to serve you better?
_____________________________________________________________________
⊘ This is a preview!⊘
Do you want full access?
Subscribe today to unlock all pages.
Trusted by 1+ million students worldwide
TASK 2
2.1 Summarization of data using representative values
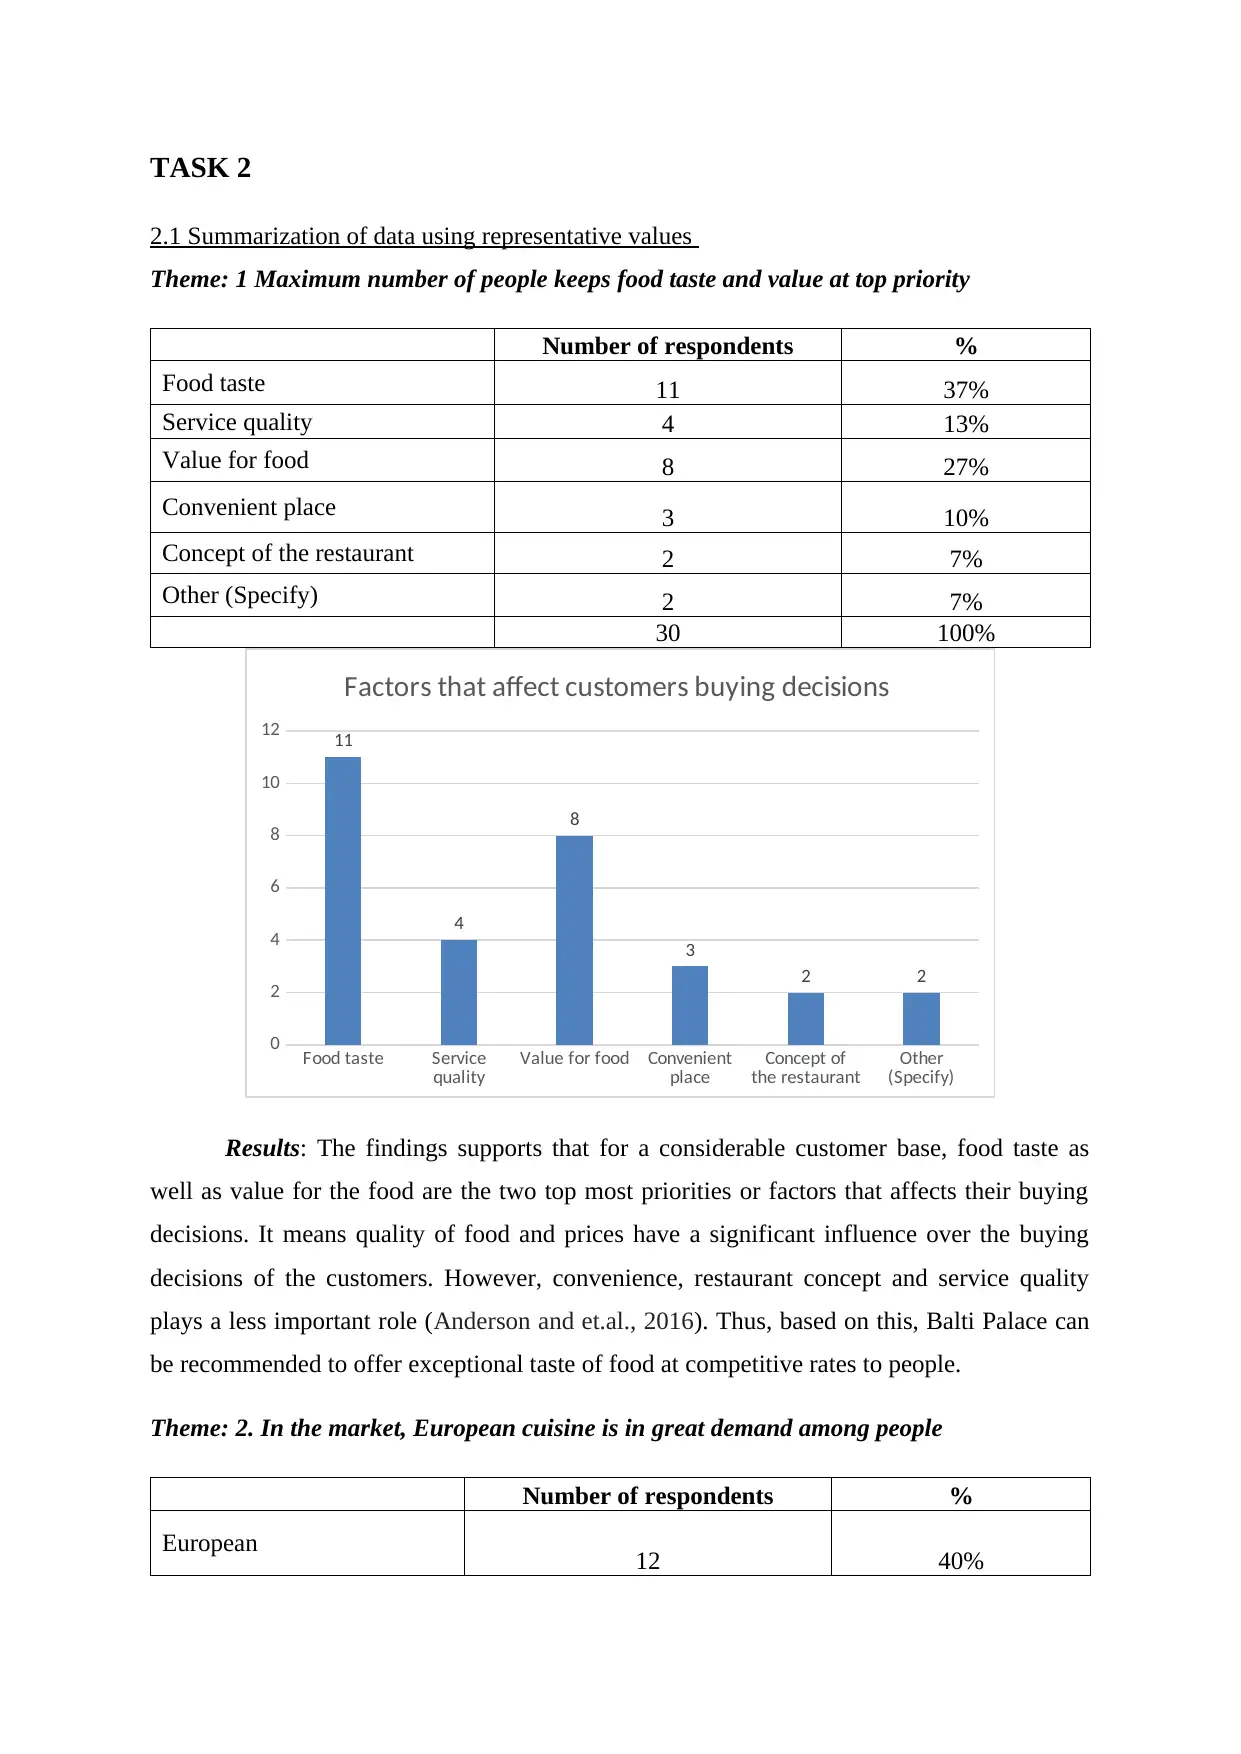
Theme: 1 Maximum number of people keeps food taste and value at top priority
Number of respondents %
Food taste 11 37%
Service quality 4 13%
Value for food 8 27%
Convenient place 3 10%
Concept of the restaurant 2 7%
Other (Specify) 2 7%
30 100%
Food taste Service
quality Value for food Convenient
place Concept of
the restaurant Other
(Specify)
0
2
4
6
8
10
12 11
4
8
3
2 2
Factors that affect customers buying decisions
Results: The findings supports that for a considerable customer base, food taste as
well as value for the food are the two top most priorities or factors that affects their buying
decisions. It means quality of food and prices have a significant influence over the buying
decisions of the customers. However, convenience, restaurant concept and service quality
plays a less important role (Anderson and et.al., 2016). Thus, based on this, Balti Palace can
be recommended to offer exceptional taste of food at competitive rates to people.
Theme: 2. In the market, European cuisine is in great demand among people
Number of respondents %
European 12 40%
2.1 Summarization of data using representative values
Theme: 1 Maximum number of people keeps food taste and value at top priority
Number of respondents %
Food taste 11 37%
Service quality 4 13%
Value for food 8 27%
Convenient place 3 10%
Concept of the restaurant 2 7%
Other (Specify) 2 7%
30 100%
Food taste Service
quality Value for food Convenient
place Concept of
the restaurant Other
(Specify)
0
2
4
6
8
10
12 11
4
8
3
2 2
Factors that affect customers buying decisions
Results: The findings supports that for a considerable customer base, food taste as
well as value for the food are the two top most priorities or factors that affects their buying
decisions. It means quality of food and prices have a significant influence over the buying
decisions of the customers. However, convenience, restaurant concept and service quality
plays a less important role (Anderson and et.al., 2016). Thus, based on this, Balti Palace can
be recommended to offer exceptional taste of food at competitive rates to people.
Theme: 2. In the market, European cuisine is in great demand among people
Number of respondents %
European 12 40%
Paraphrase This Document
Need a fresh take? Get an instant paraphrase of this document with our AI Paraphraser
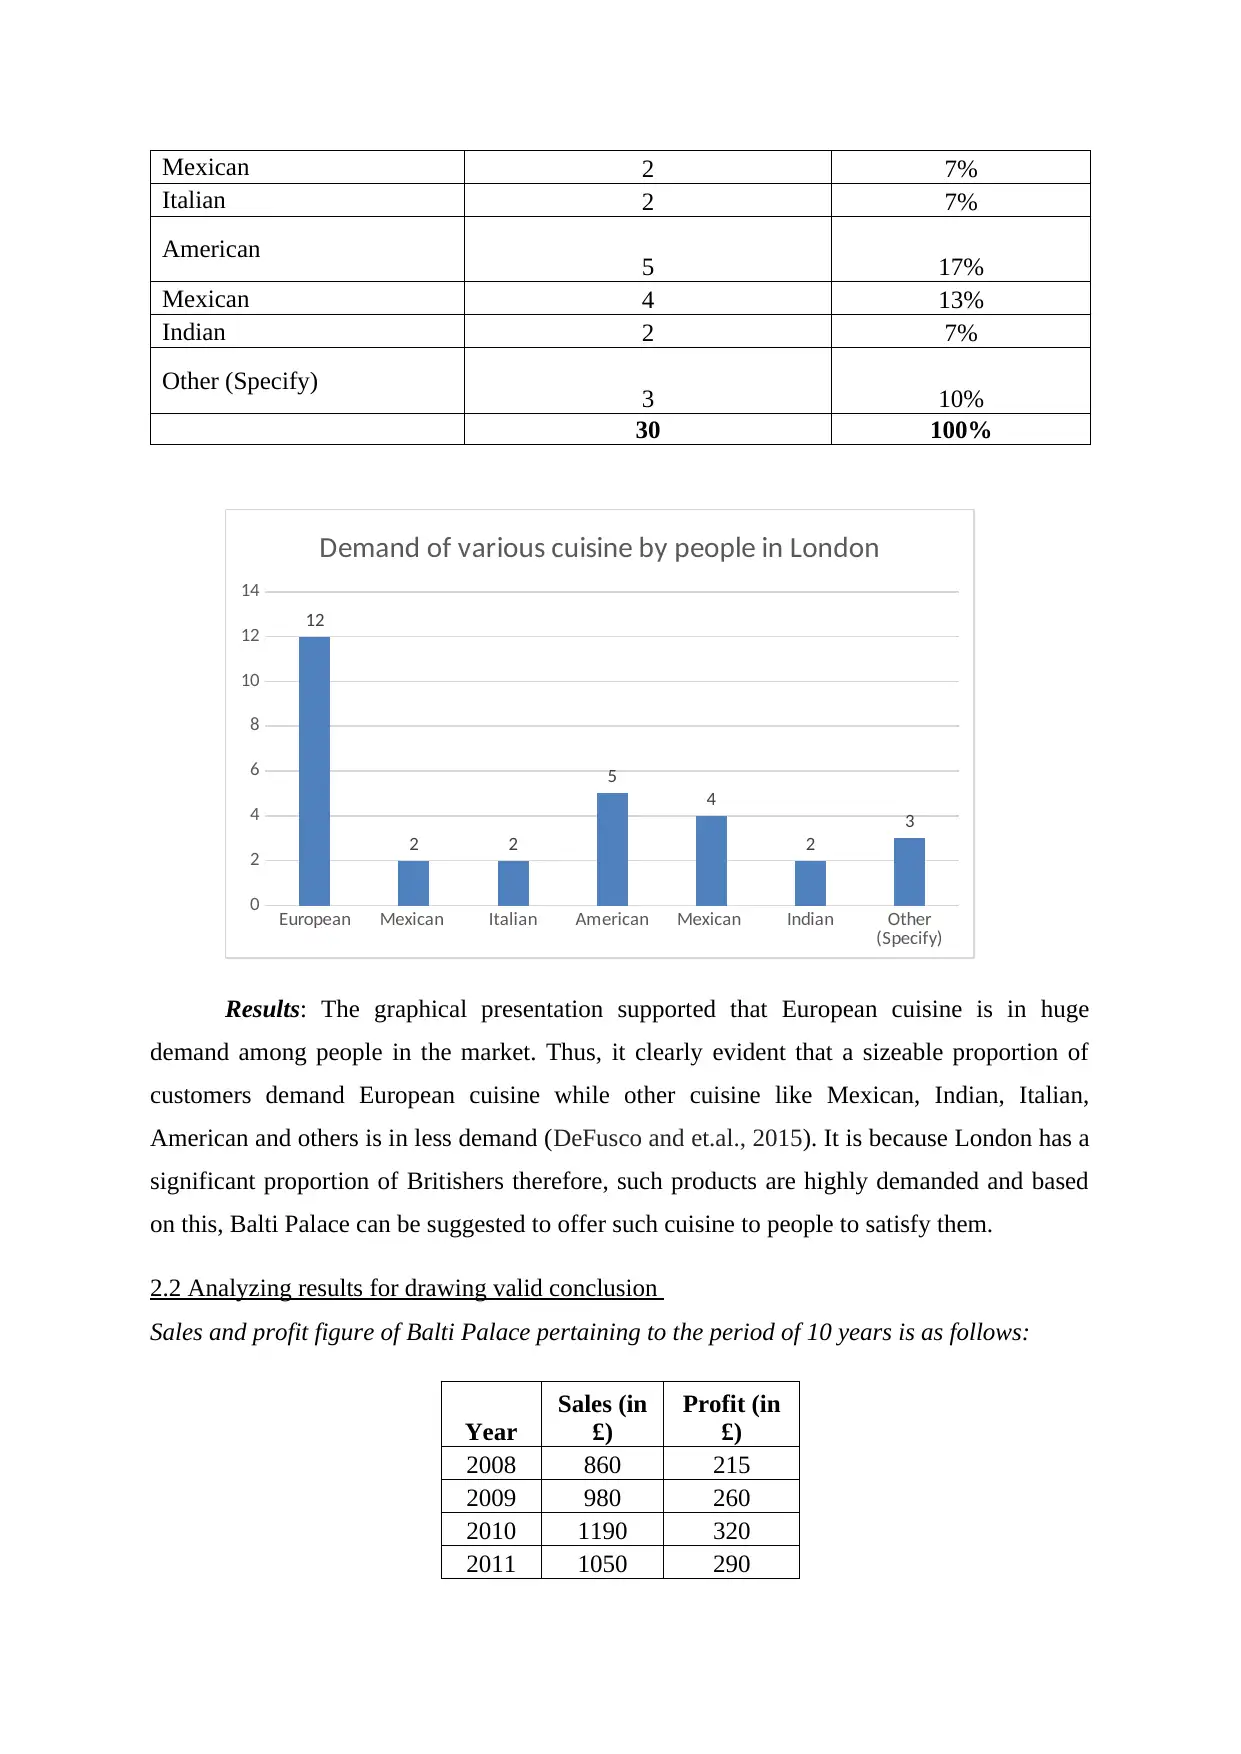
Mexican 2 7%
Italian 2 7%
American 5 17%
Mexican 4 13%
Indian 2 7%
Other (Specify) 3 10%
30 100%
European Mexican Italian American Mexican Indian Other
(Specify)
0
2
4
6
8
10
12
14
12
2 2
5
4
2
3
Demand of various cuisine by people in London
Results: The graphical presentation supported that European cuisine is in huge
demand among people in the market. Thus, it clearly evident that a sizeable proportion of
customers demand European cuisine while other cuisine like Mexican, Indian, Italian,
American and others is in less demand (DeFusco and et.al., 2015). It is because London has a
significant proportion of Britishers therefore, such products are highly demanded and based
on this, Balti Palace can be suggested to offer such cuisine to people to satisfy them.
2.2 Analyzing results for drawing valid conclusion
Sales and profit figure of Balti Palace pertaining to the period of 10 years is as follows:
Year
Sales (in
£)
Profit (in
£)
2008 860 215
2009 980 260
2010 1190 320
2011 1050 290
2012 1220 355
2013 1385 410
2014 1470 460
2015 1630 520
2016 1750 590
2017 1920 680
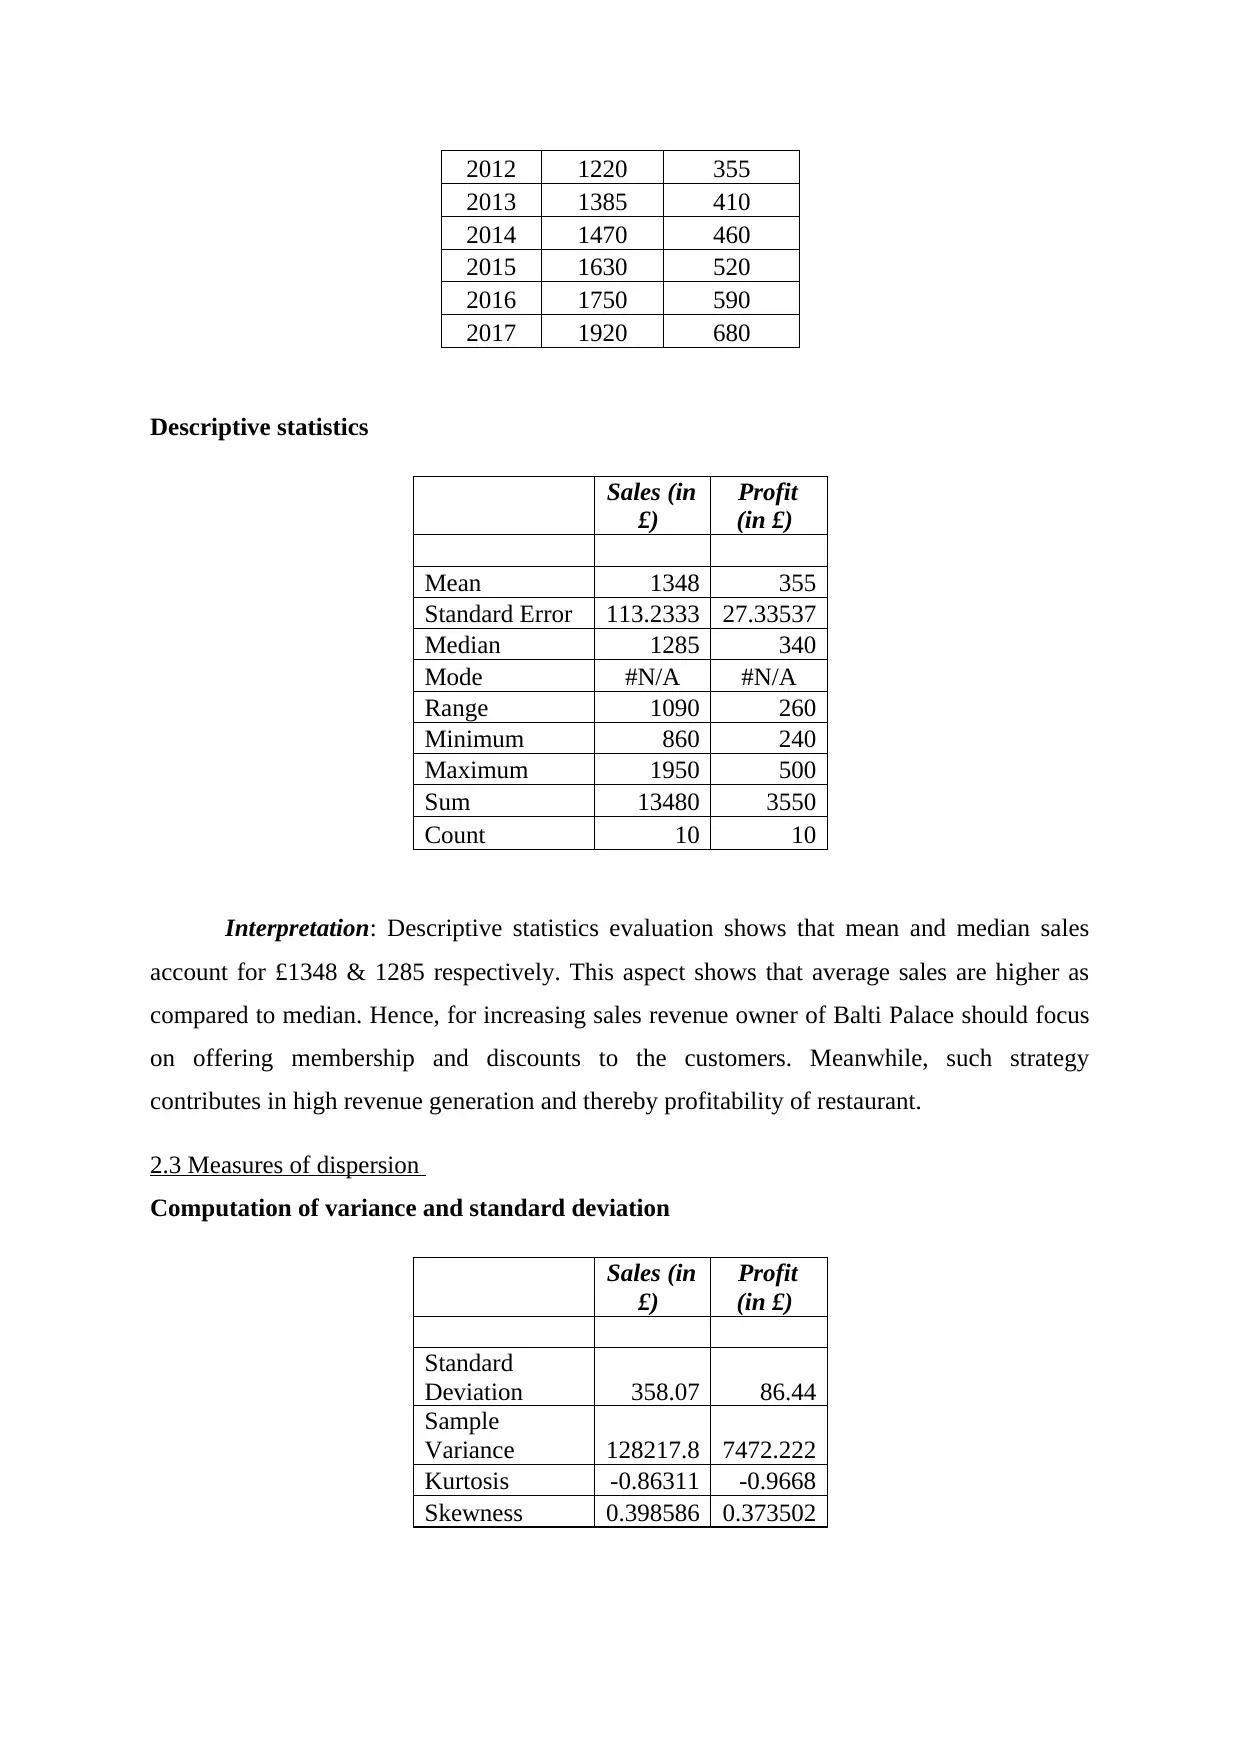
Descriptive statistics
Sales (in
£)
Profit
(in £)
Mean 1348 355
Standard Error 113.2333 27.33537
Median 1285 340
Mode #N/A #N/A
Range 1090 260
Minimum 860 240
Maximum 1950 500
Sum 13480 3550
Count 10 10
Interpretation: Descriptive statistics evaluation shows that mean and median sales
account for £1348 & 1285 respectively. This aspect shows that average sales are higher as
compared to median. Hence, for increasing sales revenue owner of Balti Palace should focus
on offering membership and discounts to the customers. Meanwhile, such strategy
contributes in high revenue generation and thereby profitability of restaurant.
2.3 Measures of dispersion
Computation of variance and standard deviation
Sales (in
£)
Profit
(in £)
Standard
Deviation 358.07 86.44
Sample
Variance 128217.8 7472.222
Kurtosis -0.86311 -0.9668
Skewness 0.398586 0.373502
2013 1385 410
2014 1470 460
2015 1630 520
2016 1750 590
2017 1920 680
Descriptive statistics
Sales (in
£)
Profit
(in £)
Mean 1348 355
Standard Error 113.2333 27.33537
Median 1285 340
Mode #N/A #N/A
Range 1090 260
Minimum 860 240
Maximum 1950 500
Sum 13480 3550
Count 10 10
Interpretation: Descriptive statistics evaluation shows that mean and median sales
account for £1348 & 1285 respectively. This aspect shows that average sales are higher as
compared to median. Hence, for increasing sales revenue owner of Balti Palace should focus
on offering membership and discounts to the customers. Meanwhile, such strategy
contributes in high revenue generation and thereby profitability of restaurant.
2.3 Measures of dispersion
Computation of variance and standard deviation
Sales (in
£)
Profit
(in £)
Standard
Deviation 358.07 86.44
Sample
Variance 128217.8 7472.222
Kurtosis -0.86311 -0.9668
Skewness 0.398586 0.373502
⊘ This is a preview!⊘
Do you want full access?
Subscribe today to unlock all pages.
Trusted by 1+ million students worldwide
Interpretation: Results of statistical evaluation shows that mean value of sales and
profit will deviate from £358.07 & 86.44 respectively. Hence, business entity of Balti Palace
should keep in mind all such aspects while developing policies or strategies. Thus, firm
should lay focus on undertaking promotional activities which in turn enhances sales and
thereby profit.
2.4 Computation of quartile, percentile and correlation co-efficient
Quartile: Such statistical tool provides deeper insight about financial aspects in the
form of quarters such as 1, 2 and 3. In other words, quartile tool of statistics divides list of
numbers or dataset into four quarters.
Percentile: It indicates company’s performance or data set in the form of percentage
rather than numeric values. Percentiles mainly include 25th, 50th and 75th percentile which
helps in assessing trend as per data set more effectually.
Both such tools, quartile and percentile are highly significant which helps business
entity in measuring as well as evaluating performance in the form of both numeric and
percentage form.
Correlation co-efficient: It may be presented as a statistical measure which helps in
both defining and measuring relationship that takes place between two variables. By
undertaking such tool owner of restaurant unit can easily assess the extent to which one
variable is associated with other.
Quartile and percentile
Particulars Sales (in £) Profit (in £)
1st quartile & 25th
percentile 1085 297.5
2nd quartile & 50th
percentile 1285 340
3rd quartile & 75th
percentile 1575 413
Interpretation: The above depicted table shows that in each quarter value of sales and
profit margin increased. In the first quarters, sales revenue accounts for £1085 respectively,
whereas it reached on £1575 in 3rd quarter. Further, profit of Balti Palace also increased from
£297.5 to £413 at the end of third quarter. Hence, by taking into account the evaluation of
Paraphrase This Document
Need a fresh take? Get an instant paraphrase of this document with our AI Paraphraser
secondary data set, it can be depicted that customers who visit restaurant increased over the
time which in turn resulted into high sales as well as margin.
Correlation co-efficient
Sales Profit
Sales 1 0.99
Profit 0.99 1
Statistical evaluation presents that positive and higher relationship takes place
between the variables such as sales as well as profit margin. In accordance with .99
correlations, it can be stated that both sales and profit will move in a similar tandem either
positive or negative. Thus, owner of Balti Palace should focus on developing sound
framework that contributes in both sales revenue as well as profit margin.
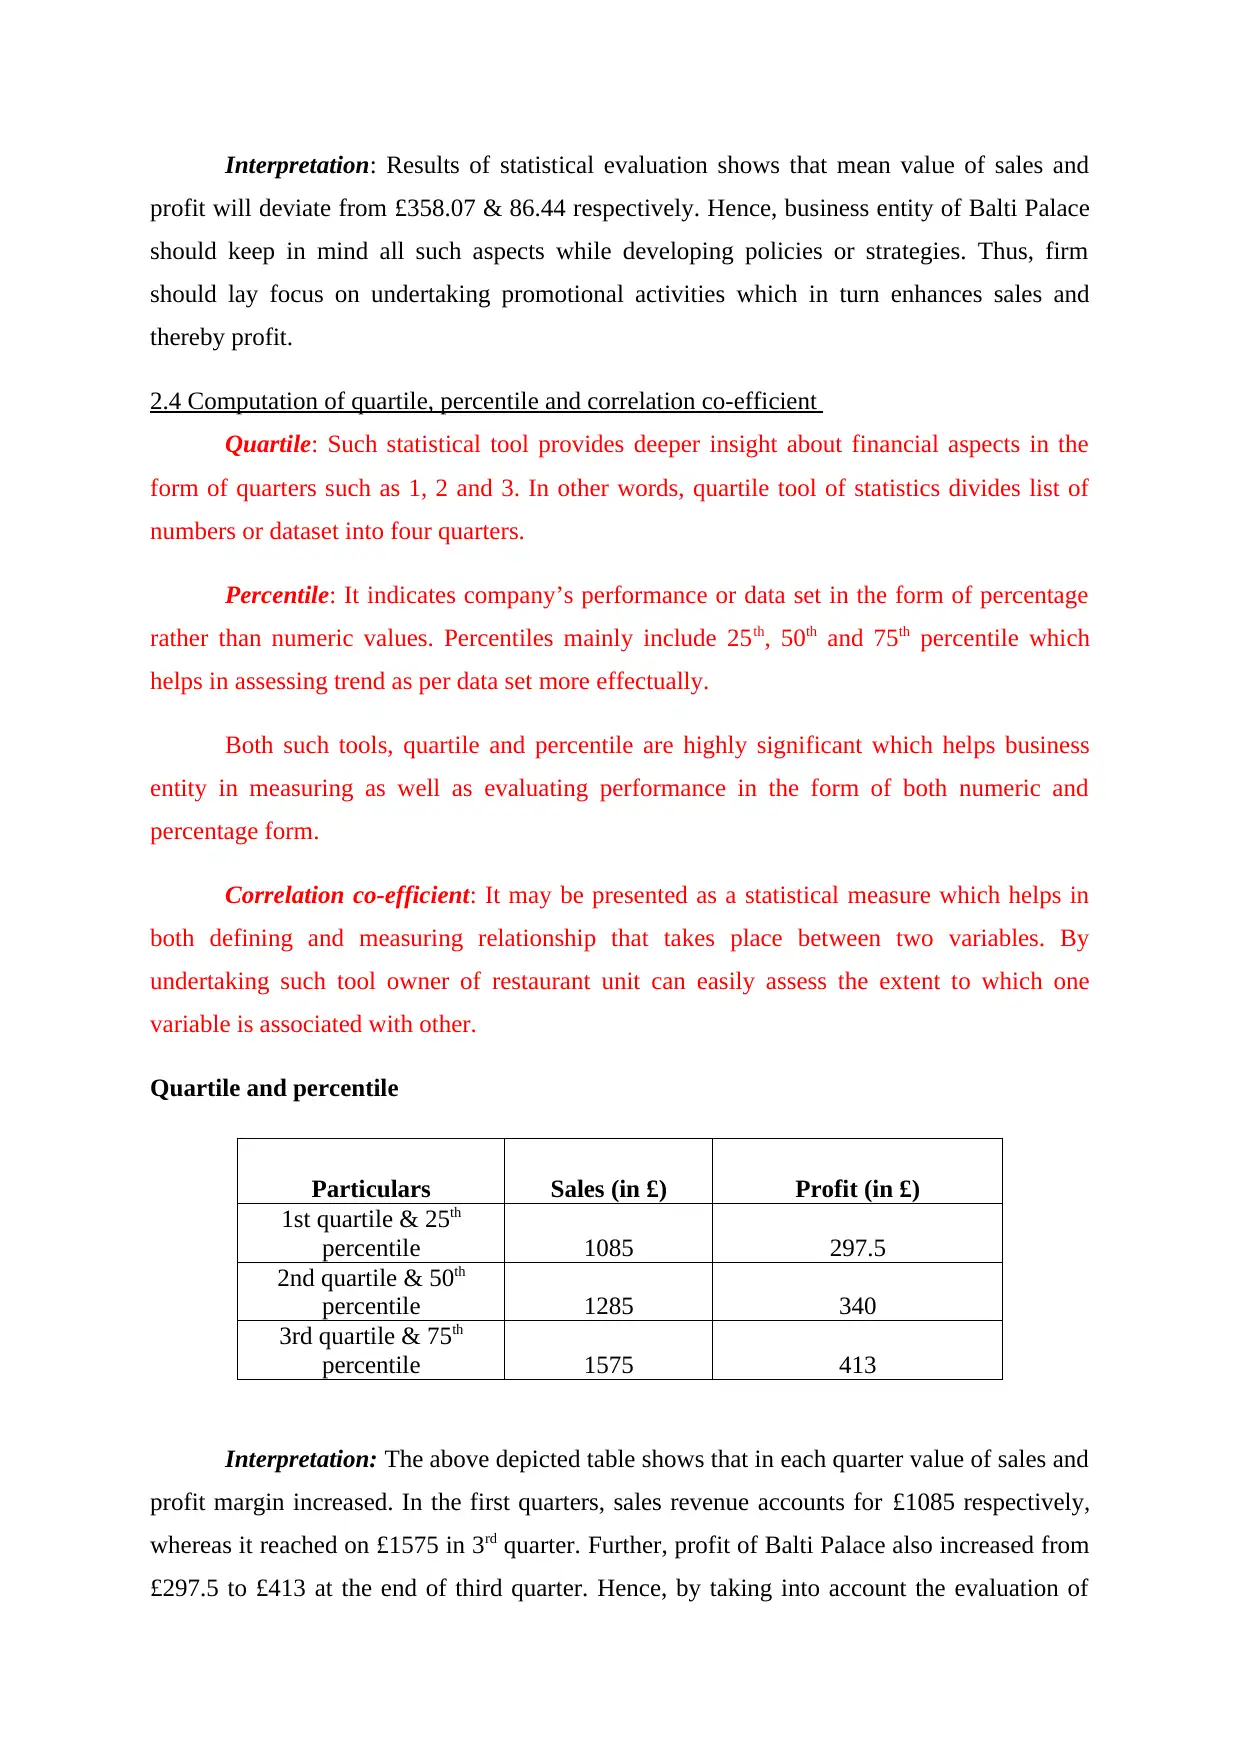
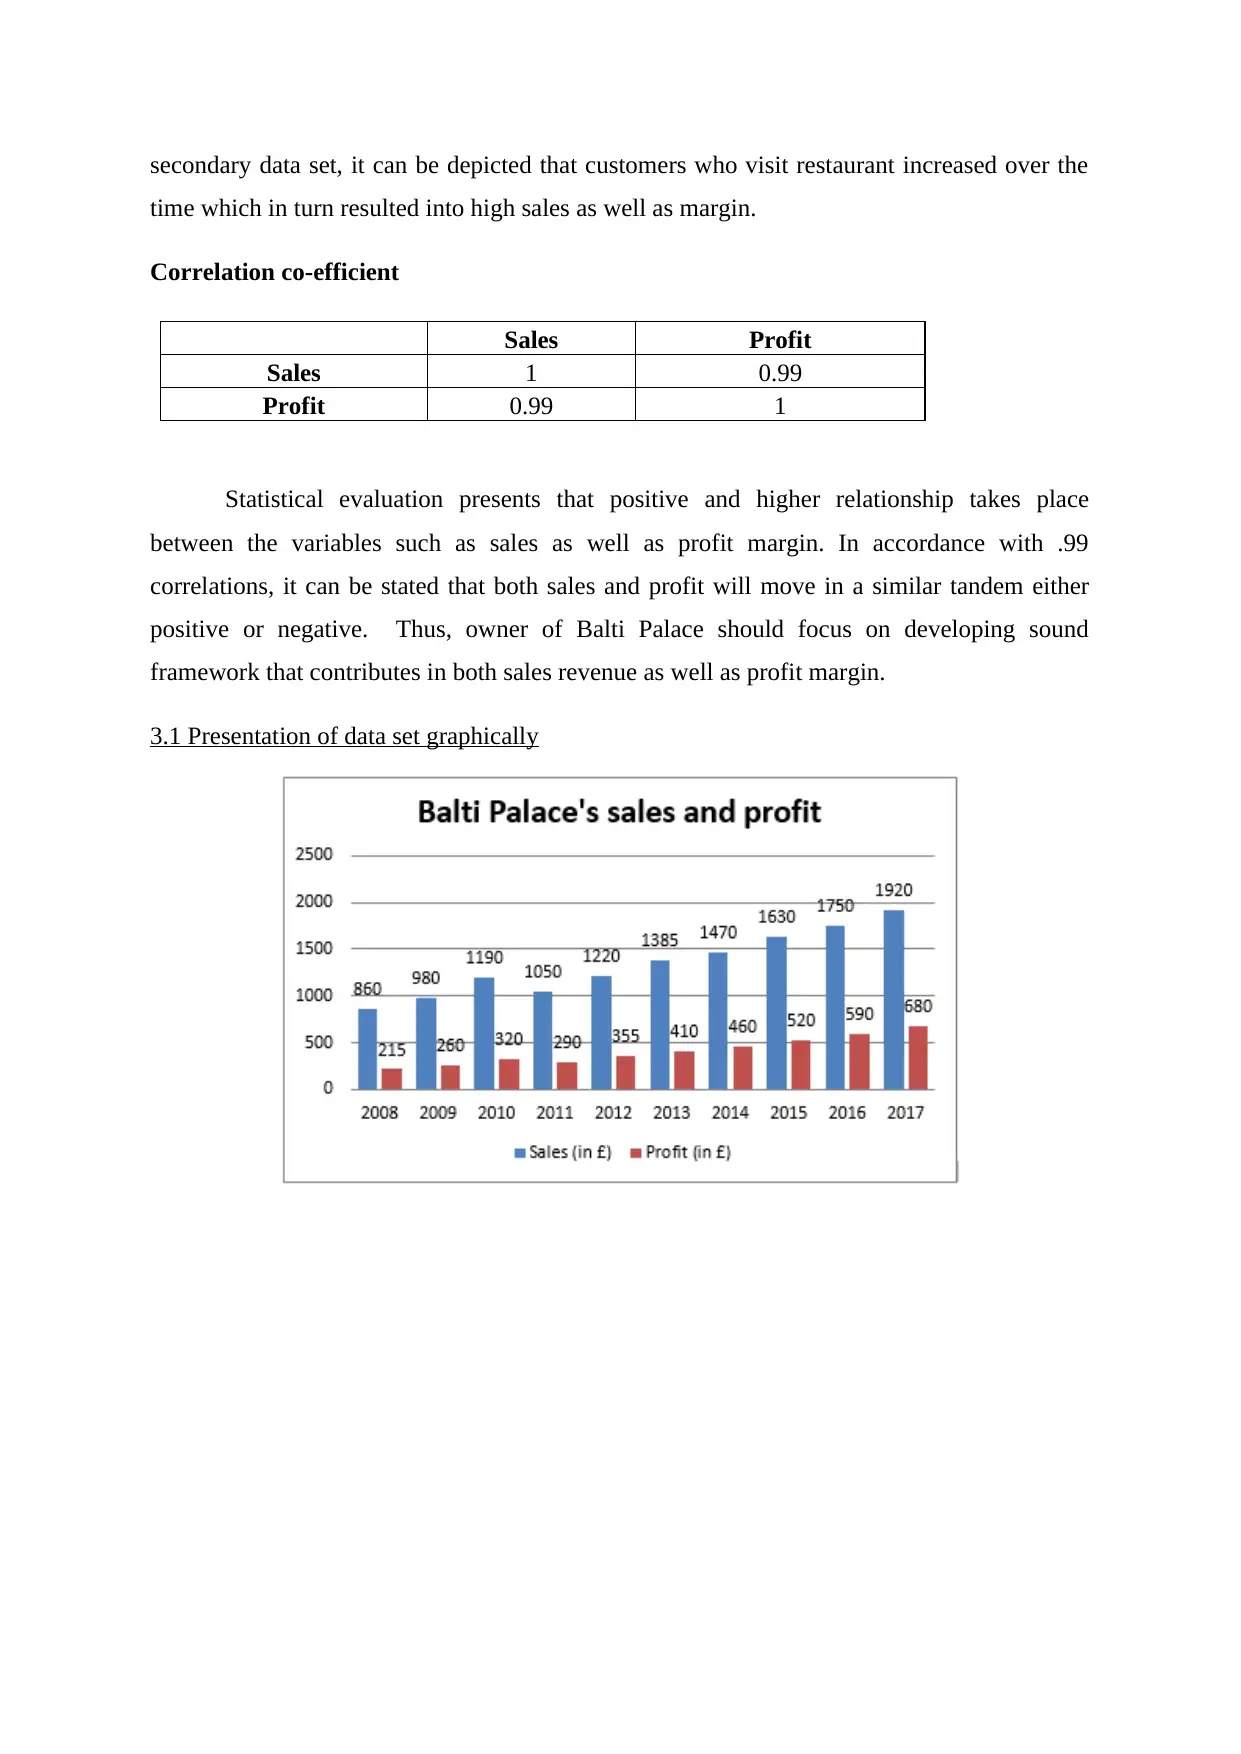
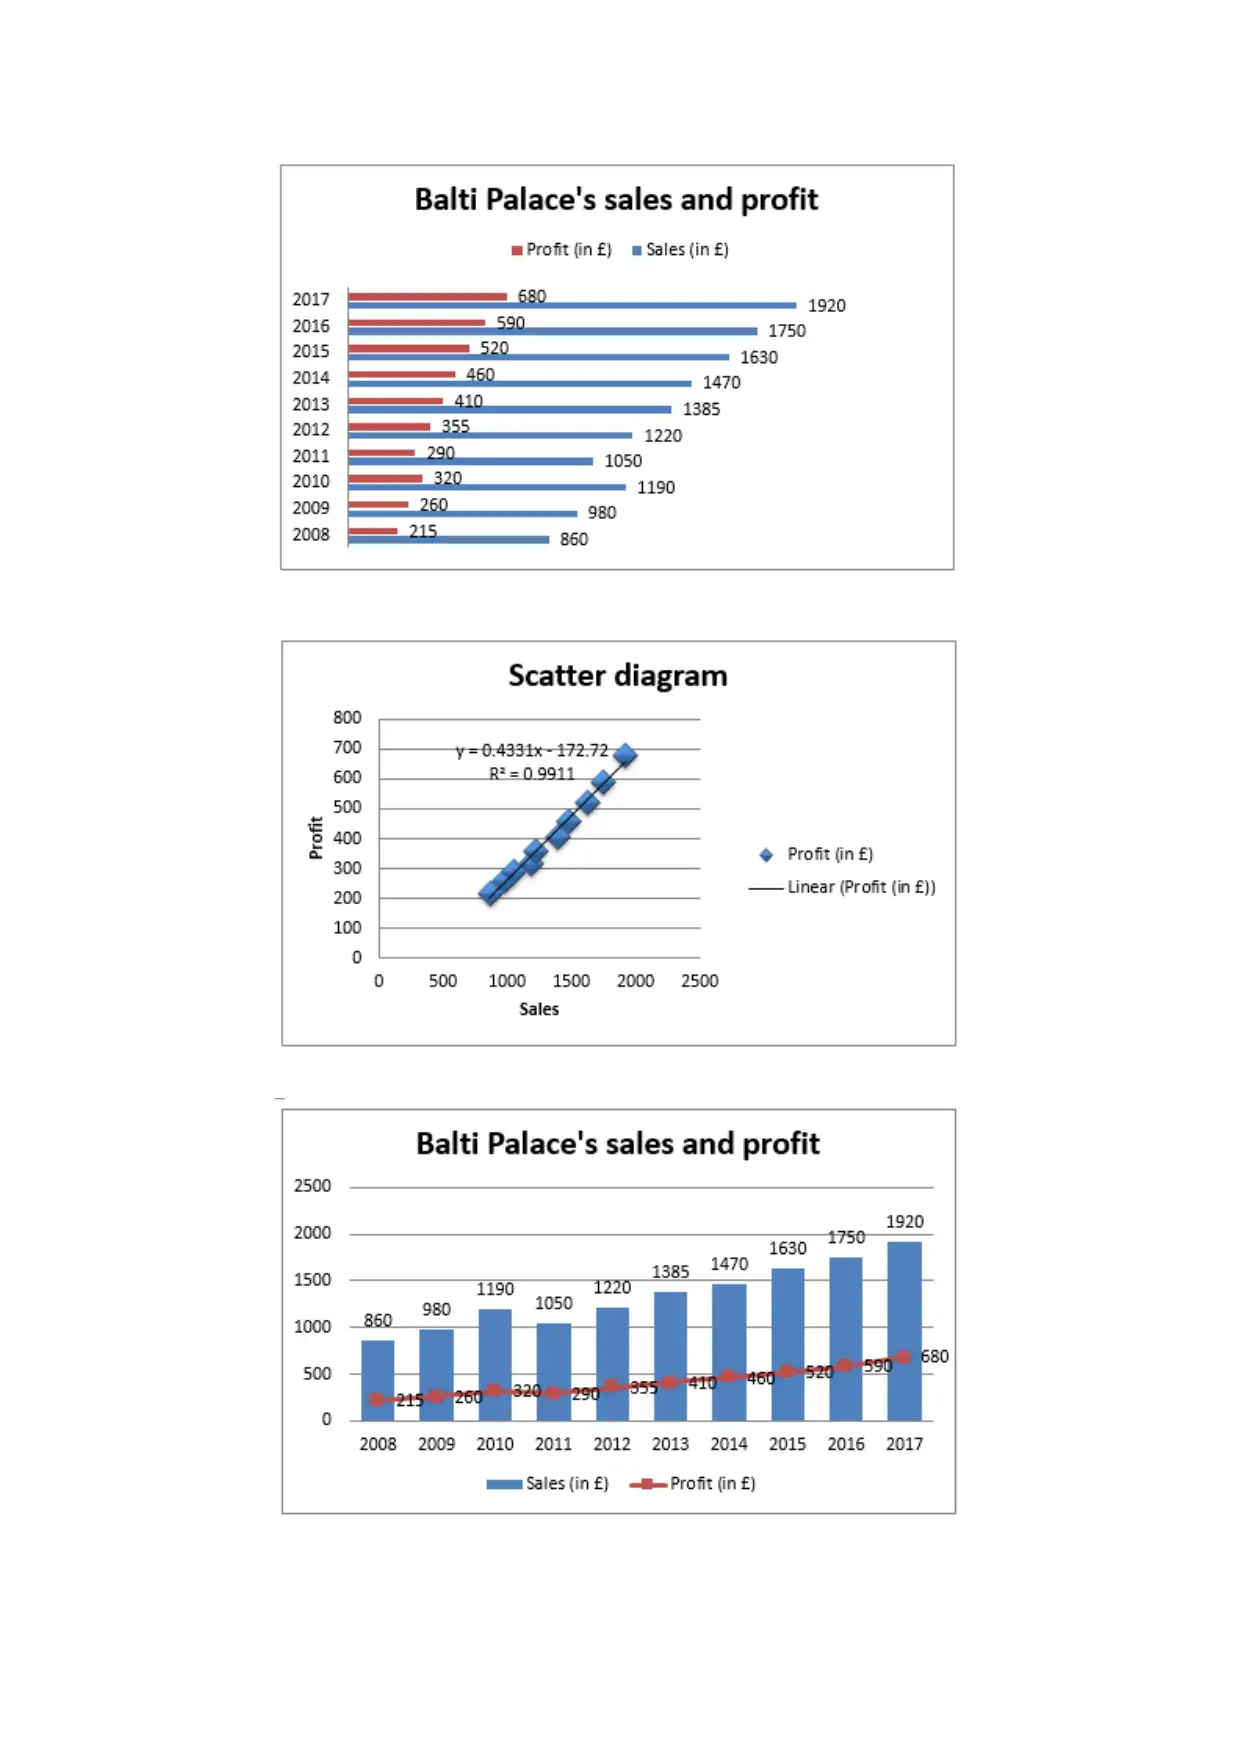
3.1 Presentation of data set graphically
time which in turn resulted into high sales as well as margin.
Correlation co-efficient
Sales Profit
Sales 1 0.99
Profit 0.99 1
Statistical evaluation presents that positive and higher relationship takes place
between the variables such as sales as well as profit margin. In accordance with .99
correlations, it can be stated that both sales and profit will move in a similar tandem either
positive or negative. Thus, owner of Balti Palace should focus on developing sound
framework that contributes in both sales revenue as well as profit margin.
3.1 Presentation of data set graphically
⊘ This is a preview!⊘
Do you want full access?
Subscribe today to unlock all pages.
Trusted by 1+ million students worldwide
1 out of 27
Related Documents


Your All-in-One AI-Powered Toolkit for Academic Success.
+13062052269
info@desklib.com
Available 24*7 on WhatsApp / Email
![[object Object]](/_next/static/media/star-bottom.7253800d.svg)
Unlock your academic potential
Copyright © 2020–2026 A2Z Services. All Rights Reserved. Developed and managed by ZUCOL.