SEM I Business Decision Making: Blackfriars Restaurant Analysis Report
VerifiedAdded on 2020/01/28
|18
|4008
|378
Report
AI Summary
This report presents a comprehensive analysis of business decision-making processes, focusing on Blackfriars Restaurant's potential expansion into the London market. The report begins by exploring data collection methods, differentiating between primary and secondary sources, and detailing survey methodologies and sampling frameworks. It then delves into statistical analysis, including calculations of mean, median, mode, measures of dispersion, percentiles, and correlation to evaluate the restaurant's sales performance. The findings are presented graphically and interpreted to provide insights into customer behavior and market trends. Furthermore, the report includes a project plan and discusses financial tools relevant to decision-making. The overall aim is to provide a strategic framework for Blackfriars Restaurant to make informed decisions regarding its expansion, considering various factors influencing consumer choices and market dynamics.
SEM I-BUSINESS DECISION MAKING
Paraphrase This Document
Need a fresh take? Get an instant paraphrase of this document with our AI Paraphraser
TABLE OF CONTENTS
INTRODUCTION...........................................................................................................................3
TASK 1............................................................................................................................................3
1.1 Sources of collecting primary and secondary data................................................................3
1.2 Survey methodology and sampling frame work....................................................................4
1.3 Questionnaire.........................................................................................................................5
TASK 2............................................................................................................................................6
2.1 Decision making calculations................................................................................................6
2.2 Results or interpretation.........................................................................................................7
2.3 Measures of dispersion..........................................................................................................8
2.4 Percentile and correlation......................................................................................................8
TASK 3............................................................................................................................................9
3.1 Graphical presentation...........................................................................................................9
3.2 Trend line chart....................................................................................................................11
3.3 Business presentation...........................................................................................................12
3.4 Formal business report.........................................................................................................12
TASK 4..........................................................................................................................................13
4.1 Information processing tools................................................................................................13
4.2 Project plan..........................................................................................................................14
4.3 Financial tools for decision making.....................................................................................15
CONCLUSION..............................................................................................................................16
REFERENCES..............................................................................................................................17
2
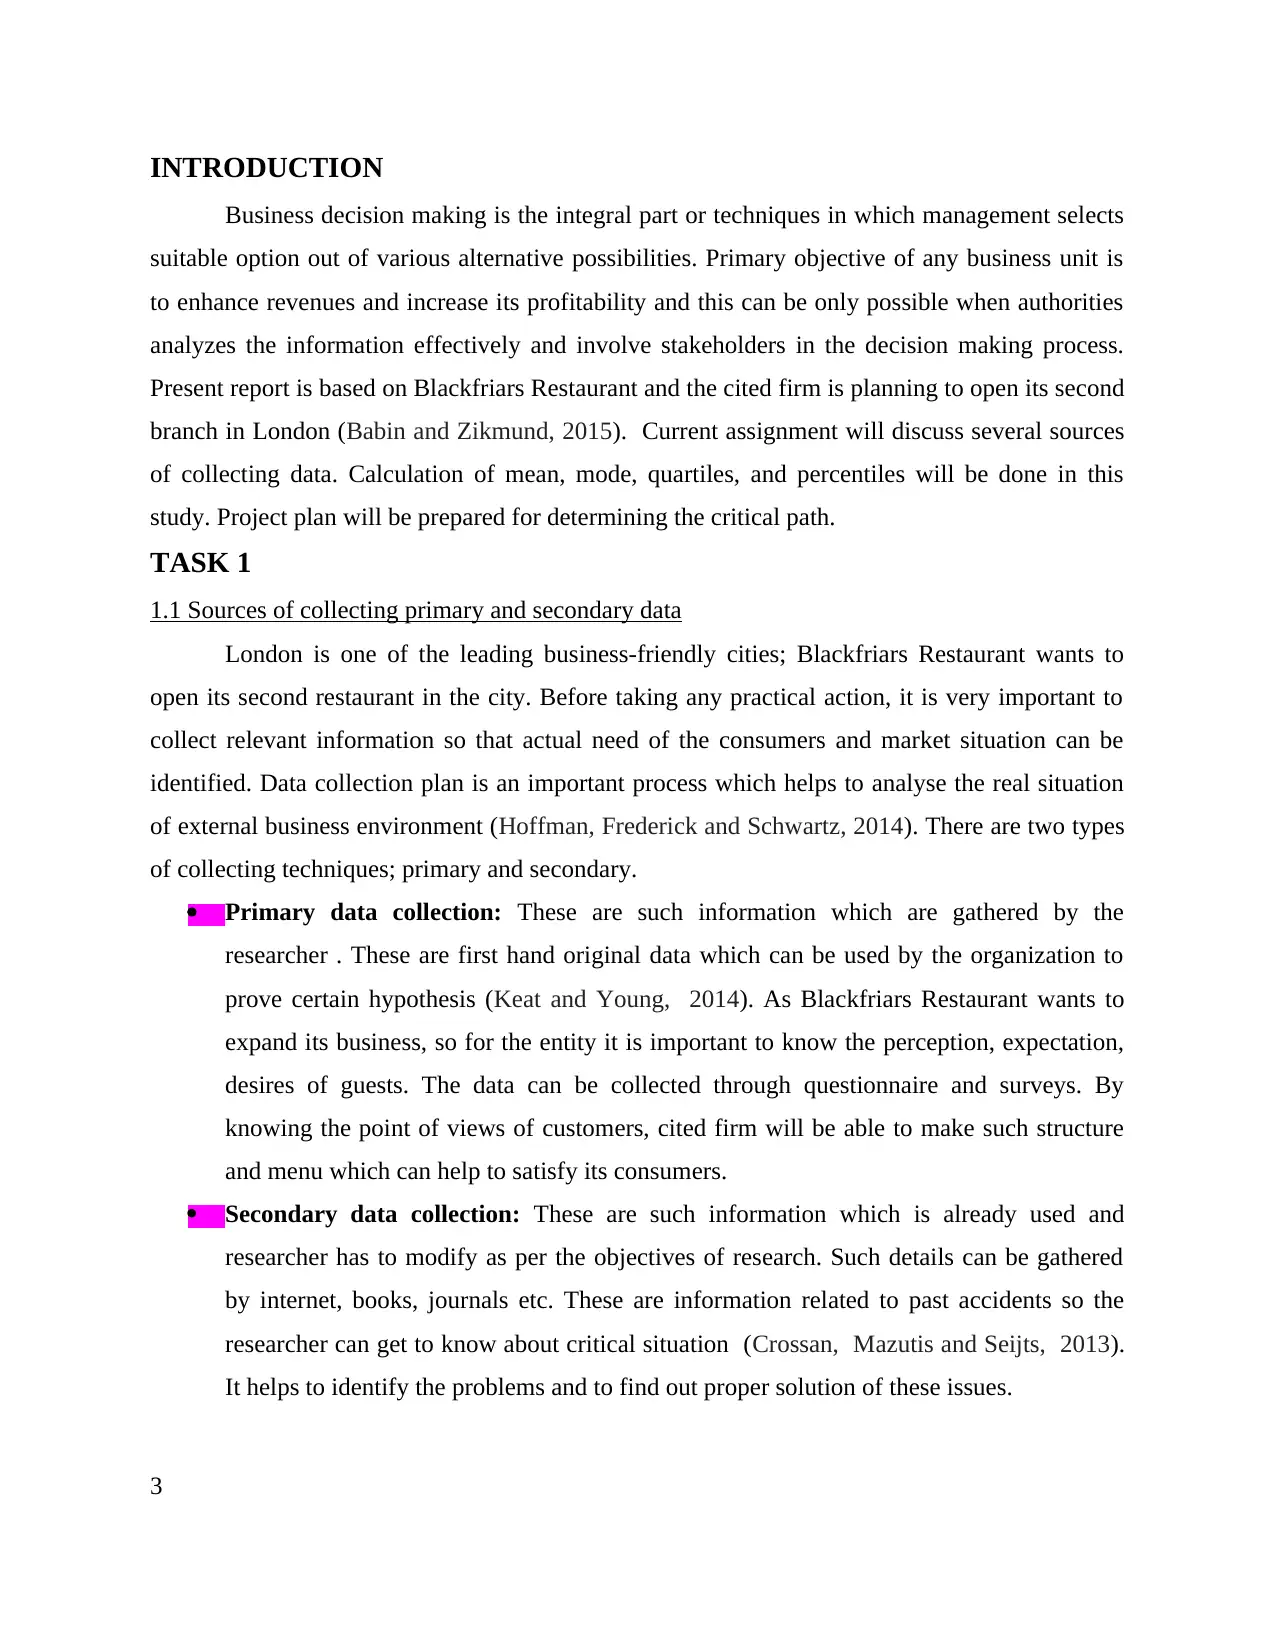
INTRODUCTION
Business decision making is the integral part or techniques in which management selects
suitable option out of various alternative possibilities. Primary objective of any business unit is
to enhance revenues and increase its profitability and this can be only possible when authorities
analyzes the information effectively and involve stakeholders in the decision making process.
Present report is based on Blackfriars Restaurant and the cited firm is planning to open its second
branch in London (Babin and Zikmund, 2015). Current assignment will discuss several sources
of collecting data. Calculation of mean, mode, quartiles, and percentiles will be done in this
study. Project plan will be prepared for determining the critical path.
TASK 1
1.1 Sources of collecting primary and secondary data
London is one of the leading business-friendly cities; Blackfriars Restaurant wants to
open its second restaurant in the city. Before taking any practical action, it is very important to
collect relevant information so that actual need of the consumers and market situation can be
identified. Data collection plan is an important process which helps to analyse the real situation
of external business environment (Hoffman, Frederick and Schwartz, 2014). There are two types
of collecting techniques; primary and secondary.
Primary data collection: These are such information which are gathered by the
researcher . These are first hand original data which can be used by the organization to
prove certain hypothesis (Keat and Young, 2014). As Blackfriars Restaurant wants to
expand its business, so for the entity it is important to know the perception, expectation,
desires of guests. The data can be collected through questionnaire and surveys. By
knowing the point of views of customers, cited firm will be able to make such structure
and menu which can help to satisfy its consumers.
Secondary data collection: These are such information which is already used and
researcher has to modify as per the objectives of research. Such details can be gathered
by internet, books, journals etc. These are information related to past accidents so the
researcher can get to know about critical situation (Crossan, Mazutis and Seijts, 2013).
It helps to identify the problems and to find out proper solution of these issues.
3
⊘ This is a preview!⊘
Do you want full access?
Subscribe today to unlock all pages.
Trusted by 1+ million students worldwide
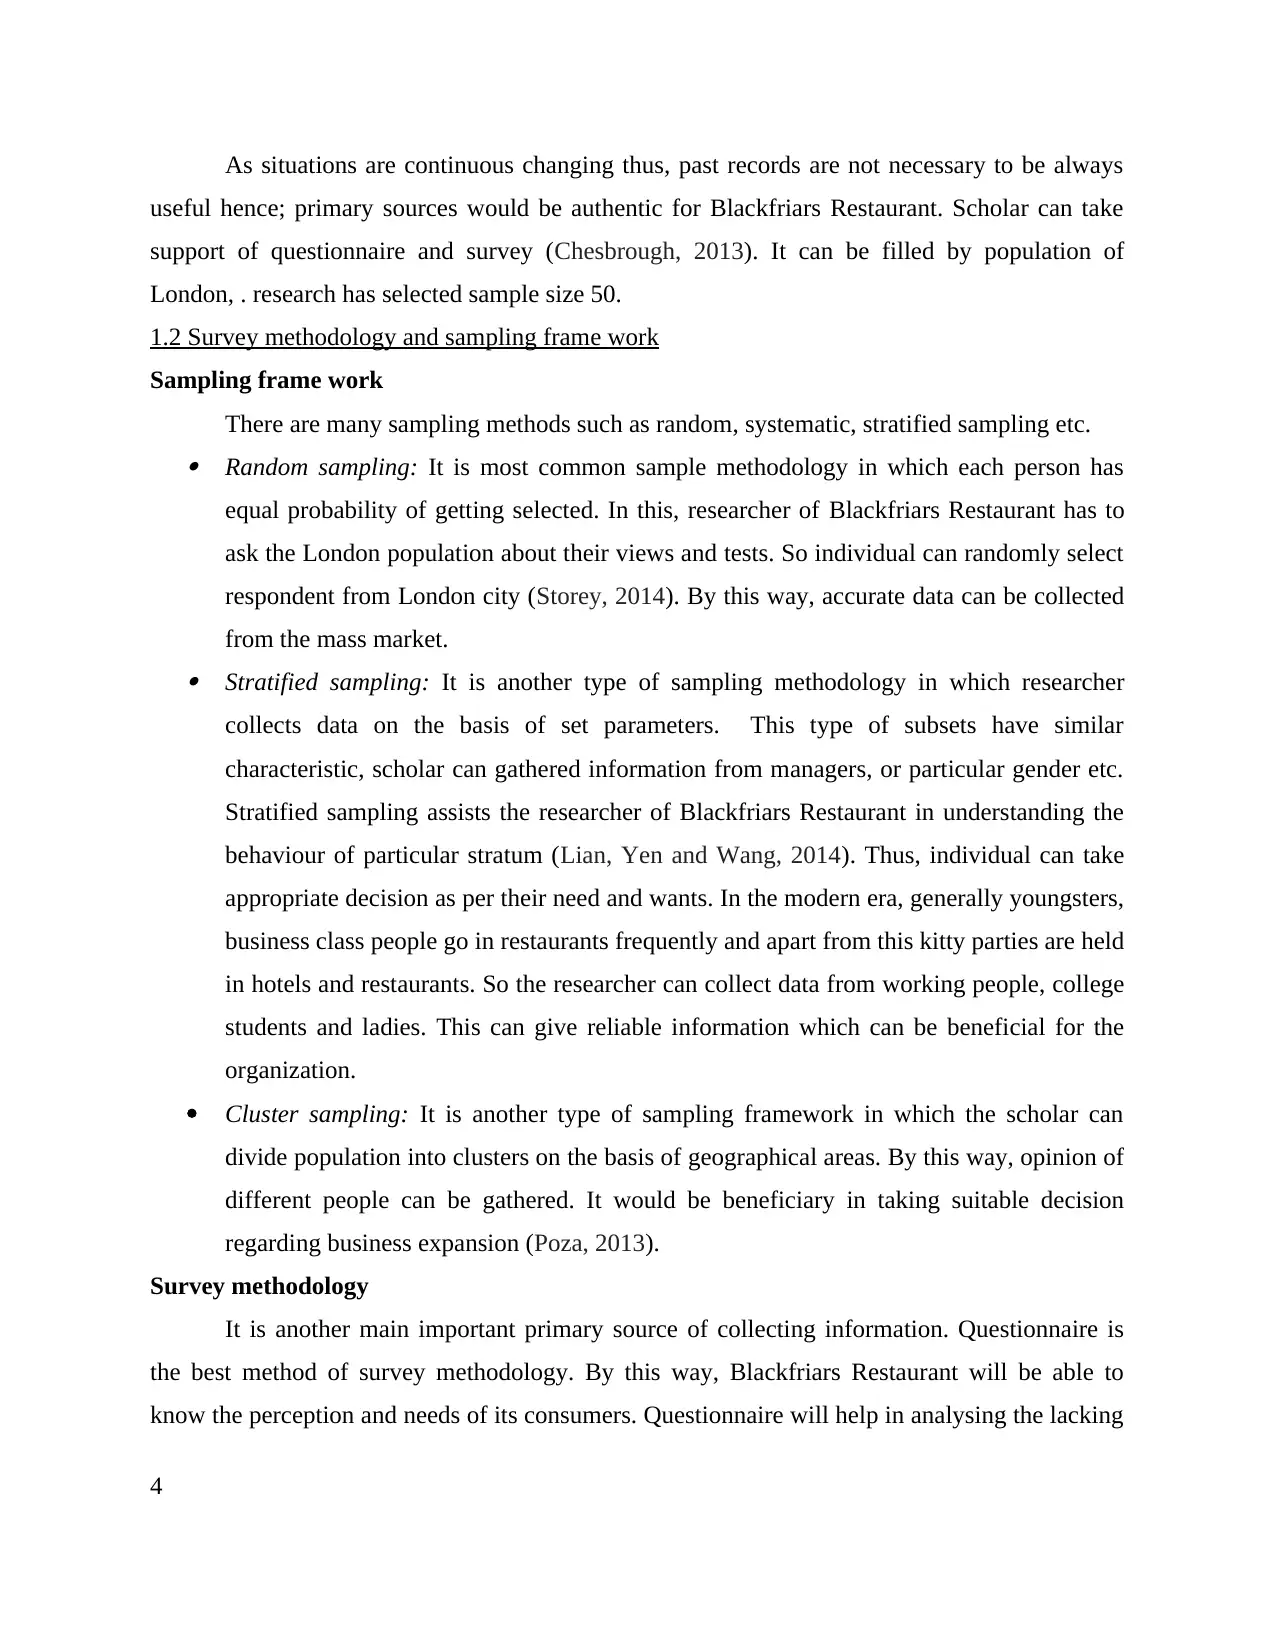
As situations are continuous changing thus, past records are not necessary to be always
useful hence; primary sources would be authentic for Blackfriars Restaurant. Scholar can take
support of questionnaire and survey (Chesbrough, 2013). It can be filled by population of
London, . research has selected sample size 50.
1.2 Survey methodology and sampling frame work
Sampling frame work
There are many sampling methods such as random, systematic, stratified sampling etc. Random sampling: It is most common sample methodology in which each person has
equal probability of getting selected. In this, researcher of Blackfriars Restaurant has to
ask the London population about their views and tests. So individual can randomly select
respondent from London city (Storey, 2014). By this way, accurate data can be collected
from the mass market. Stratified sampling: It is another type of sampling methodology in which researcher
collects data on the basis of set parameters. This type of subsets have similar
characteristic, scholar can gathered information from managers, or particular gender etc.
Stratified sampling assists the researcher of Blackfriars Restaurant in understanding the
behaviour of particular stratum (Lian, Yen and Wang, 2014). Thus, individual can take
appropriate decision as per their need and wants. In the modern era, generally youngsters,
business class people go in restaurants frequently and apart from this kitty parties are held
in hotels and restaurants. So the researcher can collect data from working people, college
students and ladies. This can give reliable information which can be beneficial for the
organization.
Cluster sampling: It is another type of sampling framework in which the scholar can
divide population into clusters on the basis of geographical areas. By this way, opinion of
different people can be gathered. It would be beneficiary in taking suitable decision
regarding business expansion (Poza, 2013).
Survey methodology
It is another main important primary source of collecting information. Questionnaire is
the best method of survey methodology. By this way, Blackfriars Restaurant will be able to
know the perception and needs of its consumers. Questionnaire will help in analysing the lacking
4
Paraphrase This Document
Need a fresh take? Get an instant paraphrase of this document with our AI Paraphraser
points of current process of Blackfriars Restaurant and thus the management would be able to
design structure of operations in second restaurant according to needs of guests (Boshyk, 2016).
By this way, it will be able to satisfy its consumers and by this way business of the firm will get
enhanced.
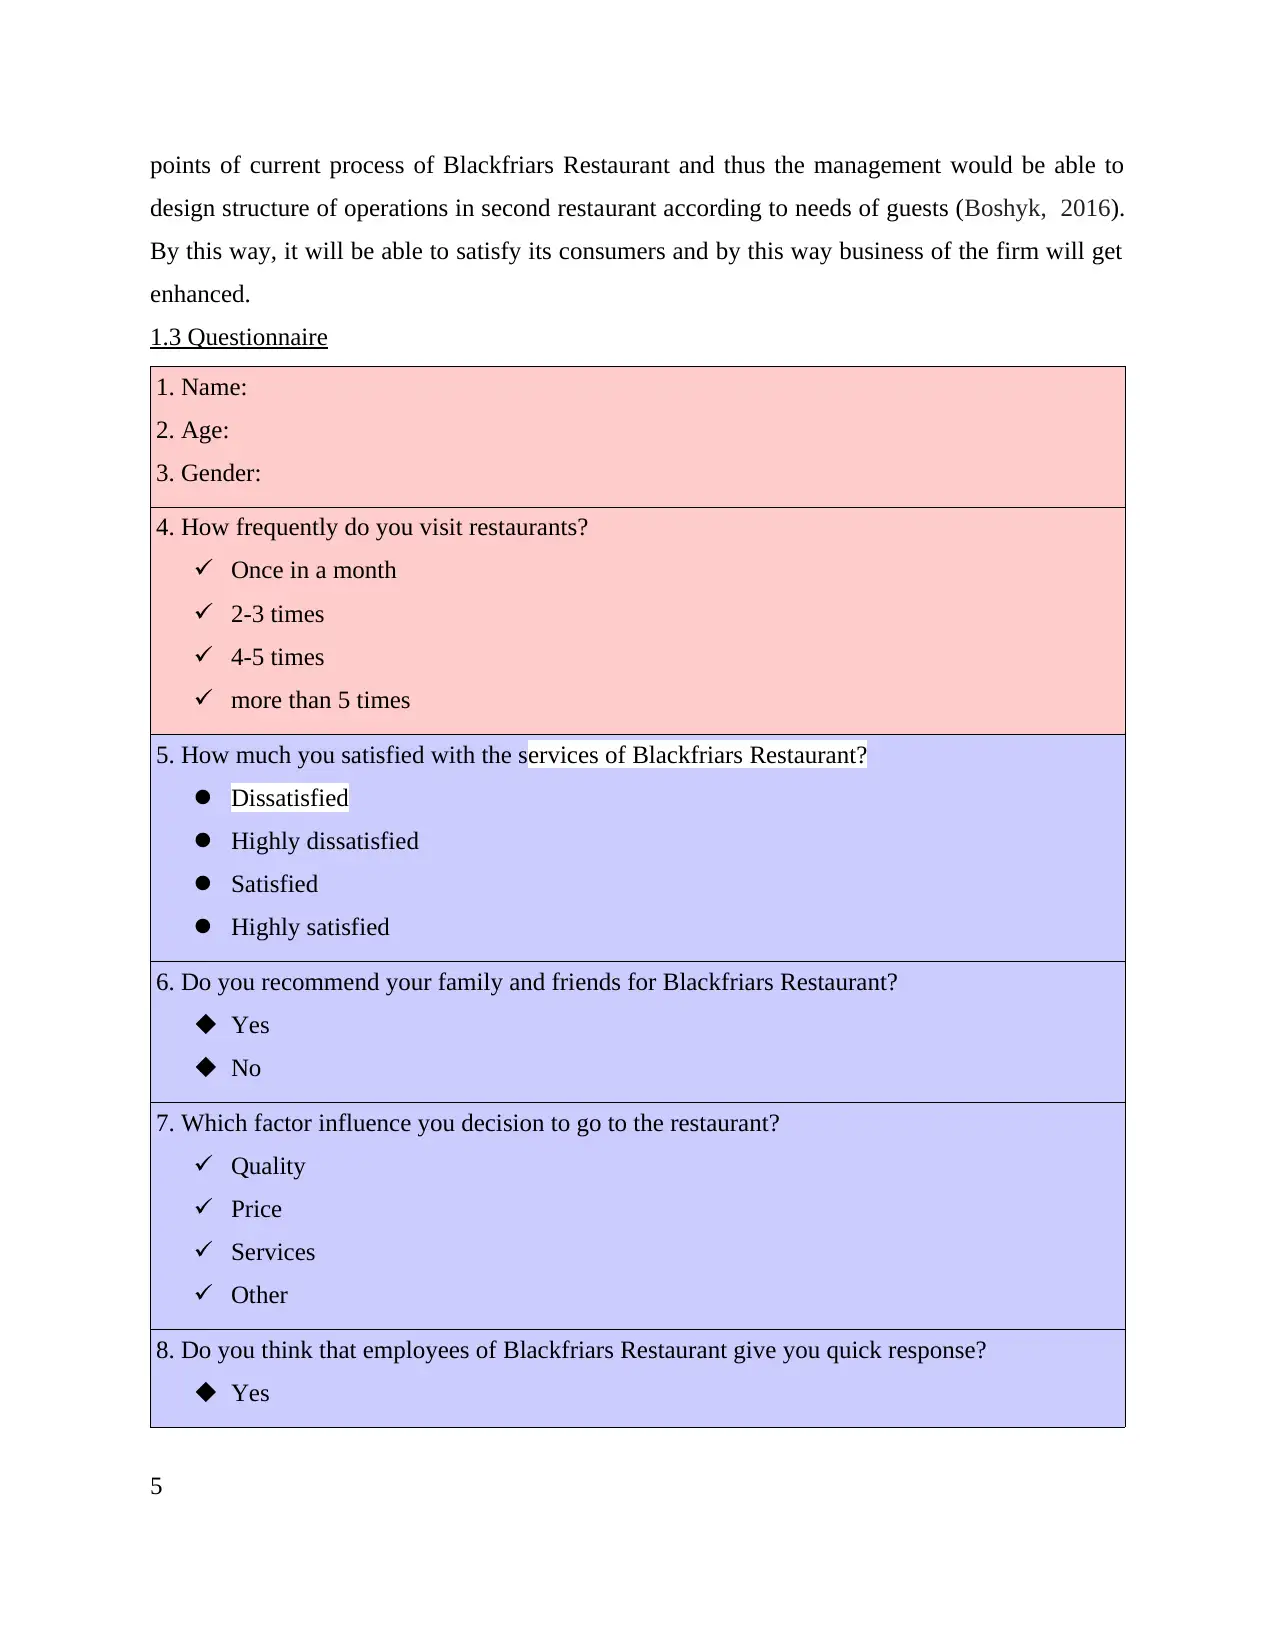
1.3 Questionnaire
1. Name:
2. Age:
3. Gender:
4. How frequently do you visit restaurants?
Once in a month
2-3 times
4-5 times
more than 5 times
5. How much you satisfied with the services of Blackfriars Restaurant?
Dissatisfied
Highly dissatisfied
Satisfied
Highly satisfied
6. Do you recommend your family and friends for Blackfriars Restaurant?
Yes
No
7. Which factor influence you decision to go to the restaurant?
Quality
Price
Services
Other
8. Do you think that employees of Blackfriars Restaurant give you quick response?
Yes
5
design structure of operations in second restaurant according to needs of guests (Boshyk, 2016).
By this way, it will be able to satisfy its consumers and by this way business of the firm will get
enhanced.
1.3 Questionnaire
1. Name:
2. Age:
3. Gender:
4. How frequently do you visit restaurants?
Once in a month
2-3 times
4-5 times
more than 5 times
5. How much you satisfied with the services of Blackfriars Restaurant?
Dissatisfied
Highly dissatisfied
Satisfied
Highly satisfied
6. Do you recommend your family and friends for Blackfriars Restaurant?
Yes
No
7. Which factor influence you decision to go to the restaurant?
Quality
Price
Services
Other
8. Do you think that employees of Blackfriars Restaurant give you quick response?
Yes
5
No
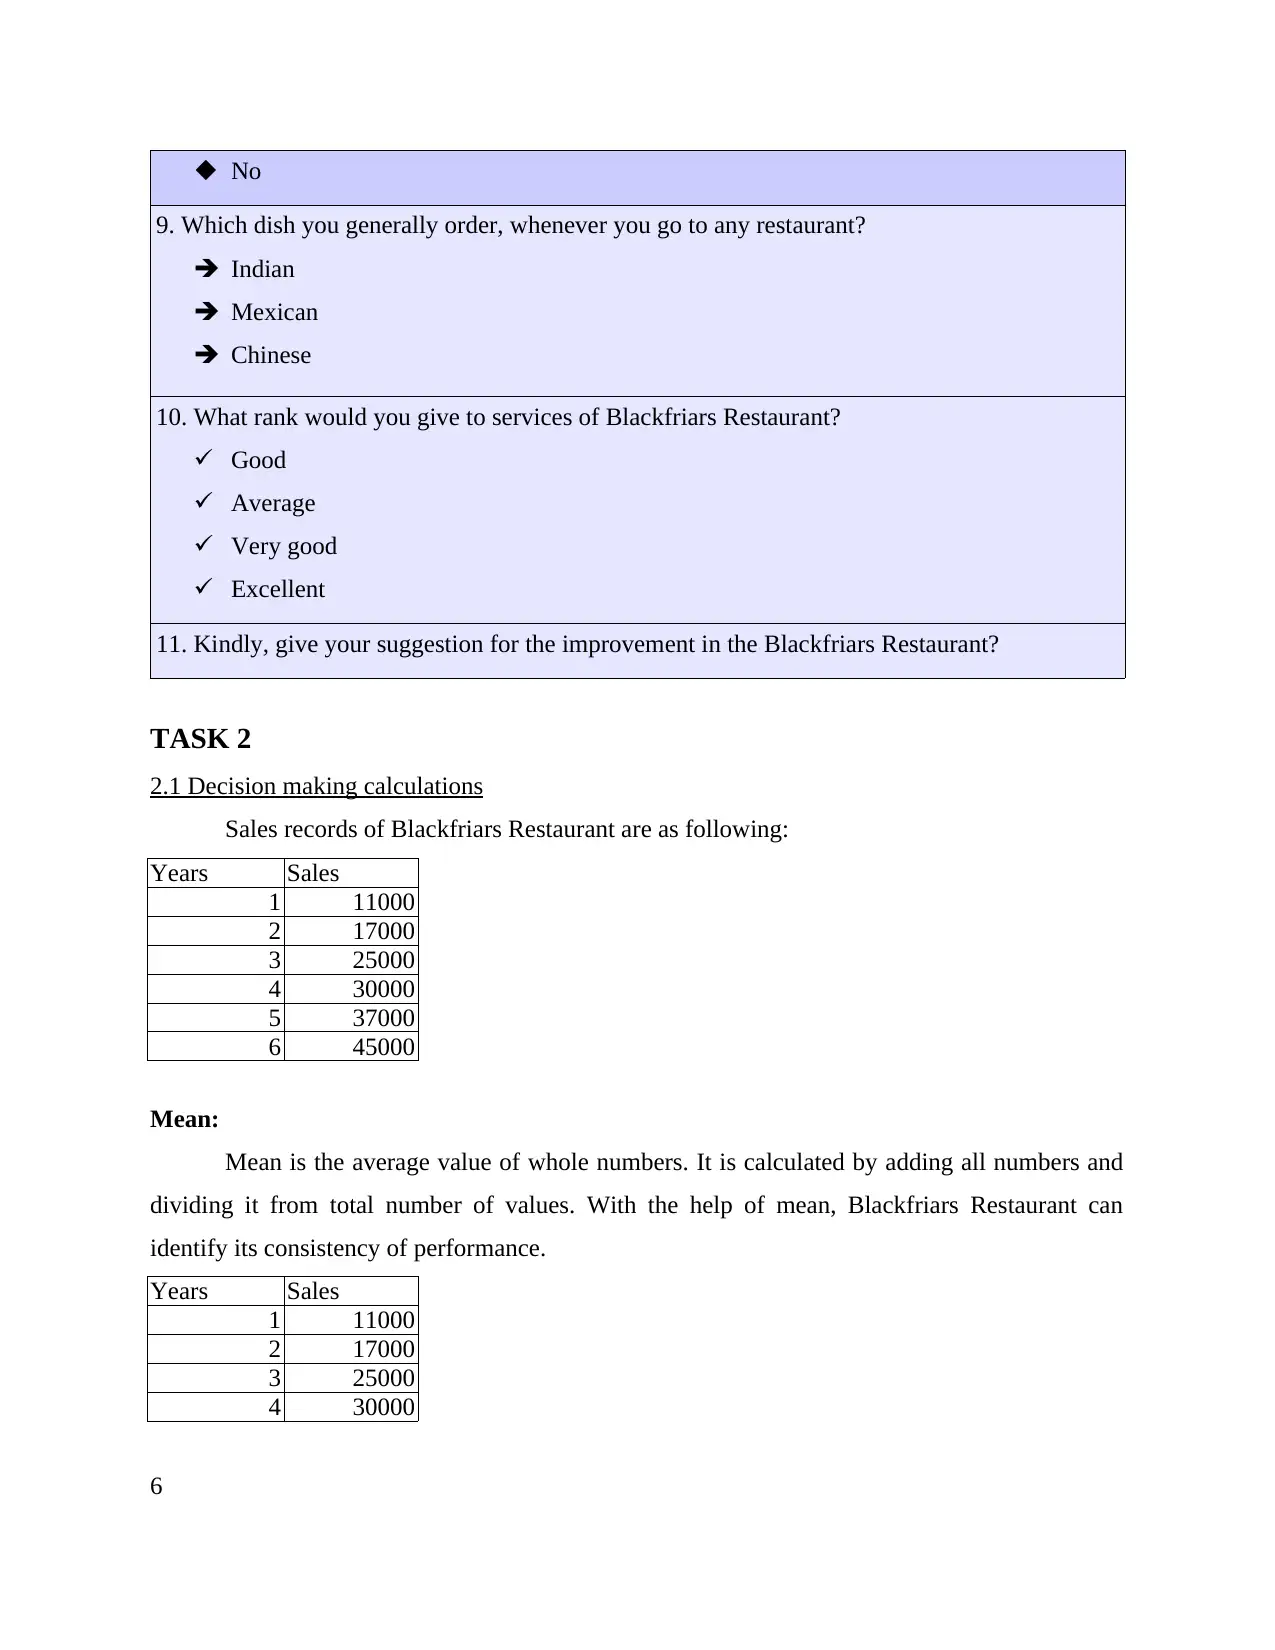
9. Which dish you generally order, whenever you go to any restaurant?
Indian
Mexican
Chinese
10. What rank would you give to services of Blackfriars Restaurant?
Good
Average
Very good
Excellent
11. Kindly, give your suggestion for the improvement in the Blackfriars Restaurant?
TASK 2
2.1 Decision making calculations
Sales records of Blackfriars Restaurant are as following:
Years Sales
1 11000
2 17000
3 25000
4 30000
5 37000
6 45000
Mean:
Mean is the average value of whole numbers. It is calculated by adding all numbers and
dividing it from total number of values. With the help of mean, Blackfriars Restaurant can
identify its consistency of performance.
Years Sales
1 11000
2 17000
3 25000
4 30000
6
⊘ This is a preview!⊘
Do you want full access?
Subscribe today to unlock all pages.
Trusted by 1+ million students worldwide
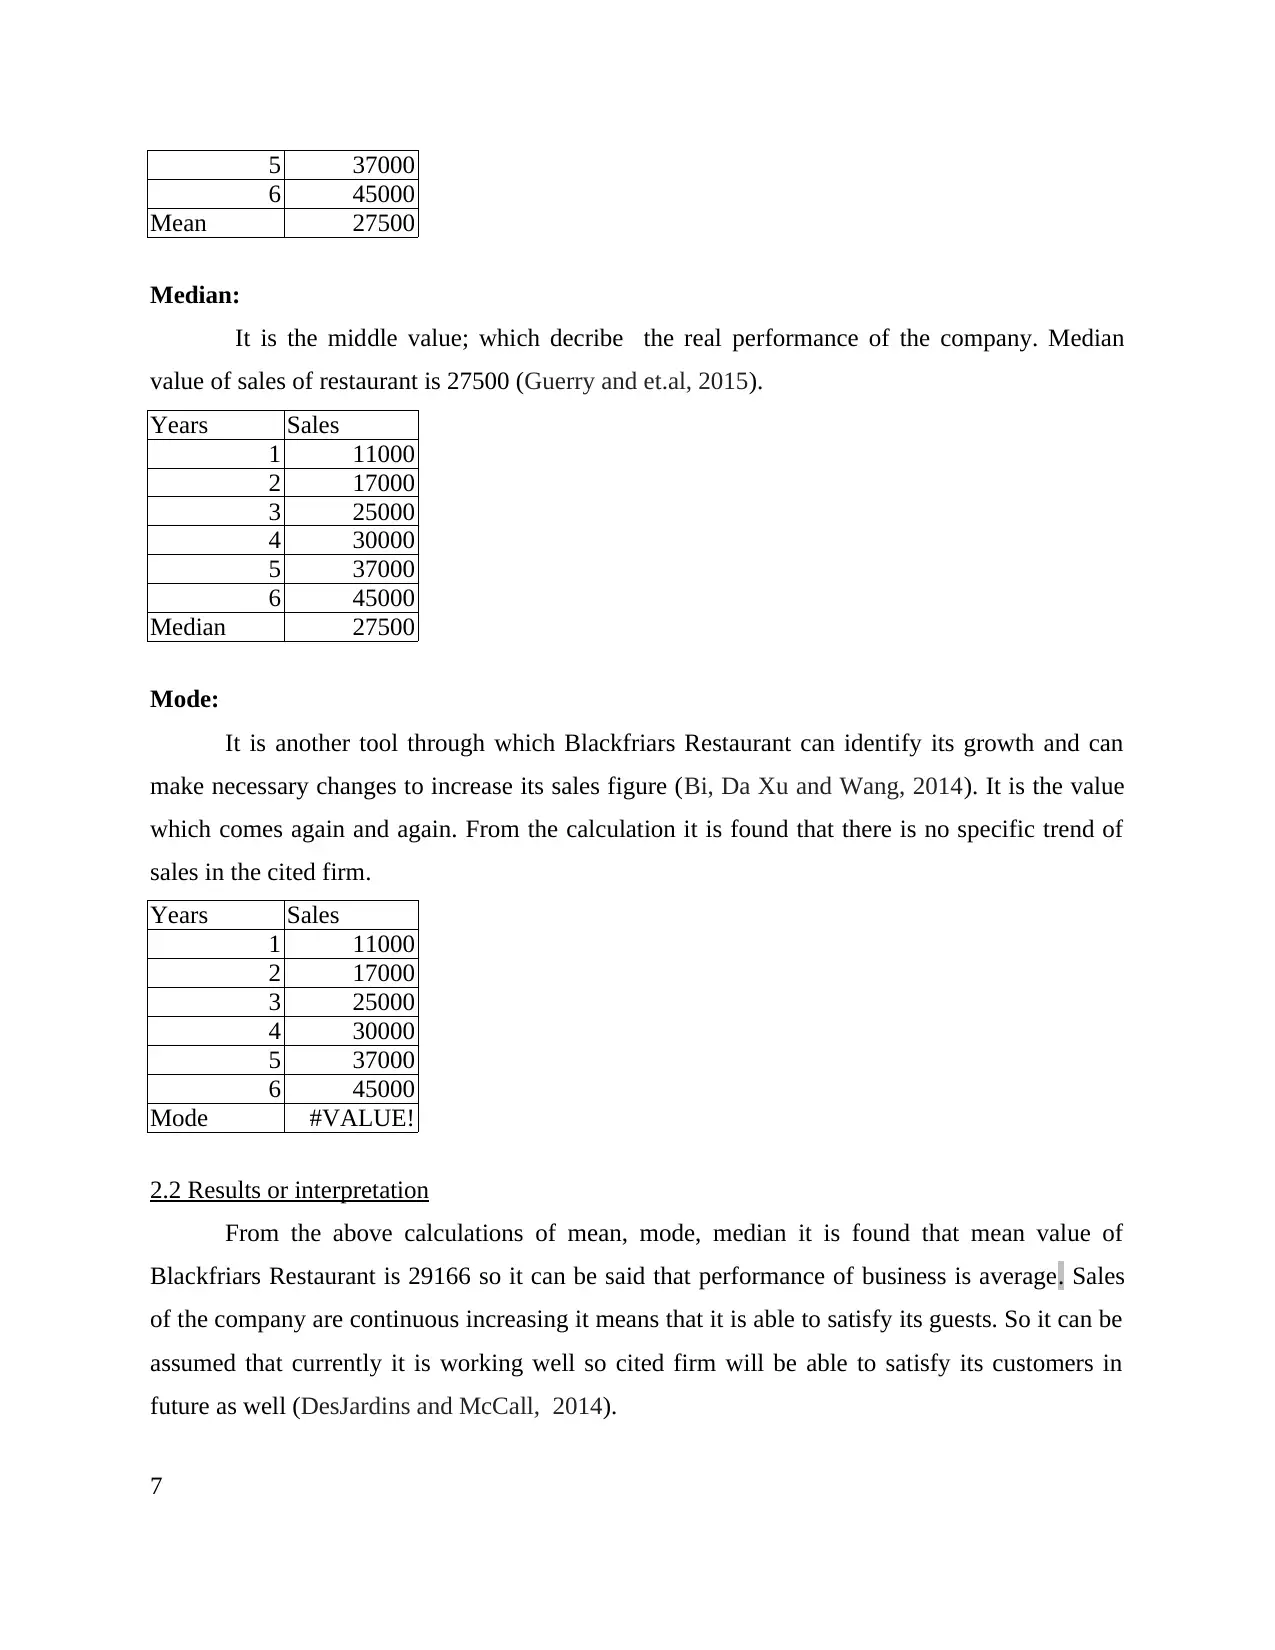
5 37000
6 45000
Mean 27500
Median:
It is the middle value; which decribe the real performance of the company. Median
value of sales of restaurant is 27500 (Guerry and et.al, 2015).
Years Sales
1 11000
2 17000
3 25000
4 30000
5 37000
6 45000
Median 27500
Mode:
It is another tool through which Blackfriars Restaurant can identify its growth and can
make necessary changes to increase its sales figure (Bi, Da Xu and Wang, 2014). It is the value
which comes again and again. From the calculation it is found that there is no specific trend of
sales in the cited firm.
Years Sales
1 11000
2 17000
3 25000
4 30000
5 37000
6 45000
Mode #VALUE!
2.2 Results or interpretation
From the above calculations of mean, mode, median it is found that mean value of
Blackfriars Restaurant is 29166 so it can be said that performance of business is average. Sales
of the company are continuous increasing it means that it is able to satisfy its guests. So it can be
assumed that currently it is working well so cited firm will be able to satisfy its customers in
future as well (DesJardins and McCall, 2014).
7
6 45000
Mean 27500
Median:
It is the middle value; which decribe the real performance of the company. Median
value of sales of restaurant is 27500 (Guerry and et.al, 2015).
Years Sales
1 11000
2 17000
3 25000
4 30000
5 37000
6 45000
Median 27500
Mode:
It is another tool through which Blackfriars Restaurant can identify its growth and can
make necessary changes to increase its sales figure (Bi, Da Xu and Wang, 2014). It is the value
which comes again and again. From the calculation it is found that there is no specific trend of
sales in the cited firm.
Years Sales
1 11000
2 17000
3 25000
4 30000
5 37000
6 45000
Mode #VALUE!
2.2 Results or interpretation
From the above calculations of mean, mode, median it is found that mean value of
Blackfriars Restaurant is 29166 so it can be said that performance of business is average. Sales
of the company are continuous increasing it means that it is able to satisfy its guests. So it can be
assumed that currently it is working well so cited firm will be able to satisfy its customers in
future as well (DesJardins and McCall, 2014).
7
Paraphrase This Document
Need a fresh take? Get an instant paraphrase of this document with our AI Paraphraser
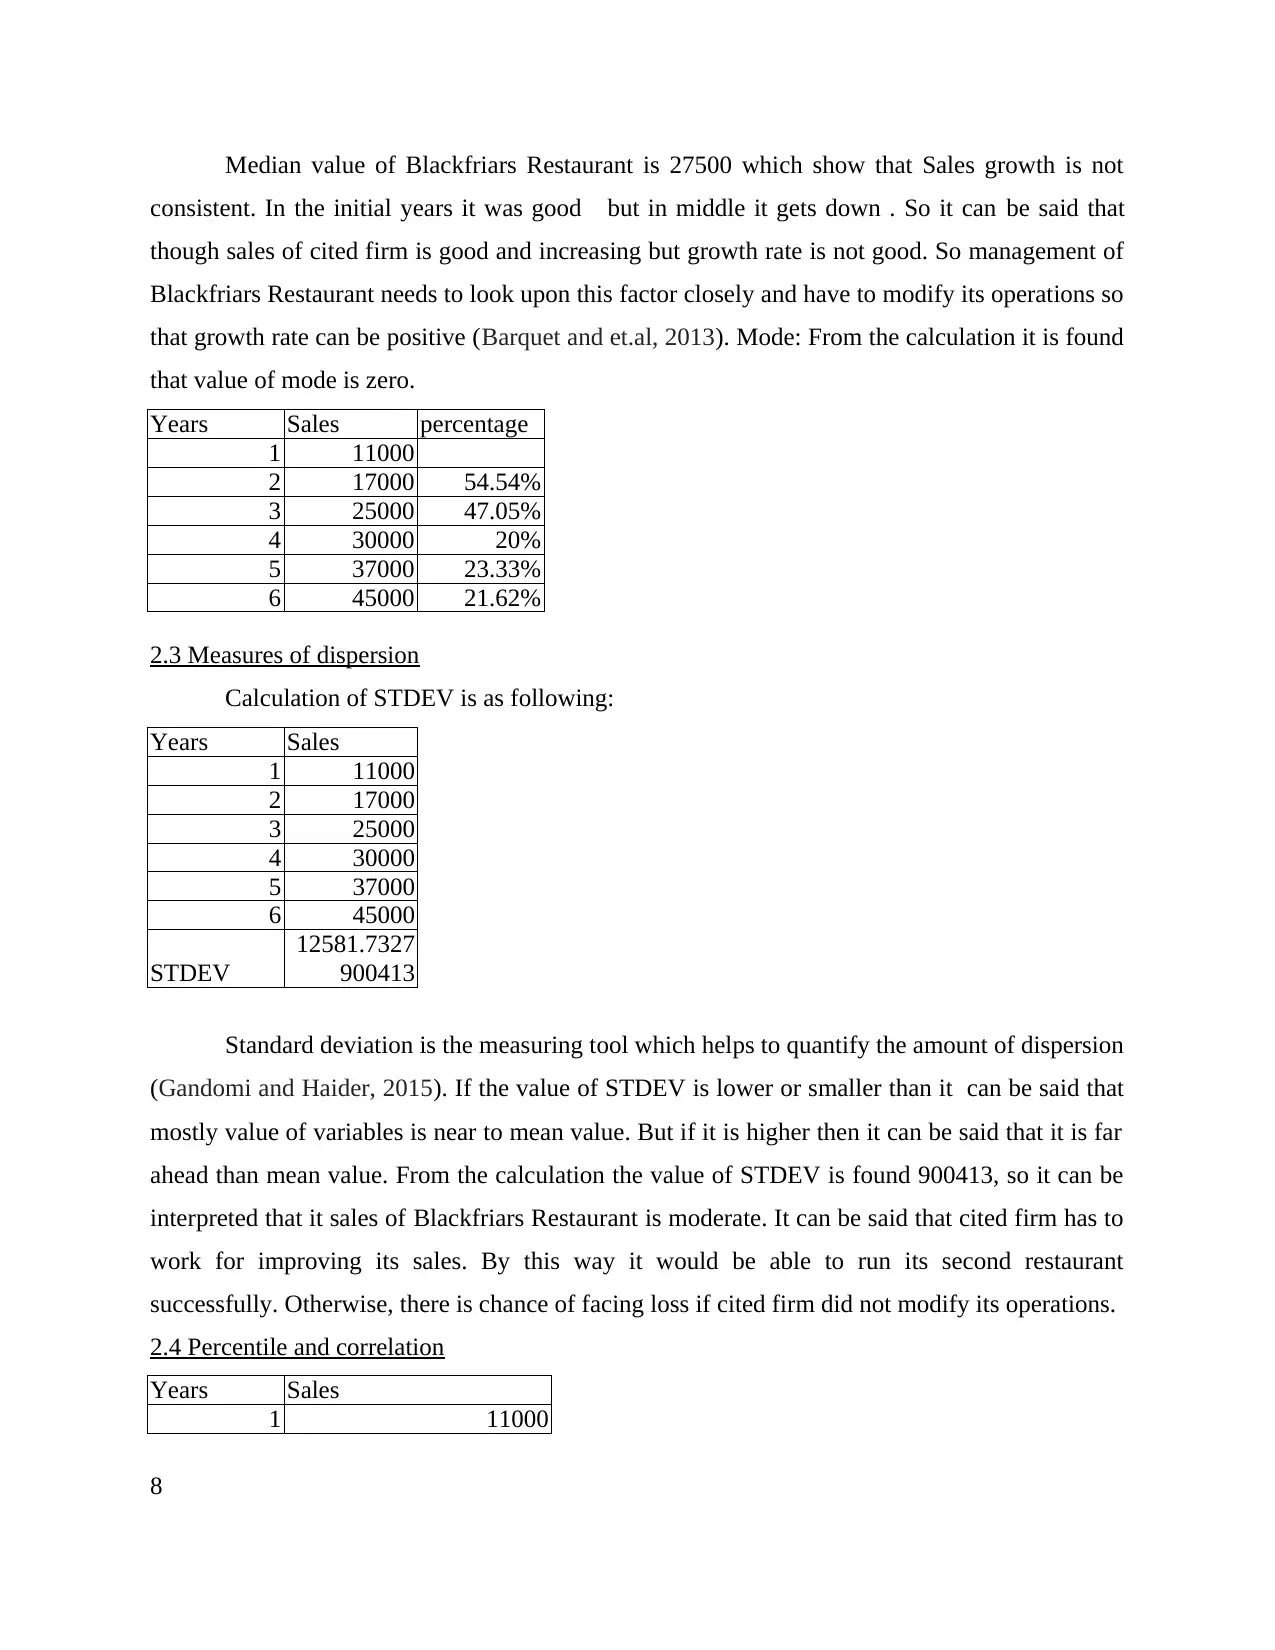
Median value of Blackfriars Restaurant is 27500 which show that Sales growth is not
consistent. In the initial years it was good but in middle it gets down . So it can be said that
though sales of cited firm is good and increasing but growth rate is not good. So management of
Blackfriars Restaurant needs to look upon this factor closely and have to modify its operations so
that growth rate can be positive (Barquet and et.al, 2013). Mode: From the calculation it is found
that value of mode is zero.
Years Sales percentage
1 11000
2 17000 54.54%
3 25000 47.05%
4 30000 20%
5 37000 23.33%
6 45000 21.62%
2.3 Measures of dispersion
Calculation of STDEV is as following:
Years Sales
1 11000
2 17000
3 25000
4 30000
5 37000
6 45000
STDEV
12581.7327
900413
Standard deviation is the measuring tool which helps to quantify the amount of dispersion
(Gandomi and Haider, 2015). If the value of STDEV is lower or smaller than it can be said that
mostly value of variables is near to mean value. But if it is higher then it can be said that it is far
ahead than mean value. From the calculation the value of STDEV is found 900413, so it can be
interpreted that it sales of Blackfriars Restaurant is moderate. It can be said that cited firm has to
work for improving its sales. By this way it would be able to run its second restaurant
successfully. Otherwise, there is chance of facing loss if cited firm did not modify its operations.
2.4 Percentile and correlation
Years Sales
1 11000
8
2 17000
3 25000
4 30000
5 37000
6 45000
Q1or P1 19000
Q2or P2 27500
Q3 or P3 35250
Coorelation 1
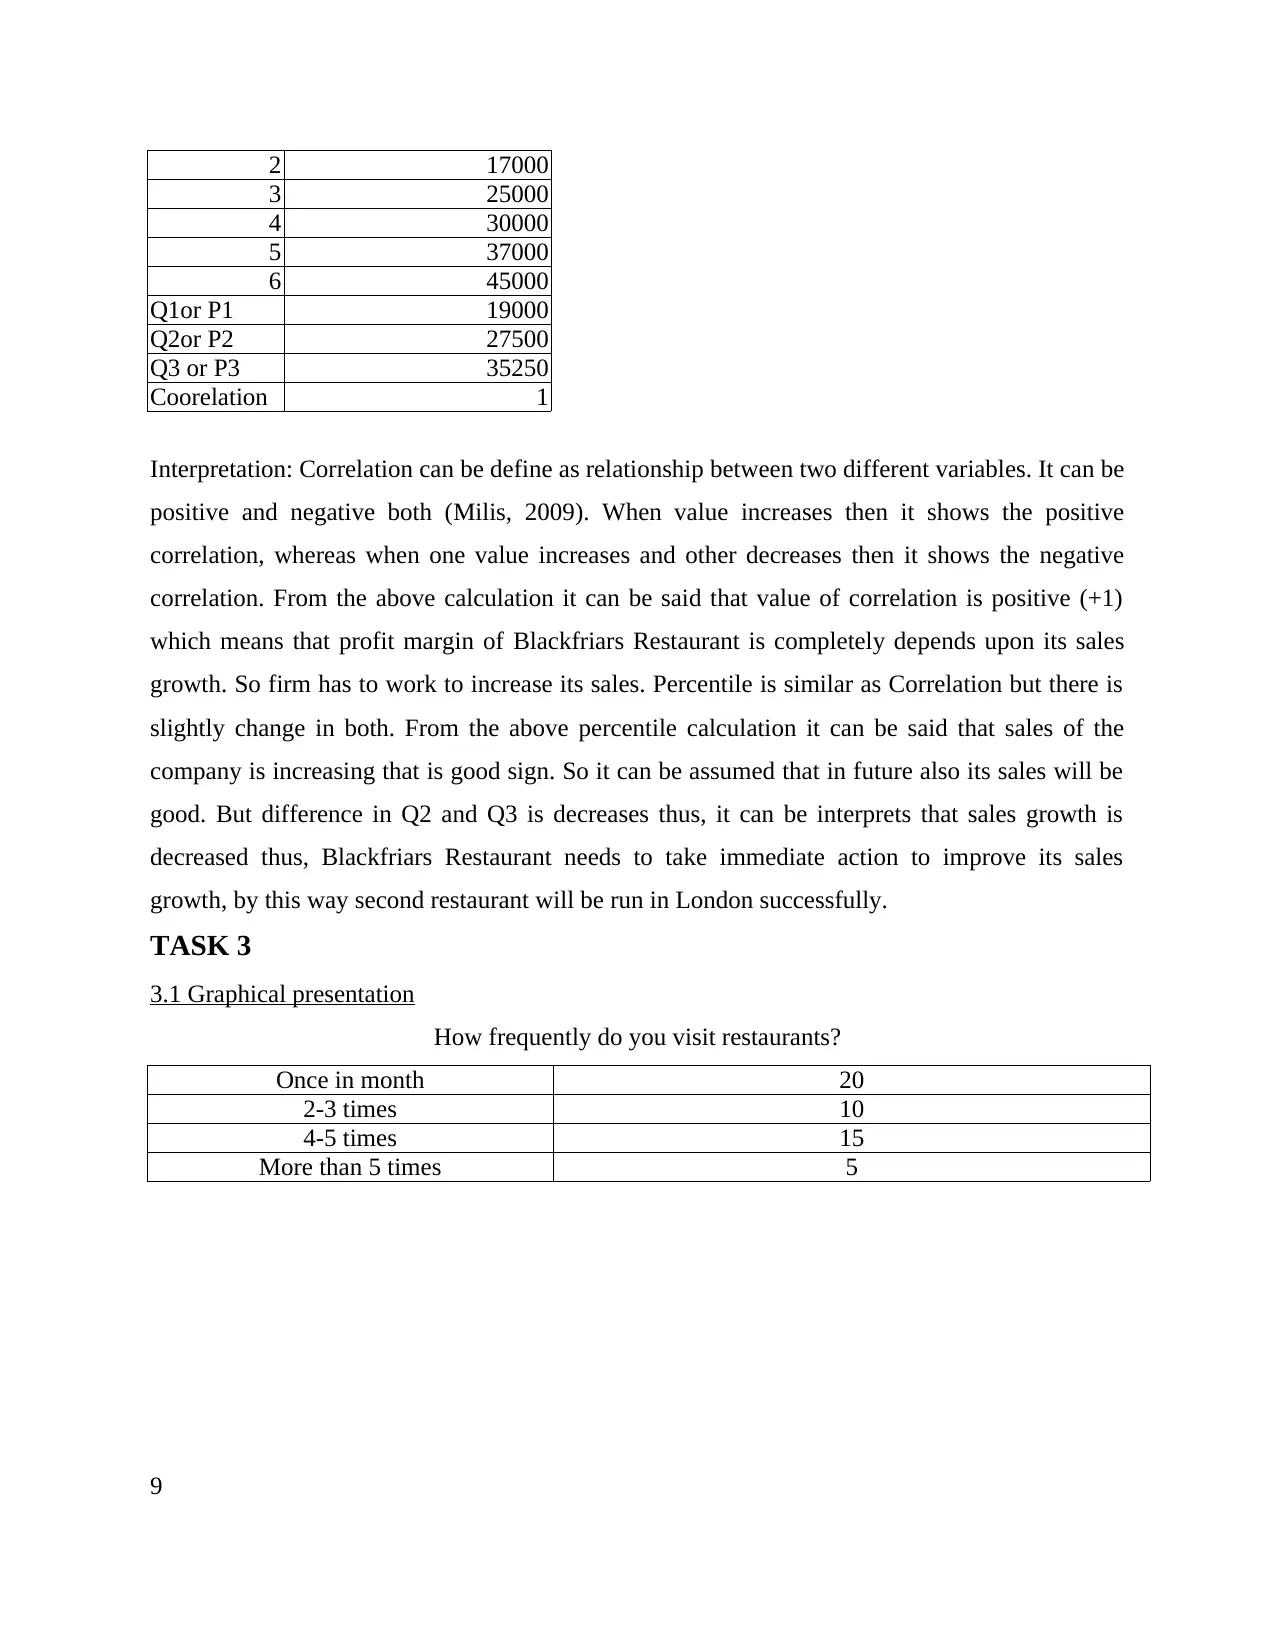
Interpretation: Correlation can be define as relationship between two different variables. It can be
positive and negative both (Milis, 2009). When value increases then it shows the positive
correlation, whereas when one value increases and other decreases then it shows the negative
correlation. From the above calculation it can be said that value of correlation is positive (+1)
which means that profit margin of Blackfriars Restaurant is completely depends upon its sales
growth. So firm has to work to increase its sales. Percentile is similar as Correlation but there is
slightly change in both. From the above percentile calculation it can be said that sales of the
company is increasing that is good sign. So it can be assumed that in future also its sales will be
good. But difference in Q2 and Q3 is decreases thus, it can be interprets that sales growth is
decreased thus, Blackfriars Restaurant needs to take immediate action to improve its sales
growth, by this way second restaurant will be run in London successfully.
TASK 3
3.1 Graphical presentation
How frequently do you visit restaurants?
Once in month 20
2-3 times 10
4-5 times 15
More than 5 times 5
9
3 25000
4 30000
5 37000
6 45000
Q1or P1 19000
Q2or P2 27500
Q3 or P3 35250
Coorelation 1
Interpretation: Correlation can be define as relationship between two different variables. It can be
positive and negative both (Milis, 2009). When value increases then it shows the positive
correlation, whereas when one value increases and other decreases then it shows the negative
correlation. From the above calculation it can be said that value of correlation is positive (+1)
which means that profit margin of Blackfriars Restaurant is completely depends upon its sales
growth. So firm has to work to increase its sales. Percentile is similar as Correlation but there is
slightly change in both. From the above percentile calculation it can be said that sales of the
company is increasing that is good sign. So it can be assumed that in future also its sales will be
good. But difference in Q2 and Q3 is decreases thus, it can be interprets that sales growth is
decreased thus, Blackfriars Restaurant needs to take immediate action to improve its sales
growth, by this way second restaurant will be run in London successfully.
TASK 3
3.1 Graphical presentation
How frequently do you visit restaurants?
Once in month 20
2-3 times 10
4-5 times 15
More than 5 times 5
9
⊘ This is a preview!⊘
Do you want full access?
Subscribe today to unlock all pages.
Trusted by 1+ million students worldwide
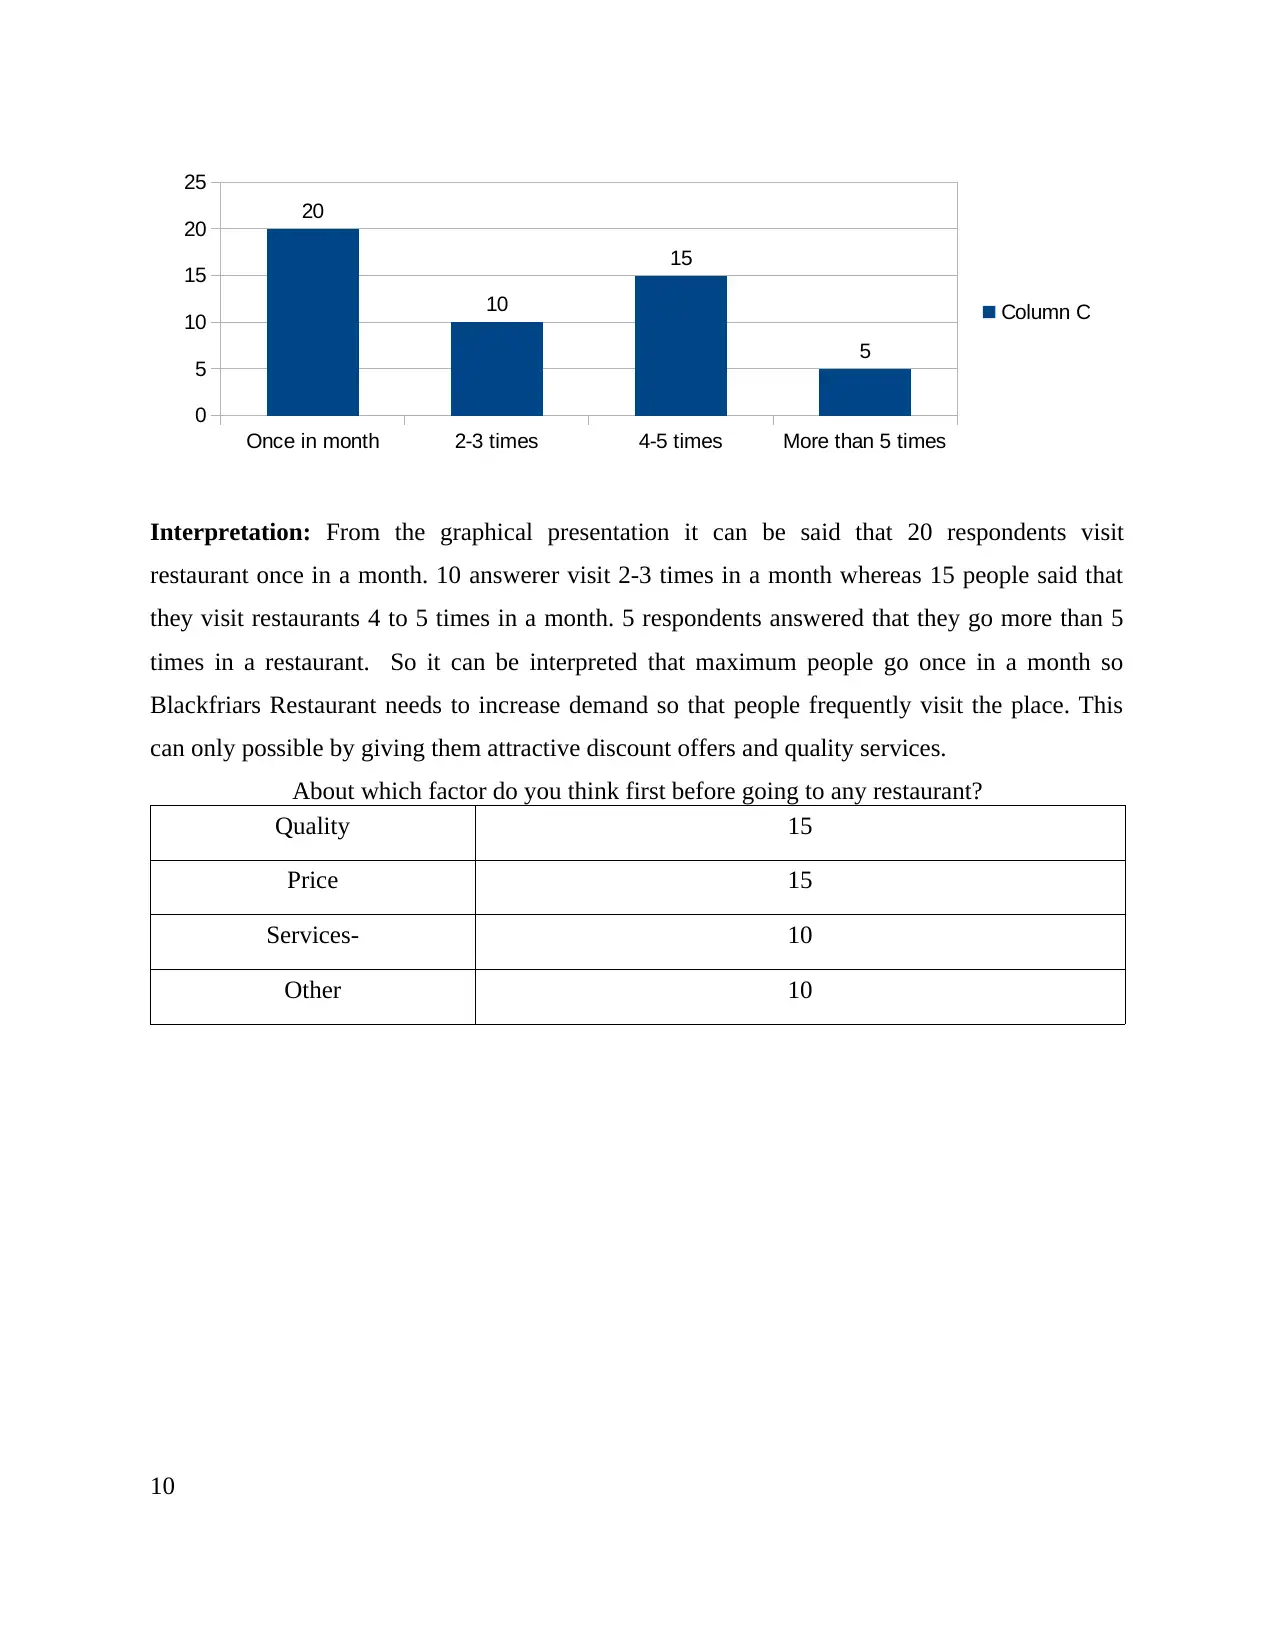
Interpretation: From the graphical presentation it can be said that 20 respondents visit
restaurant once in a month. 10 answerer visit 2-3 times in a month whereas 15 people said that
they visit restaurants 4 to 5 times in a month. 5 respondents answered that they go more than 5
times in a restaurant. So it can be interpreted that maximum people go once in a month so
Blackfriars Restaurant needs to increase demand so that people frequently visit the place. This
can only possible by giving them attractive discount offers and quality services.
About which factor do you think first before going to any restaurant?
Quality 15
Price 15
Services- 10
Other 10
10
Once in month 2-3 times 4-5 times More than 5 times
0
5
10
15
20
25
20
10
15
5
Column C
Paraphrase This Document
Need a fresh take? Get an instant paraphrase of this document with our AI Paraphraser
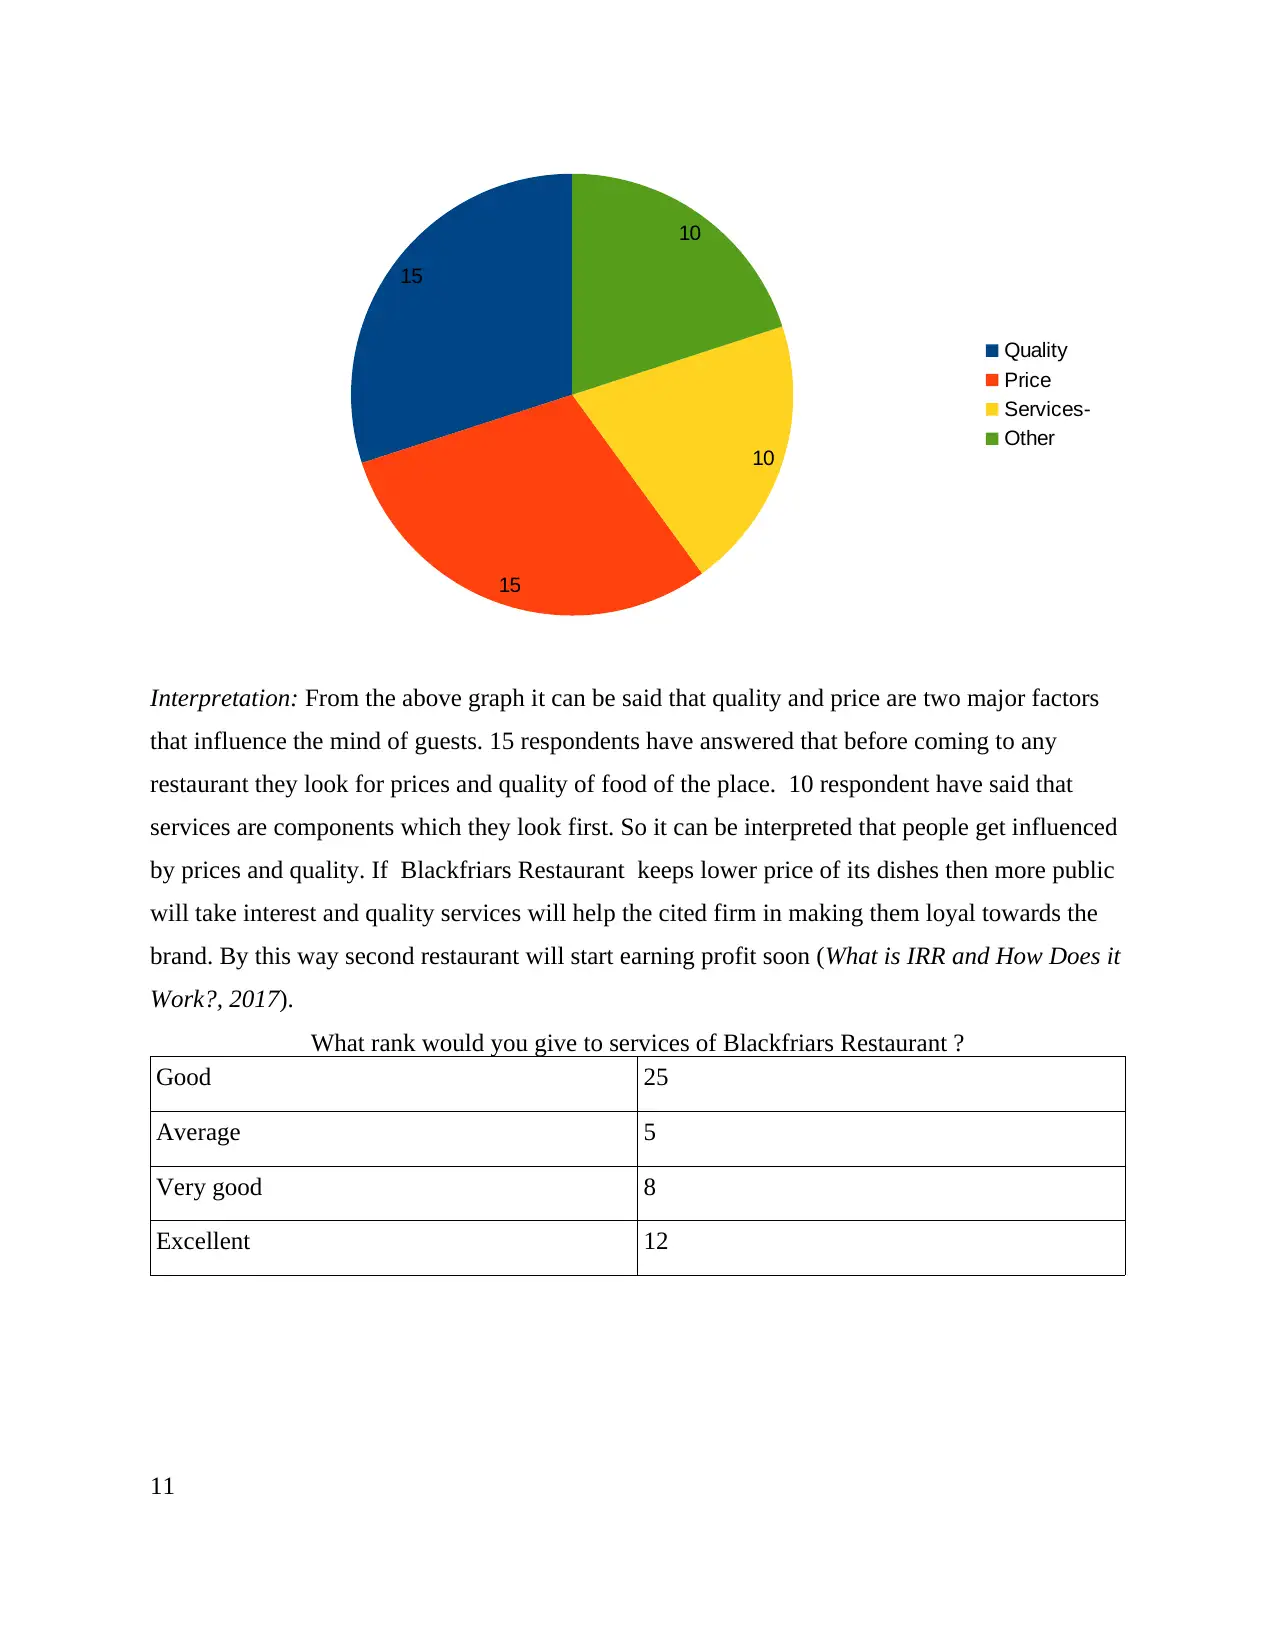
Interpretation: From the above graph it can be said that quality and price are two major factors
that influence the mind of guests. 15 respondents have answered that before coming to any
restaurant they look for prices and quality of food of the place. 10 respondent have said that
services are components which they look first. So it can be interpreted that people get influenced
by prices and quality. If Blackfriars Restaurant keeps lower price of its dishes then more public
will take interest and quality services will help the cited firm in making them loyal towards the
brand. By this way second restaurant will start earning profit soon (What is IRR and How Does it
Work?, 2017).
What rank would you give to services of Blackfriars Restaurant ?
Good 25
Average 5
Very good 8
Excellent 12
11
15
15
10
10
Quality
Price
Services-
Other
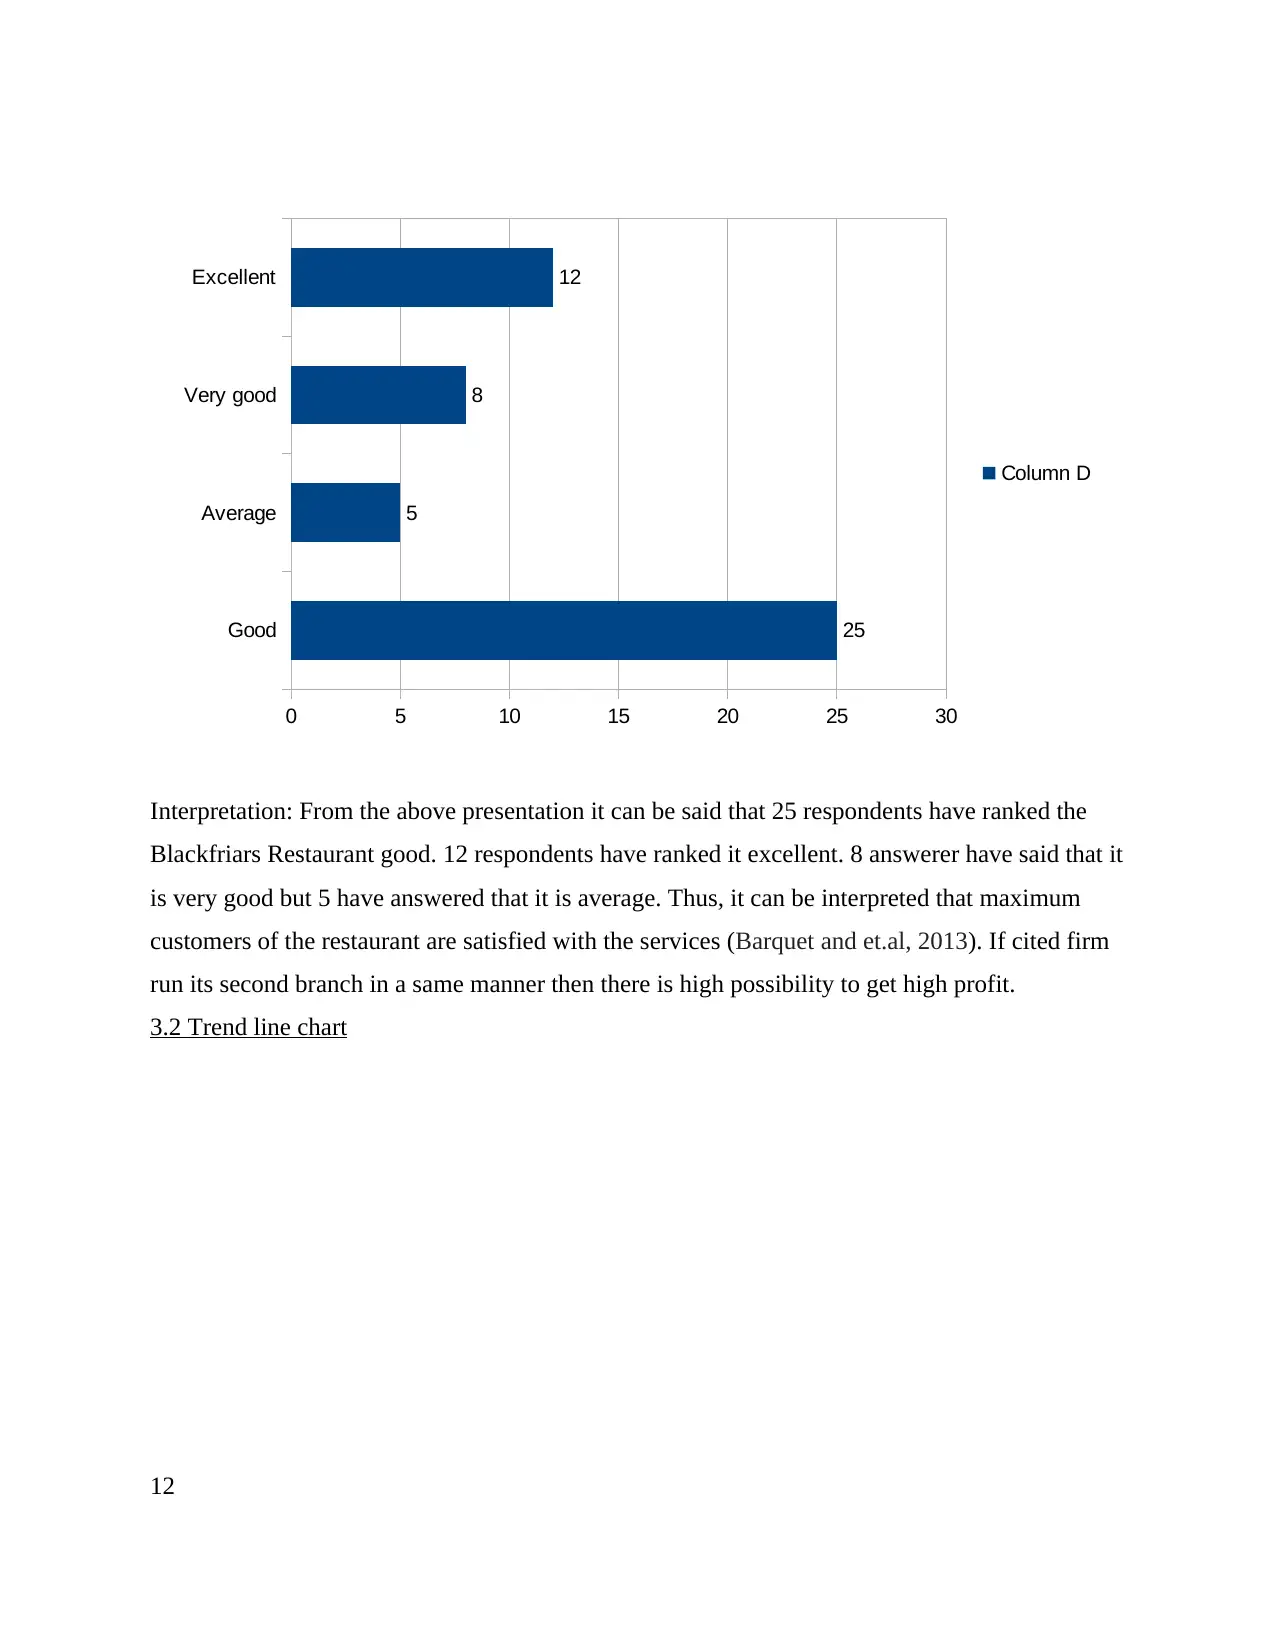
Interpretation: From the above presentation it can be said that 25 respondents have ranked the
Blackfriars Restaurant good. 12 respondents have ranked it excellent. 8 answerer have said that it
is very good but 5 have answered that it is average. Thus, it can be interpreted that maximum
customers of the restaurant are satisfied with the services (Barquet and et.al, 2013). If cited firm
run its second branch in a same manner then there is high possibility to get high profit.
3.2 Trend line chart
12
Good
Average
Very good
Excellent
0 5 10 15 20 25 30
25
5
8
12
Column D
⊘ This is a preview!⊘
Do you want full access?
Subscribe today to unlock all pages.
Trusted by 1+ million students worldwide
1 out of 18
Related Documents


Your All-in-One AI-Powered Toolkit for Academic Success.
+13062052269
info@desklib.com
Available 24*7 on WhatsApp / Email
![[object Object]](/_next/static/media/star-bottom.7253800d.svg)
Unlock your academic potential
Copyright © 2020–2026 A2Z Services. All Rights Reserved. Developed and managed by ZUCOL.