Business Decision Making Report - Unit 6, HND Business, Term 2
VerifiedAdded on 2020/09/08
|22
|3883
|30
Report
AI Summary
This report delves into the crucial aspects of business decision-making, using the case of Balti Palace restaurant's expansion plans in London. The report begins by outlining the importance of effective business strategies and the need for data collection tools. Task 1 focuses on data collection, differentiating between primary and secondary data, discussing their advantages and disadvantages, and creating a data collection plan. It also covers survey methodologies, sampling frames, and the design of a questionnaire for gathering market insights. Task 2 analyzes the collected data, including sales and profitability from 2008 to 2017, using mean, median, and mode for forecasting and strategic planning. The report further analyzes the results and examines measures of dispersion to inform business decisions. The report provides an overview of data analysis techniques and their application in a business context.

BUSINESS DECISION
MAKING
MAKING
Paraphrase This Document
Need a fresh take? Get an instant paraphrase of this document with our AI Paraphraser
INTRODUCTION
Business decisions are the crucial aspect in any business. As everyone is striving hard to make
certain business decisions so that they could make certain business strategy in order to compete
their strong contender effectively. There is a strong need to make certain tools in order to provide
effective strategy for business decisions (Hwang and Masud, 2012). Under this report, Balti
palace is striving hard to expand their business somewhere in London and for that it needs to
make research effectively. but before going to expand the business, the cited restaurant needs to
make specific research in order to know the potential marketplace in an effective manner.
however, there is a strong need to make these tools effectively.
TASK 1
1.1 Create a plan for collection for primary and secondary data:
There is a strong need to collect the data for business objectives in an effective manner.
The business objectives are framed after making business decisions effectively. Although, this
can be said that the company needs to make their business objectives so that the business can be
attained effectively (Solomon, 2014). The business plan can be made out after collecting the data
from the market place for making business decisions. There is a strong need to analyse the
market for making the plan. Primary and secondary data are made out in order to provide
effective plan. These are defined in details:
Primary data: Primary data is the data which is made out for the first time. This is the
data which take time for collecting the data (Yager and Kacprzyk, 2012). Although, this can be
said that the balti place restaurant can make their business decisions. However, this can be said
that the business objectives can be attained in order to make certain objective by collecting the
primary data methods. This is the data which reflects the great accuracy. The primary data can be
achieved in order to make certain objectives.
Advantages:
The main advantage of the primary data is to provide the justifiable information which
can be used by the researcher in order to make the plan effectively.
This is closely related to the researcher information in order to provides effective
business decisions.
1
⊘ This is a preview!⊘
Do you want full access?
Subscribe today to unlock all pages.
Trusted by 1+ million students worldwide
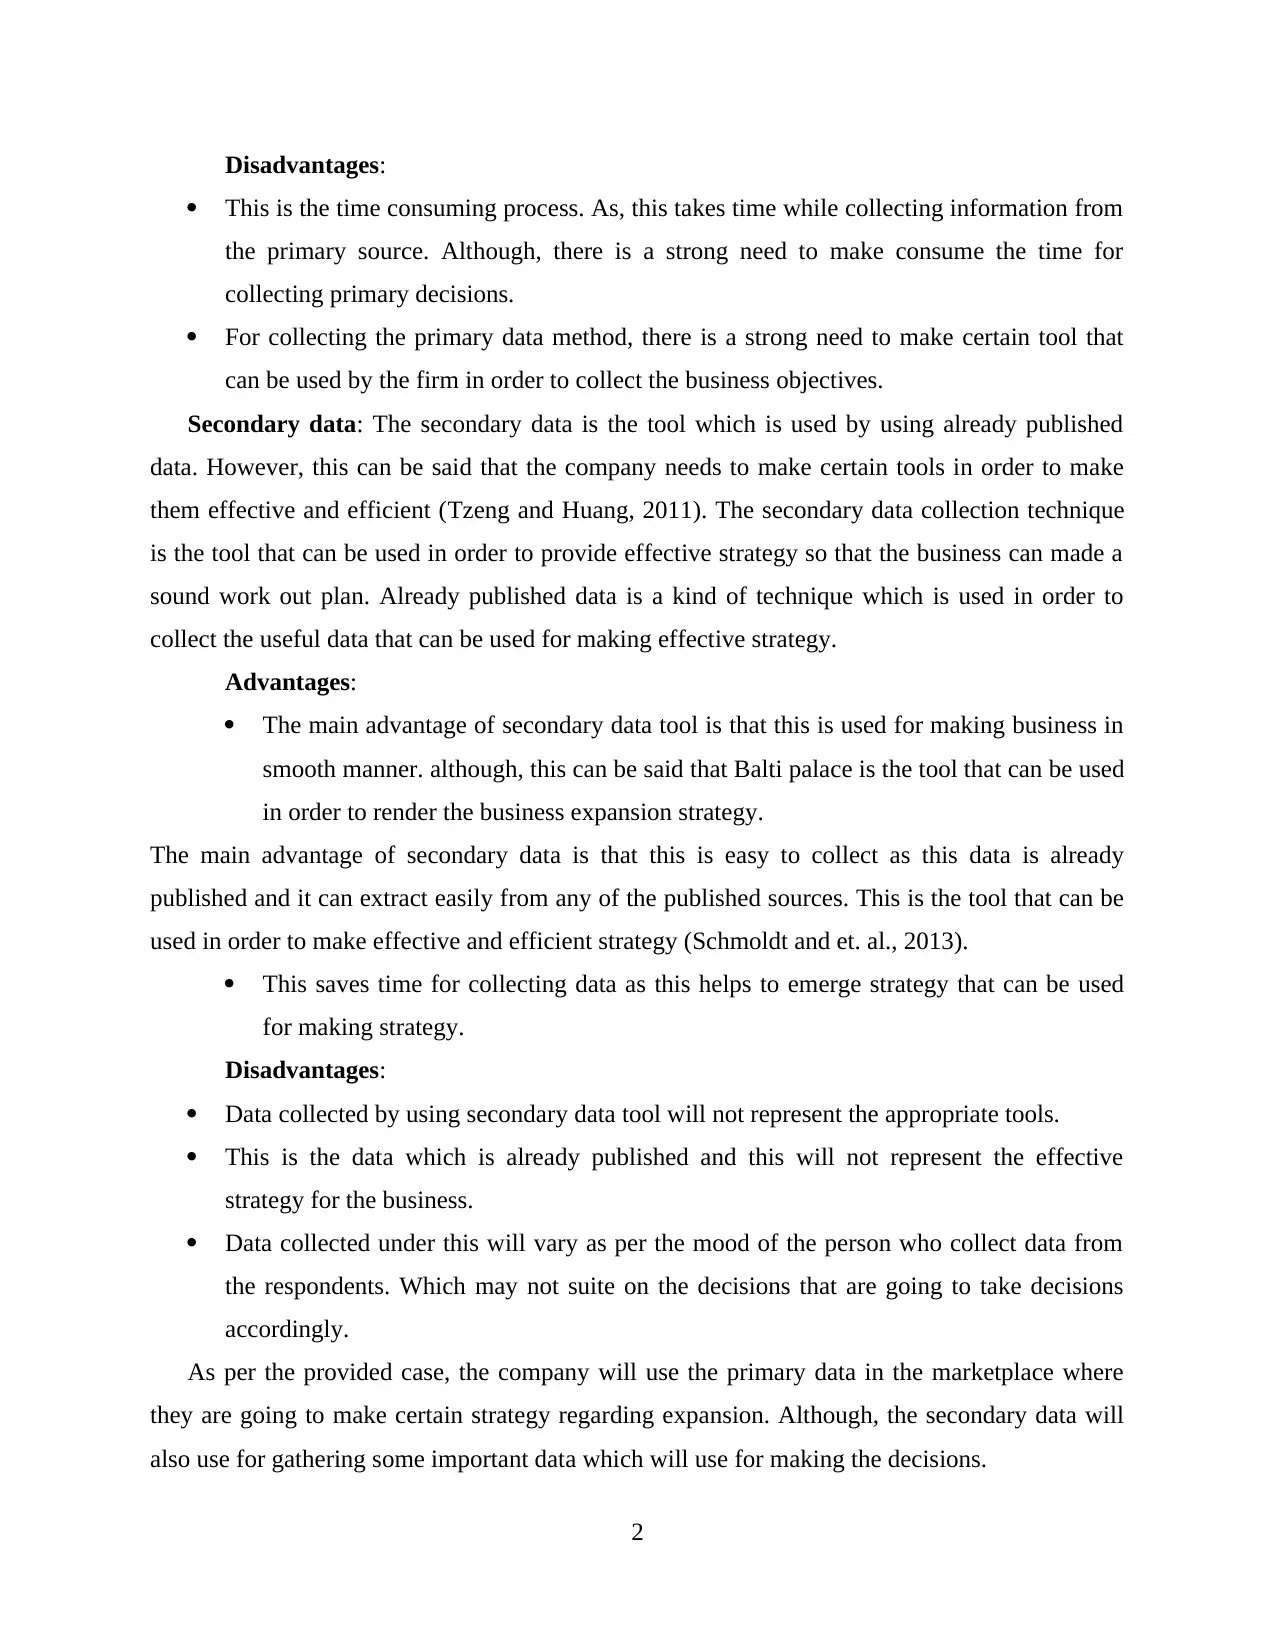
Disadvantages:
This is the time consuming process. As, this takes time while collecting information from
the primary source. Although, there is a strong need to make consume the time for
collecting primary decisions.
For collecting the primary data method, there is a strong need to make certain tool that
can be used by the firm in order to collect the business objectives.
Secondary data: The secondary data is the tool which is used by using already published
data. However, this can be said that the company needs to make certain tools in order to make
them effective and efficient (Tzeng and Huang, 2011). The secondary data collection technique
is the tool that can be used in order to provide effective strategy so that the business can made a
sound work out plan. Already published data is a kind of technique which is used in order to
collect the useful data that can be used for making effective strategy.
Advantages:
The main advantage of secondary data tool is that this is used for making business in
smooth manner. although, this can be said that Balti palace is the tool that can be used
in order to render the business expansion strategy.
The main advantage of secondary data is that this is easy to collect as this data is already
published and it can extract easily from any of the published sources. This is the tool that can be
used in order to make effective and efficient strategy (Schmoldt and et. al., 2013).
This saves time for collecting data as this helps to emerge strategy that can be used
for making strategy.
Disadvantages:
Data collected by using secondary data tool will not represent the appropriate tools.
This is the data which is already published and this will not represent the effective
strategy for the business.
Data collected under this will vary as per the mood of the person who collect data from
the respondents. Which may not suite on the decisions that are going to take decisions
accordingly.
As per the provided case, the company will use the primary data in the marketplace where
they are going to make certain strategy regarding expansion. Although, the secondary data will
also use for gathering some important data which will use for making the decisions.
2
Paraphrase This Document
Need a fresh take? Get an instant paraphrase of this document with our AI Paraphraser
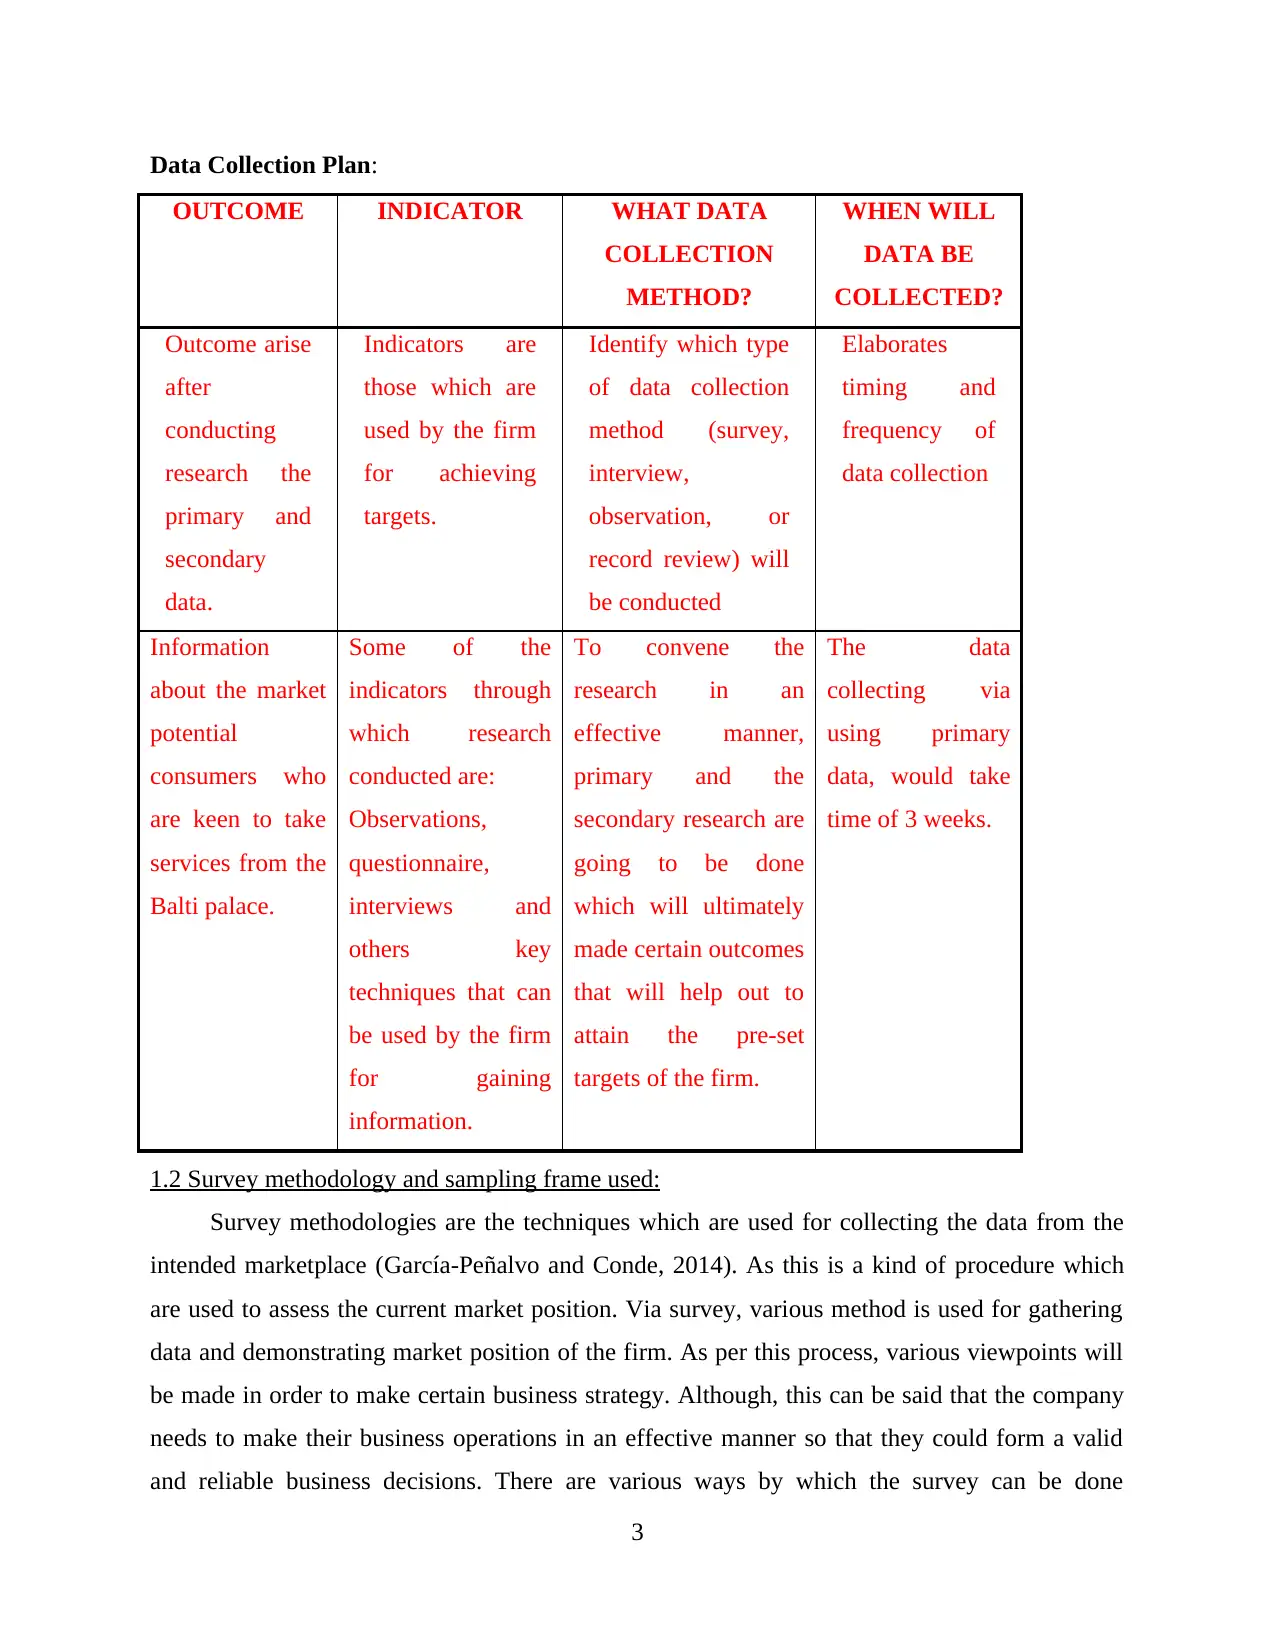
Data Collection Plan:
OUTCOME INDICATOR WHAT DATA
COLLECTION
METHOD?
WHEN WILL
DATA BE
COLLECTED?
Outcome arise
after
conducting
research the
primary and
secondary
data.
Indicators are
those which are
used by the firm
for achieving
targets.
Identify which type
of data collection
method (survey,
interview,
observation, or
record review) will
be conducted
Elaborates
timing and
frequency of
data collection
Information
about the market
potential
consumers who
are keen to take
services from the
Balti palace.
Some of the
indicators through
which research
conducted are:
Observations,
questionnaire,
interviews and
others key
techniques that can
be used by the firm
for gaining
information.
To convene the
research in an
effective manner,
primary and the
secondary research are
going to be done
which will ultimately
made certain outcomes
that will help out to
attain the pre-set
targets of the firm.
The data
collecting via
using primary
data, would take
time of 3 weeks.
1.2 Survey methodology and sampling frame used:
Survey methodologies are the techniques which are used for collecting the data from the
intended marketplace (García-Peñalvo and Conde, 2014). As this is a kind of procedure which
are used to assess the current market position. Via survey, various method is used for gathering
data and demonstrating market position of the firm. As per this process, various viewpoints will
be made in order to make certain business strategy. Although, this can be said that the company
needs to make their business operations in an effective manner so that they could form a valid
and reliable business decisions. There are various ways by which the survey can be done
3
effectively. although, interviews, observations, questionnaire, sampling and others. these all are
used in order to make certain information by way of collecting from the various respondents.
These are defined in details:
Interviews: This is a kind of survey tool which is used by the researcher for collecting the
information face to face from the respondents. Although, this can be said that it is time
consuming survey method (Maxwell, Jeffrey and Lévesque, 2011). But this gives an effective
and efficient data information so that the appropriate information can be generated.
Questionnaire: In this the tool, this can be said that researcher forms questionnaire which
covers various questions which are going to ask form the respondents. Although, respondents
give answers to their questions in order to make certain objectives effectively. For doing current
research, researcher adopt 30 respondents could be attained.
Sampling: Under this sampling tool, researcher implements diverse tools and techniques
which is simple, cluster, random sampling tools and much more. Henceforth, the researcher
would choose respondents via random sampling method which would help out to make specific
information (Sköld, Alm and Scholz ., 2013).
In this given scenario, there is a strong need to make effective survey tool which would help out
to make certain strategy by collecting the data by using random sampling method. Although, the
cited restaurant needs to adopt important strategy by using these survey methodologies (Bayne
and Woolcock, 2011). In the given research, Balti palace used questionnaire method for
convening the research which are going to get the efficient outcome for the firm. Questionnaire
of the research assist in order to make certain tools which will ultimately assist restaurant to gain
its pre-set targets.
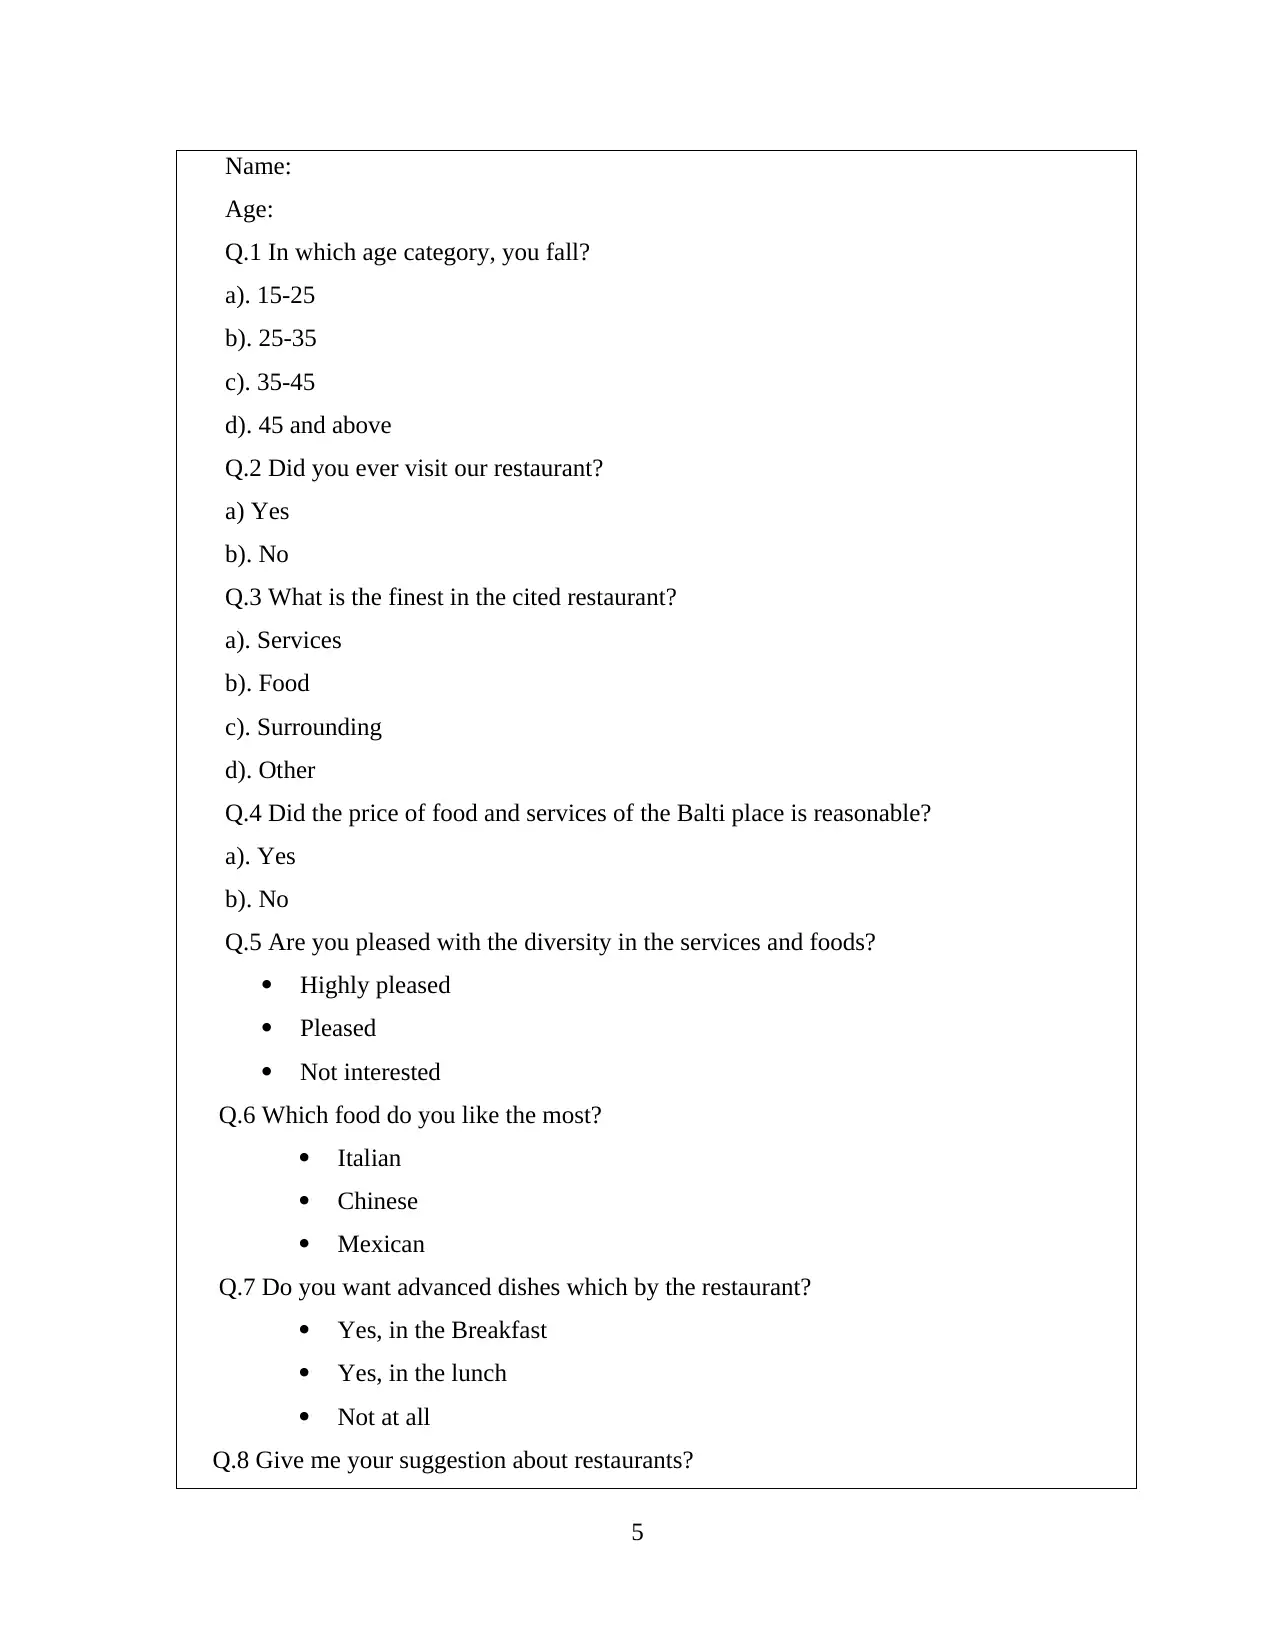
1.3 Questionnaire:
This is questionnaire which covers various questions which are exclusively related to the
services rendered by the firm and gathering respondents’ opinion on its performance.
Questionnaire is a kind of research tool which covers of list of questions to gather information
connected to the college’s performance. Under this, researcher helps following questions
connected to college’s performance. Under this, researcher asks so many questions which are
related to the restaurant’s quality and others.
Questionnaire
4
used in order to make certain information by way of collecting from the various respondents.
These are defined in details:
Interviews: This is a kind of survey tool which is used by the researcher for collecting the
information face to face from the respondents. Although, this can be said that it is time
consuming survey method (Maxwell, Jeffrey and Lévesque, 2011). But this gives an effective
and efficient data information so that the appropriate information can be generated.
Questionnaire: In this the tool, this can be said that researcher forms questionnaire which
covers various questions which are going to ask form the respondents. Although, respondents
give answers to their questions in order to make certain objectives effectively. For doing current
research, researcher adopt 30 respondents could be attained.
Sampling: Under this sampling tool, researcher implements diverse tools and techniques
which is simple, cluster, random sampling tools and much more. Henceforth, the researcher
would choose respondents via random sampling method which would help out to make specific
information (Sköld, Alm and Scholz ., 2013).
In this given scenario, there is a strong need to make effective survey tool which would help out
to make certain strategy by collecting the data by using random sampling method. Although, the
cited restaurant needs to adopt important strategy by using these survey methodologies (Bayne
and Woolcock, 2011). In the given research, Balti palace used questionnaire method for
convening the research which are going to get the efficient outcome for the firm. Questionnaire
of the research assist in order to make certain tools which will ultimately assist restaurant to gain
its pre-set targets.
1.3 Questionnaire:
This is questionnaire which covers various questions which are exclusively related to the
services rendered by the firm and gathering respondents’ opinion on its performance.
Questionnaire is a kind of research tool which covers of list of questions to gather information
connected to the college’s performance. Under this, researcher helps following questions
connected to college’s performance. Under this, researcher asks so many questions which are
related to the restaurant’s quality and others.
Questionnaire
4
⊘ This is a preview!⊘
Do you want full access?
Subscribe today to unlock all pages.
Trusted by 1+ million students worldwide
Name:
Age:
Q.1 In which age category, you fall?
a). 15-25
b). 25-35
c). 35-45
d). 45 and above
Q.2 Did you ever visit our restaurant?
a) Yes
b). No
Q.3 What is the finest in the cited restaurant?
a). Services
b). Food
c). Surrounding
d). Other
Q.4 Did the price of food and services of the Balti place is reasonable?
a). Yes
b). No
Q.5 Are you pleased with the diversity in the services and foods?
Highly pleased
Pleased
Not interested
Q.6 Which food do you like the most?
Italian
Chinese
Mexican
Q.7 Do you want advanced dishes which by the restaurant?
Yes, in the Breakfast
Yes, in the lunch
Not at all
Q.8 Give me your suggestion about restaurants?
5
Paraphrase This Document
Need a fresh take? Get an instant paraphrase of this document with our AI Paraphraser
Prime location
Country side
Q.9 Did you want to attain unique on festivals?
Agree
Disagree
Q.10 Give your suggestion?
Ans:…..
TASK 2
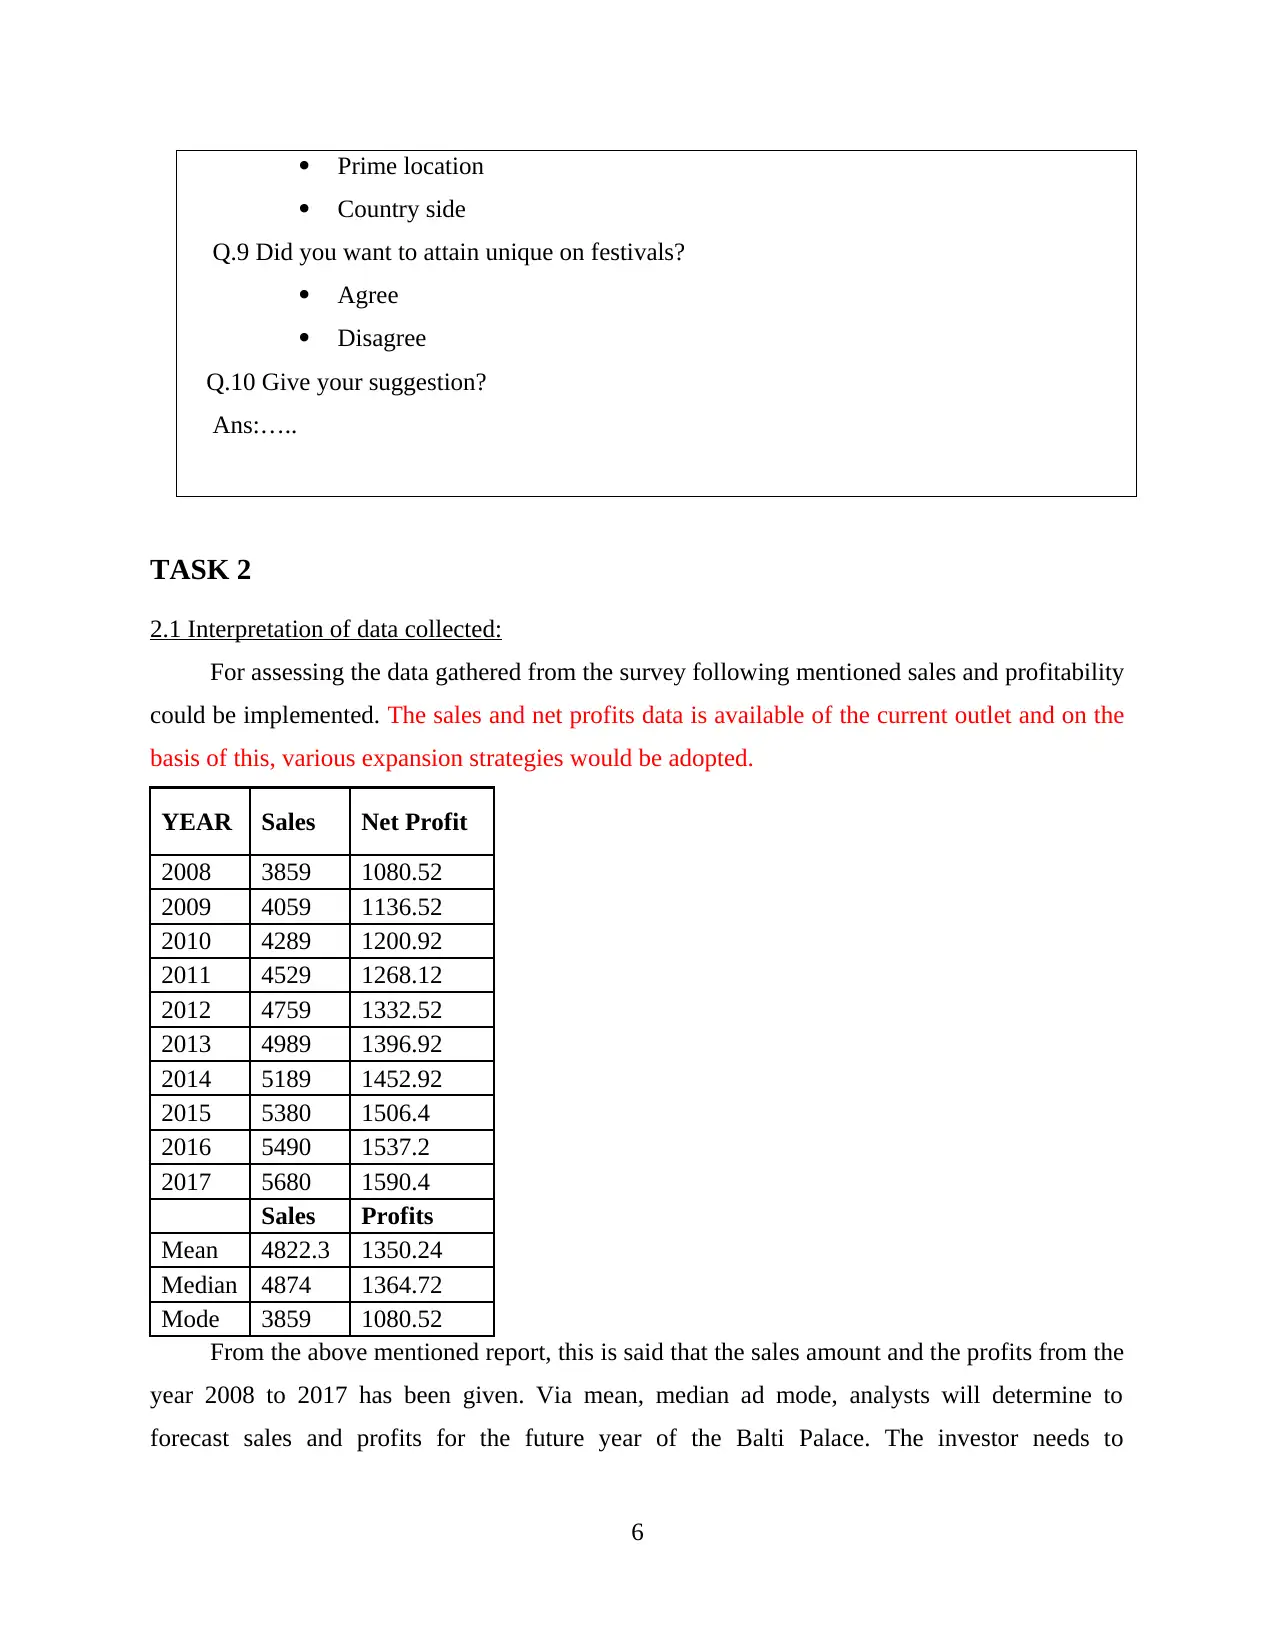
2.1 Interpretation of data collected:
For assessing the data gathered from the survey following mentioned sales and profitability
could be implemented. The sales and net profits data is available of the current outlet and on the
basis of this, various expansion strategies would be adopted.
YEAR Sales Net Profit
2008 3859 1080.52
2009 4059 1136.52
2010 4289 1200.92
2011 4529 1268.12
2012 4759 1332.52
2013 4989 1396.92
2014 5189 1452.92
2015 5380 1506.4
2016 5490 1537.2
2017 5680 1590.4
Sales Profits
Mean 4822.3 1350.24
Median 4874 1364.72
Mode 3859 1080.52
From the above mentioned report, this is said that the sales amount and the profits from the
year 2008 to 2017 has been given. Via mean, median ad mode, analysts will determine to
forecast sales and profits for the future year of the Balti Palace. The investor needs to
6
Country side
Q.9 Did you want to attain unique on festivals?
Agree
Disagree
Q.10 Give your suggestion?
Ans:…..
TASK 2
2.1 Interpretation of data collected:
For assessing the data gathered from the survey following mentioned sales and profitability
could be implemented. The sales and net profits data is available of the current outlet and on the
basis of this, various expansion strategies would be adopted.
YEAR Sales Net Profit
2008 3859 1080.52
2009 4059 1136.52
2010 4289 1200.92
2011 4529 1268.12
2012 4759 1332.52
2013 4989 1396.92
2014 5189 1452.92
2015 5380 1506.4
2016 5490 1537.2
2017 5680 1590.4
Sales Profits
Mean 4822.3 1350.24
Median 4874 1364.72
Mode 3859 1080.52
From the above mentioned report, this is said that the sales amount and the profits from the
year 2008 to 2017 has been given. Via mean, median ad mode, analysts will determine to
forecast sales and profits for the future year of the Balti Palace. The investor needs to
6
implements provided information in order to render an effective strategy. This would help to
estimate future requirements for division in order to identify their exact problems.
2.2 Analyse the results
Mean: This is the average value of the set of observation which are implemented at the
time of research procedure (Simon, 2015). Under static analysis, the total number is considered
by covering them together and could divide total number of group. This related to calculate
critical measure to get desired outcomes. This is used by using: Mean: ∑X/N.
Median: It is the middle number out of set of observation. This renders the value of total
variable implemented in the research practice are lie 50% above. This is important to divide
observation into the two main parts to identify exact amount. Median is calculated by using:
[L1 + (N/2) – c/F*i].
Here,
L1= Lower value of the range.
C= Cumulative frequency
F= Frequency
I= Interval
Mode: This is calculated as the most repetitive number which are accessible into the
observation. As per this, factors are identified by evaluating data in highly effective manner. via
evaluating mode, information could assess them to assess business decisions. As per the gathered
information from sales and profits mode is calculated. The mode is calculated by using following
mentioned tools. Mode is calculated by using: L + h ( fm – f1 / 2fm – f1 - f2 ).
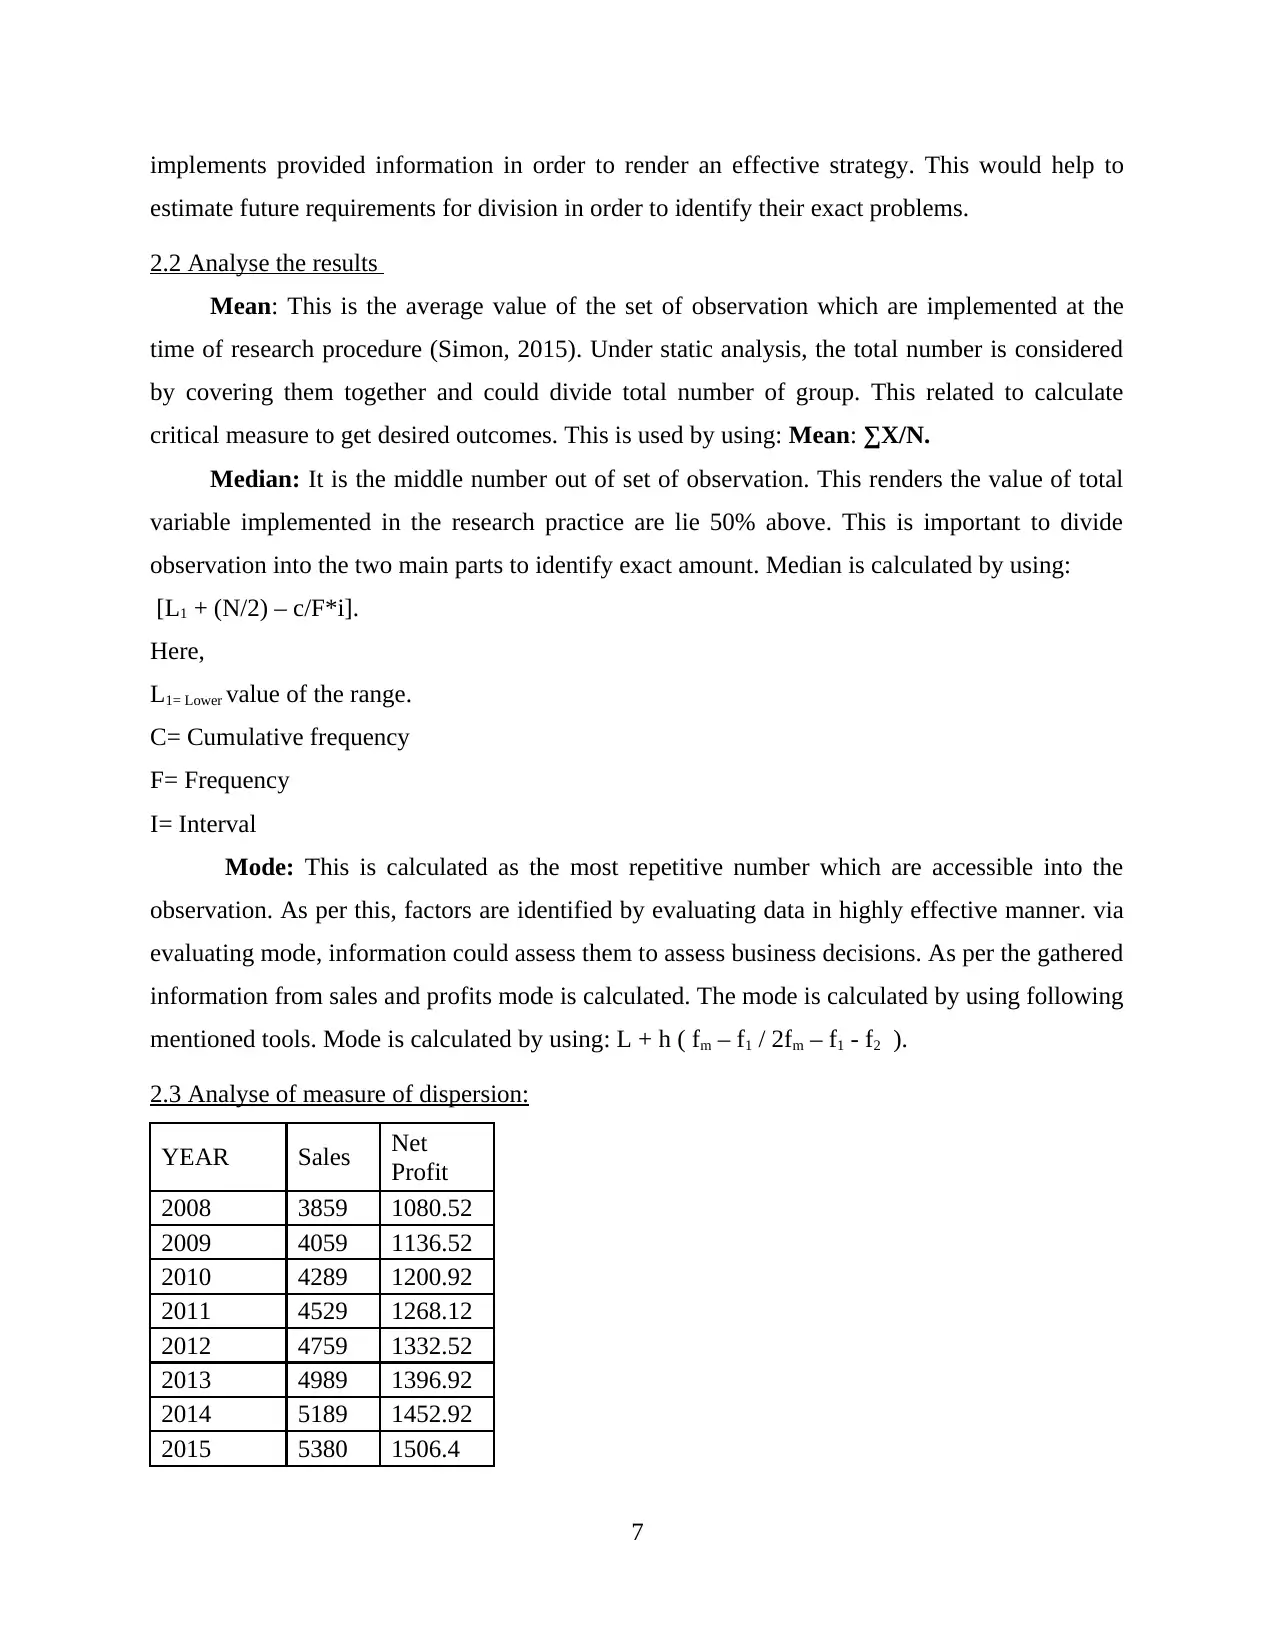
2.3 Analyse of measure of dispersion:
YEAR Sales Net
Profit
2008 3859 1080.52
2009 4059 1136.52
2010 4289 1200.92
2011 4529 1268.12
2012 4759 1332.52
2013 4989 1396.92
2014 5189 1452.92
2015 5380 1506.4
7
estimate future requirements for division in order to identify their exact problems.
2.2 Analyse the results
Mean: This is the average value of the set of observation which are implemented at the
time of research procedure (Simon, 2015). Under static analysis, the total number is considered
by covering them together and could divide total number of group. This related to calculate
critical measure to get desired outcomes. This is used by using: Mean: ∑X/N.
Median: It is the middle number out of set of observation. This renders the value of total
variable implemented in the research practice are lie 50% above. This is important to divide
observation into the two main parts to identify exact amount. Median is calculated by using:
[L1 + (N/2) – c/F*i].
Here,
L1= Lower value of the range.
C= Cumulative frequency
F= Frequency
I= Interval
Mode: This is calculated as the most repetitive number which are accessible into the
observation. As per this, factors are identified by evaluating data in highly effective manner. via
evaluating mode, information could assess them to assess business decisions. As per the gathered
information from sales and profits mode is calculated. The mode is calculated by using following
mentioned tools. Mode is calculated by using: L + h ( fm – f1 / 2fm – f1 - f2 ).
2.3 Analyse of measure of dispersion:
YEAR Sales Net
Profit
2008 3859 1080.52
2009 4059 1136.52
2010 4289 1200.92
2011 4529 1268.12
2012 4759 1332.52
2013 4989 1396.92
2014 5189 1452.92
2015 5380 1506.4
7
⊘ This is a preview!⊘
Do you want full access?
Subscribe today to unlock all pages.
Trusted by 1+ million students worldwide
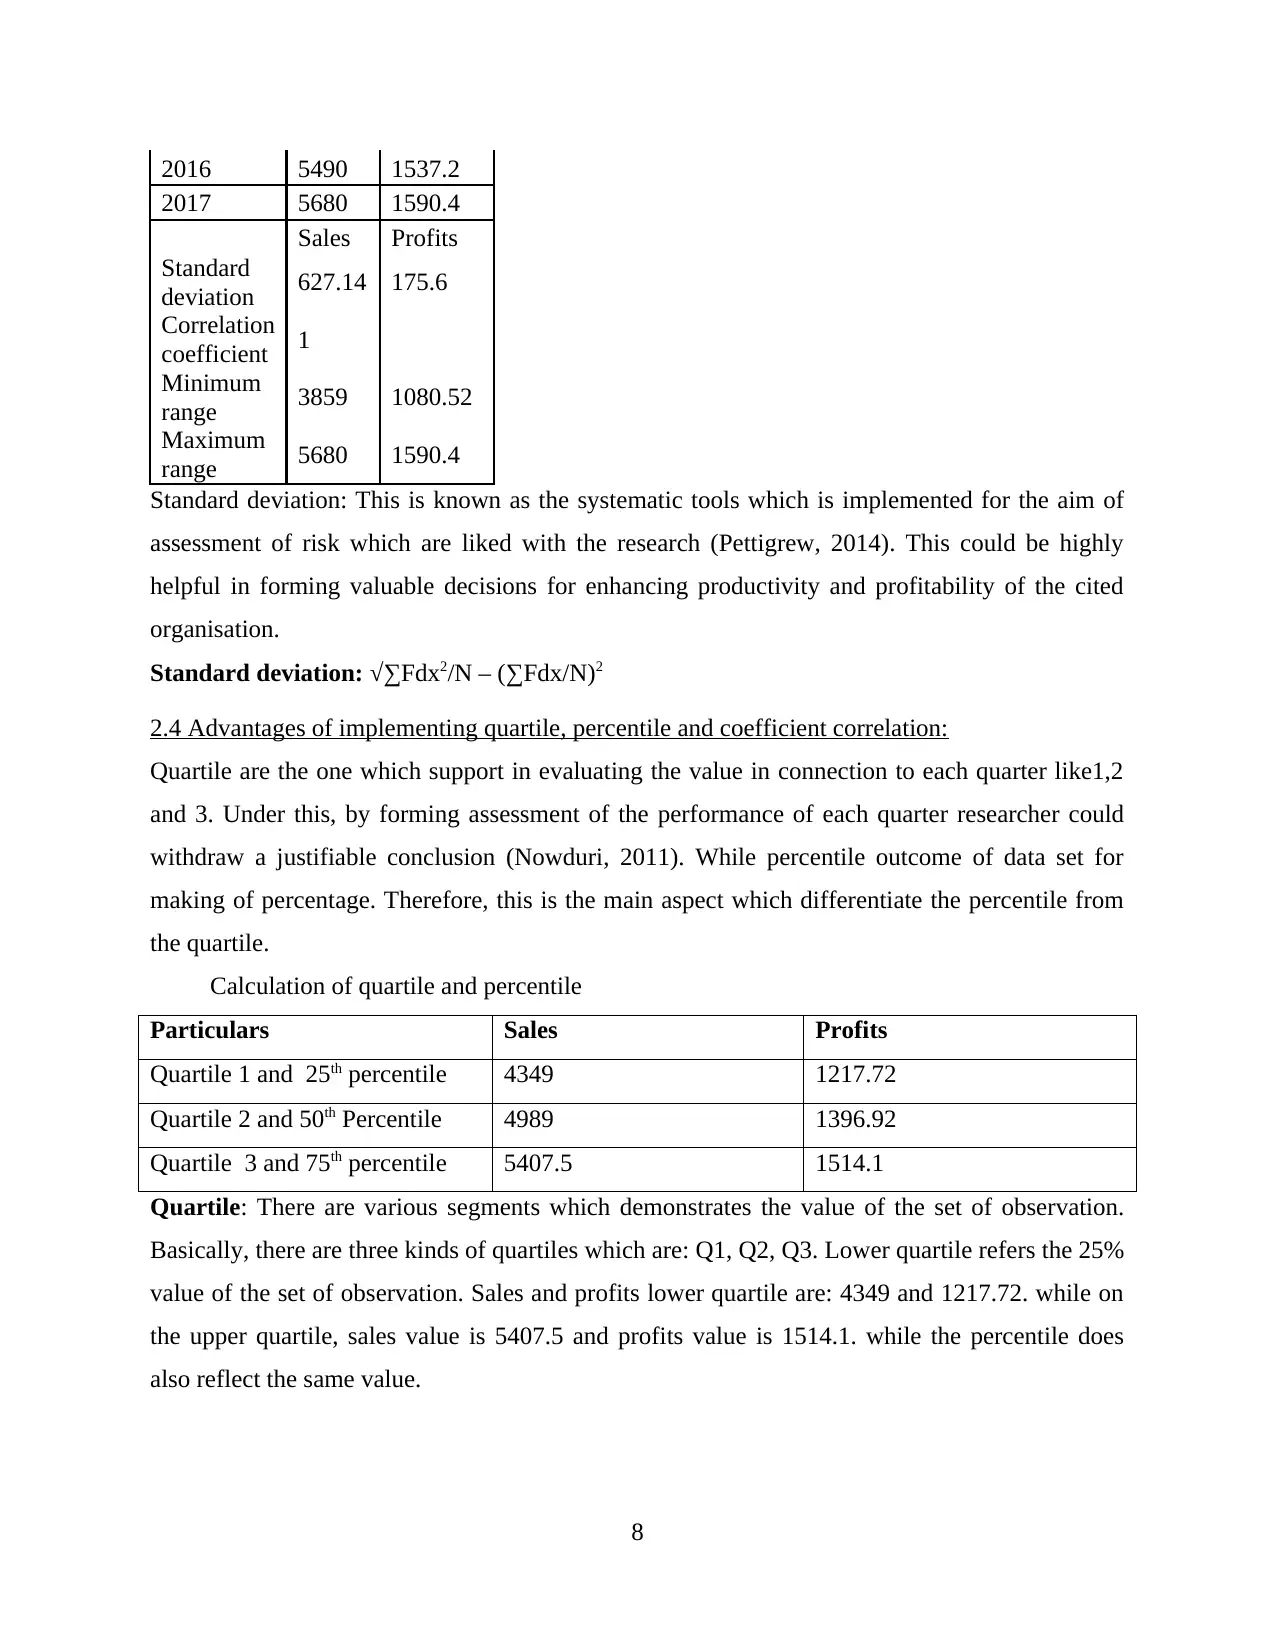
2016 5490 1537.2
2017 5680 1590.4
Sales Profits
Standard
deviation 627.14 175.6
Correlation
coefficient 1
Minimum
range 3859 1080.52
Maximum
range 5680 1590.4
Standard deviation: This is known as the systematic tools which is implemented for the aim of
assessment of risk which are liked with the research (Pettigrew, 2014). This could be highly
helpful in forming valuable decisions for enhancing productivity and profitability of the cited
organisation.
Standard deviation: √∑Fdx2/N – (∑Fdx/N)2
2.4 Advantages of implementing quartile, percentile and coefficient correlation:
Quartile are the one which support in evaluating the value in connection to each quarter like1,2
and 3. Under this, by forming assessment of the performance of each quarter researcher could
withdraw a justifiable conclusion (Nowduri, 2011). While percentile outcome of data set for
making of percentage. Therefore, this is the main aspect which differentiate the percentile from
the quartile.
Calculation of quartile and percentile
Particulars Sales Profits
Quartile 1 and 25th percentile 4349 1217.72
Quartile 2 and 50th Percentile 4989 1396.92
Quartile 3 and 75th percentile 5407.5 1514.1
Quartile: There are various segments which demonstrates the value of the set of observation.
Basically, there are three kinds of quartiles which are: Q1, Q2, Q3. Lower quartile refers the 25%
value of the set of observation. Sales and profits lower quartile are: 4349 and 1217.72. while on
the upper quartile, sales value is 5407.5 and profits value is 1514.1. while the percentile does
also reflect the same value.
8
Paraphrase This Document
Need a fresh take? Get an instant paraphrase of this document with our AI Paraphraser
TASK 3
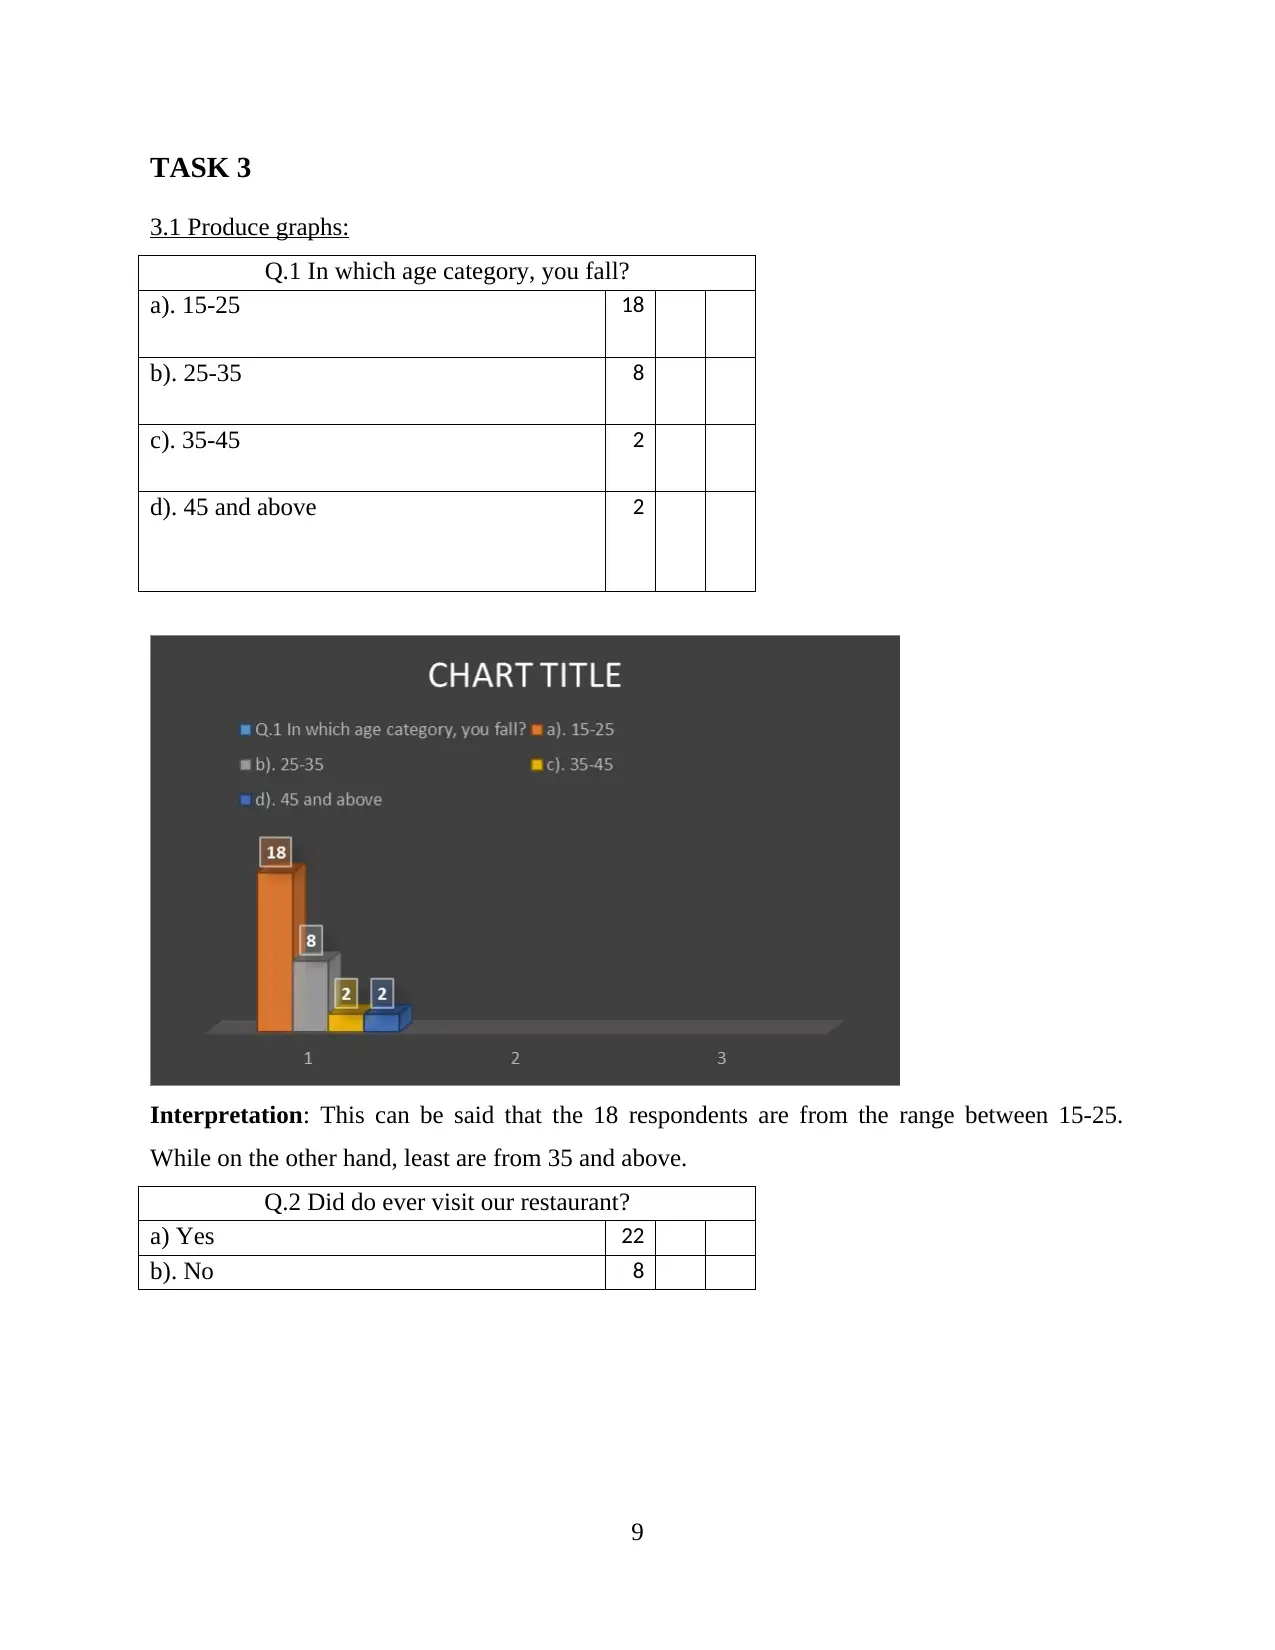
3.1 Produce graphs:
Q.1 In which age category, you fall?
a). 15-25 18
b). 25-35 8
c). 35-45 2
d). 45 and above 2
Interpretation: This can be said that the 18 respondents are from the range between 15-25.
While on the other hand, least are from 35 and above.
Q.2 Did do ever visit our restaurant?
a) Yes 22
b). No 8
9
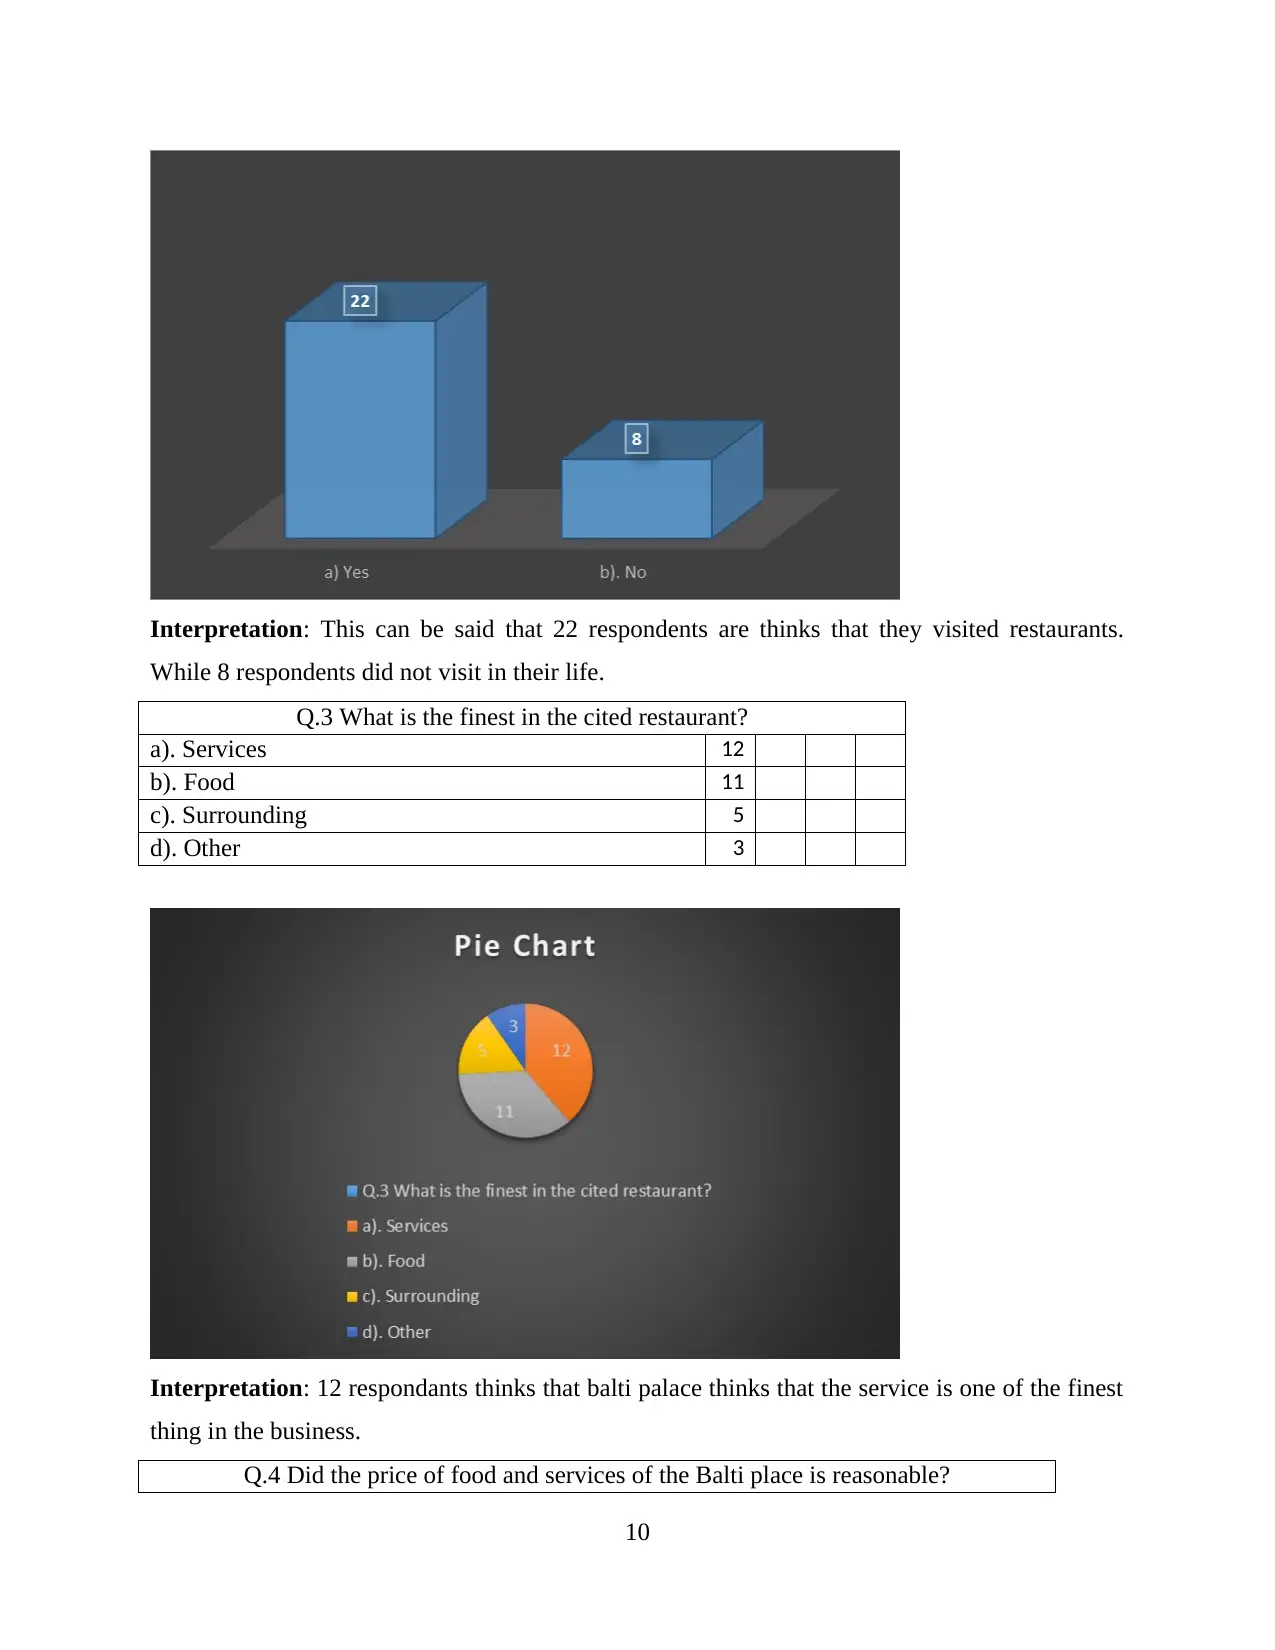
Interpretation: This can be said that 22 respondents are thinks that they visited restaurants.
While 8 respondents did not visit in their life.
Q.3 What is the finest in the cited restaurant?
a). Services 12
b). Food 11
c). Surrounding 5
d). Other 3
Interpretation: 12 respondants thinks that balti palace thinks that the service is one of the finest
thing in the business.
Q.4 Did the price of food and services of the Balti place is reasonable?
10
⊘ This is a preview!⊘
Do you want full access?
Subscribe today to unlock all pages.
Trusted by 1+ million students worldwide
1 out of 22
Related Documents


Your All-in-One AI-Powered Toolkit for Academic Success.
+13062052269
info@desklib.com
Available 24*7 on WhatsApp / Email
![[object Object]](/_next/static/media/star-bottom.7253800d.svg)
Unlock your academic potential
Copyright © 2020–2026 A2Z Services. All Rights Reserved. Developed and managed by ZUCOL.