Business Accounting and Finance: Ratio Analysis of UK Gambling Firms
VerifiedAdded on 2024/05/16
|18
|3487
|396
Report
AI Summary
This report provides a comprehensive analysis of the financial performance and position of three major gambling companies in the UK: Coral Group Plc, Ladbrokes, Paddy Power Betfair Plc, and William Hill Plc. It employs financial ratios (liquidity, solvency, operational, and profitability) and non-financial ratios (profit per employee, average cost of employee) to compare their performance over three years. The analysis identifies Paddy Power Betfair Plc as the best-performing company and Ladbrokes Coral Group as the poorest. Additionally, the report discusses the key stages in capital investment decision-making and explains investment appraisal methods, including discounted cash flow (DCF), highlighting their role in the investment process. The document is available on Desklib, a platform offering study tools and resources for students.

BUSINESS ACCOUNTING AND FINANCE FOR MANAGERS
1
1
Paraphrase This Document
Need a fresh take? Get an instant paraphrase of this document with our AI Paraphraser
Table of Contents
Section A – Question 1..............................................................................................................4
(a) Selection and justification of at least 10 financial ratios and calculate 2 non-financial
ratios to analyse the performance and financial position of the three companies......................4
Comparison of financial ratios...................................................................................................4
Comparison of non-financial ratios..........................................................................................10
(b) Identification of the best performing company in the industry..........................................12
(c) Identification of the most poorly performing company in the industry..............................12
Section B – Question 2.............................................................................................................14
(a) Identify and explain the key stages in the capital investment decision-making process, and
the role of investment appraisal in this process.......................................................................15
(b) Identify and explain the main methods of investment appraisal used in practice (including
DCF), use numerical examples to help illustrate the key aspects............................................16
Conclusion................................................................................................................................18
Reference list............................................................................................................................19
2
Introduction
It is important for every industry as well as company to measure its performance. There are
various tools that help a company in managing and measuring its financial performance and
position. One of the fundamental tools and techniques of measuring the growth, performance
and position of a company or industry is ratio analysis. This report discusses about UK’s
gambling industry, which has had a strong growth during the past few years and is considered
to be the one of the key contributors in UK’s economy. The report contains the measurement
and analysis of the performance of three major gambling industry of UK. It also discusses
about investment appraisal and its importance through explanation of the key stages in the
process of capital investment decision-making and the elucidation of the main methods for
invest appraisal.
3
⊘ This is a preview!⊘
Do you want full access?
Subscribe today to unlock all pages.
Trusted by 1+ million students worldwide
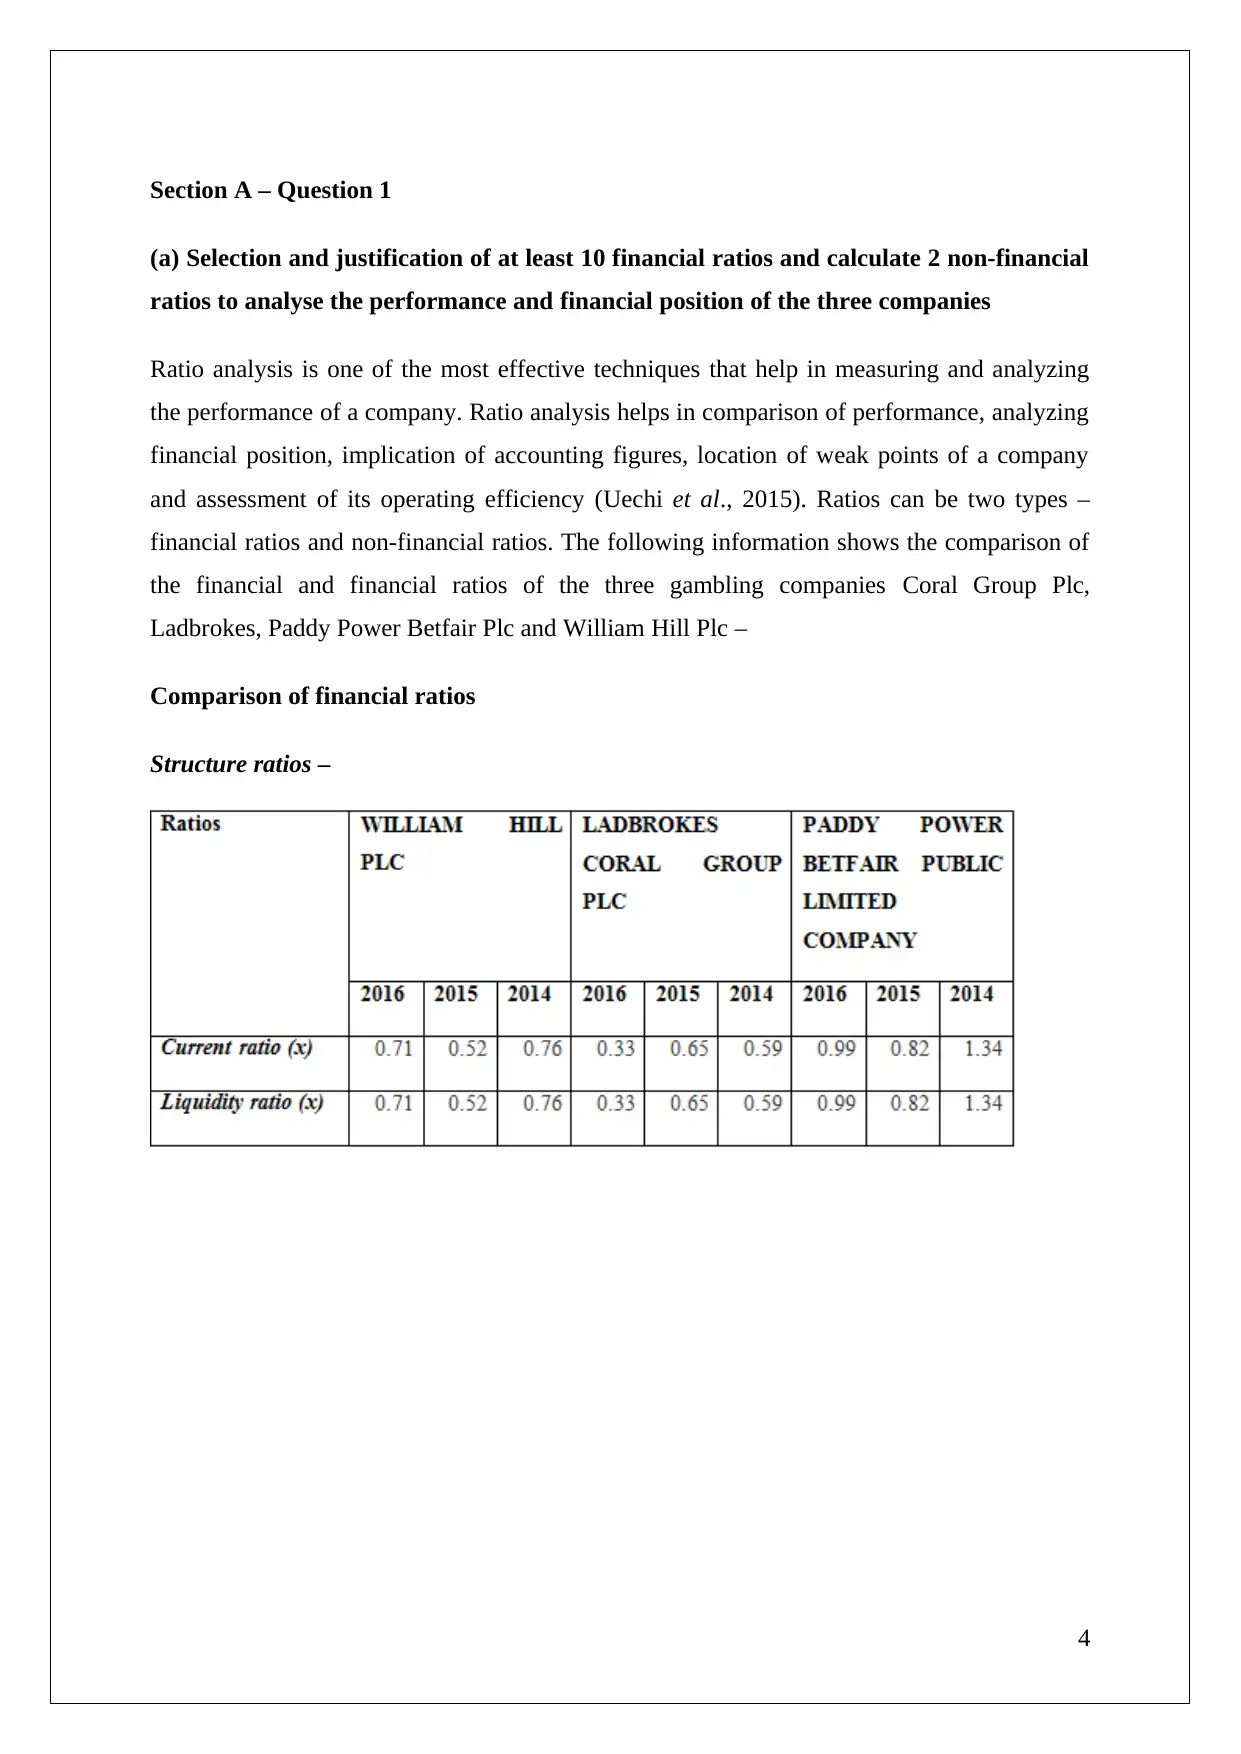
Section A – Question 1
(a) Selection and justification of at least 10 financial ratios and calculate 2 non-financial
ratios to analyse the performance and financial position of the three companies
Ratio analysis is one of the most effective techniques that help in measuring and analyzing
the performance of a company. Ratio analysis helps in comparison of performance, analyzing
financial position, implication of accounting figures, location of weak points of a company
and assessment of its operating efficiency (Uechi et al., 2015). Ratios can be two types –
financial ratios and non-financial ratios. The following information shows the comparison of
the financial and financial ratios of the three gambling companies Coral Group Plc,
Ladbrokes, Paddy Power Betfair Plc and William Hill Plc –
Comparison of financial ratios
Structure ratios –
4
Paraphrase This Document
Need a fresh take? Get an instant paraphrase of this document with our AI Paraphraser
2016 2015 2014 2016 2015 2014 2016 2015 2014
WILLIAM HILL PLC LADBROKES CORAL
GROUP PLC PADDY POWER BETFAIR
PUBLIC LIMITED
COMPANY
0.00
0.20
0.40
0.60
0.80
1.00
1.20
1.40
1.60
Current ratio (x)
Liquidity ratio (x)
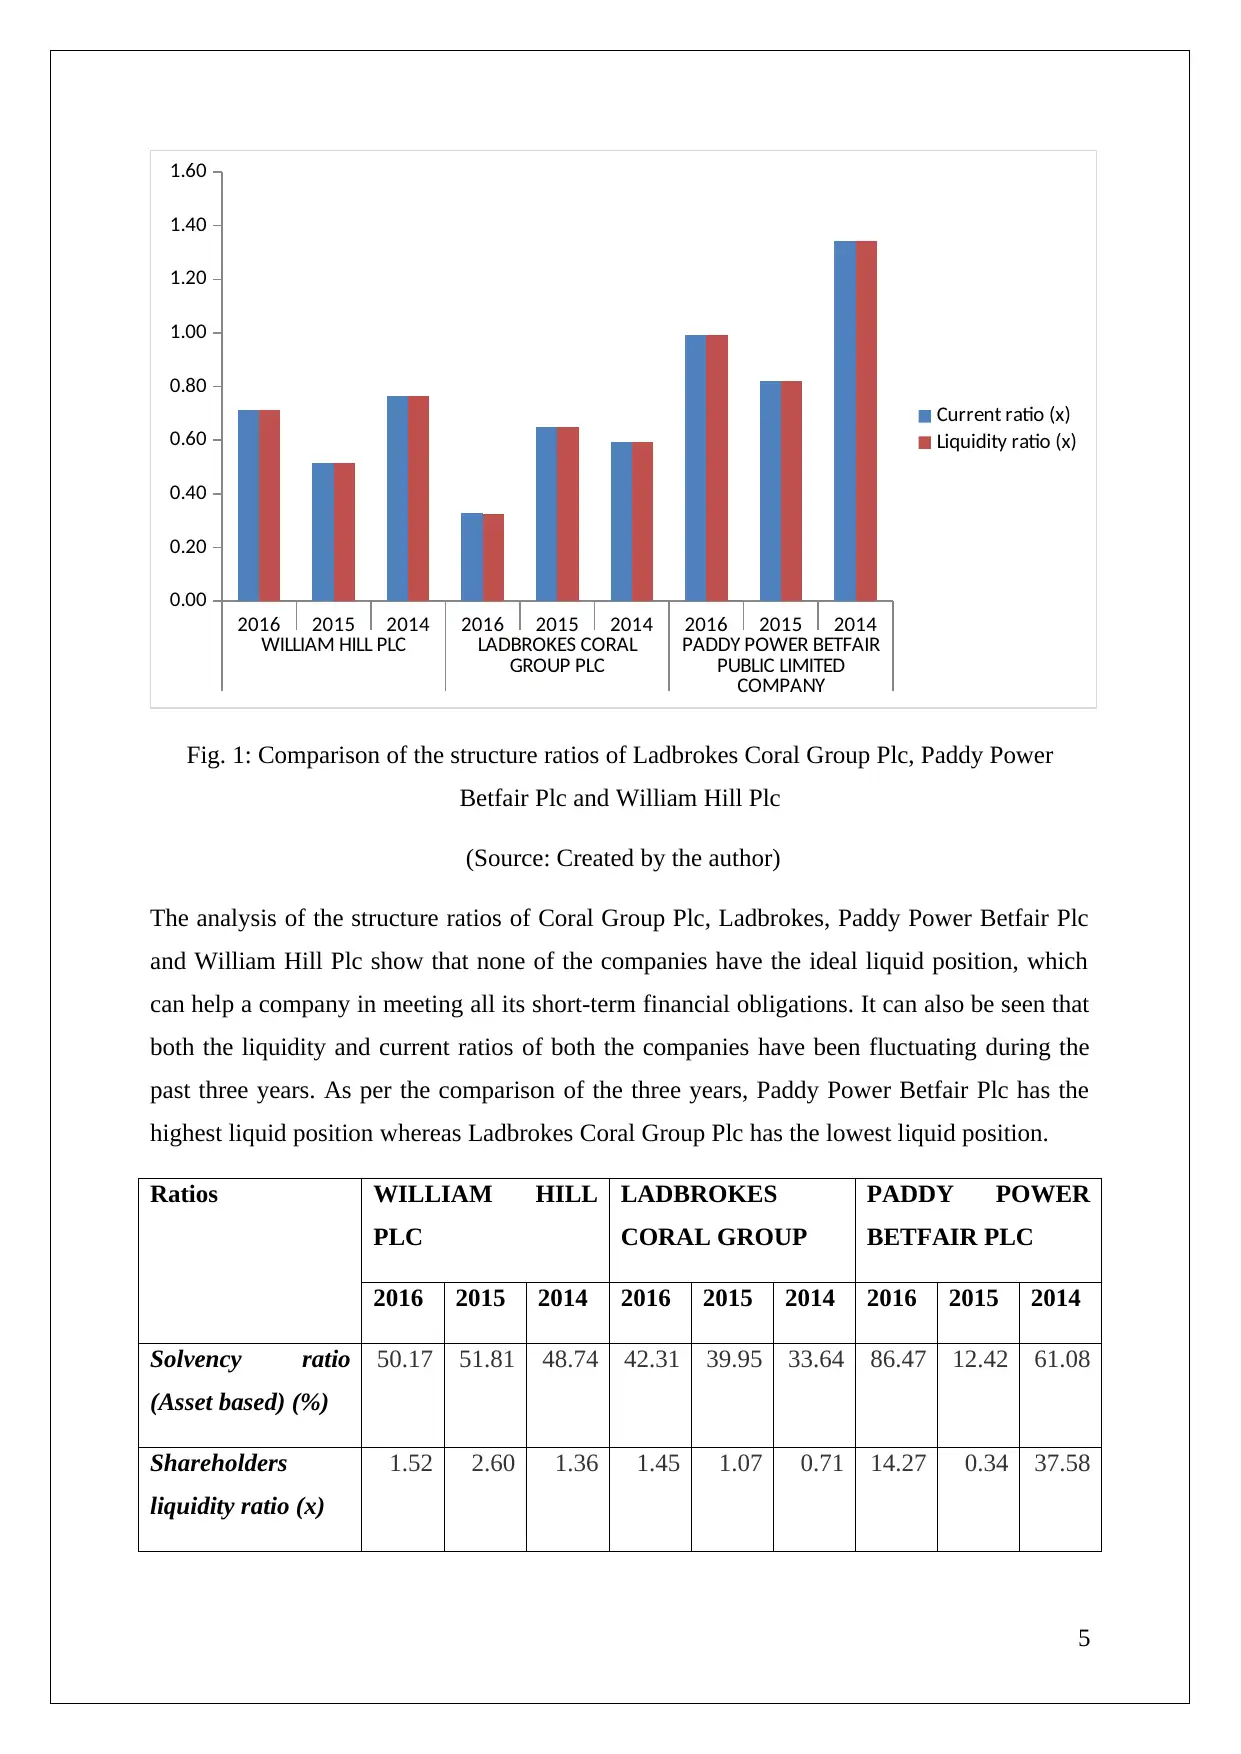
Fig. 1: Comparison of the structure ratios of Ladbrokes Coral Group Plc, Paddy Power
Betfair Plc and William Hill Plc
(Source: Created by the author)
The analysis of the structure ratios of Coral Group Plc, Ladbrokes, Paddy Power Betfair Plc
and William Hill Plc show that none of the companies have the ideal liquid position, which
can help a company in meeting all its short-term financial obligations. It can also be seen that
both the liquidity and current ratios of both the companies have been fluctuating during the
past three years. As per the comparison of the three years, Paddy Power Betfair Plc has the
highest liquid position whereas Ladbrokes Coral Group Plc has the lowest liquid position.
Ratios WILLIAM HILL
PLC
LADBROKES
CORAL GROUP
PADDY POWER
BETFAIR PLC
2016 2015 2014 2016 2015 2014 2016 2015 2014
Solvency ratio
(Asset based) (%)
50.17 51.81 48.74 42.31 39.95 33.64 86.47 12.42 61.08
Shareholders
liquidity ratio (x)
1.52 2.60 1.36 1.45 1.07 0.71 14.27 0.34 37.58
5
WILLIAM HILL PLC LADBROKES CORAL
GROUP PLC PADDY POWER BETFAIR
PUBLIC LIMITED
COMPANY
0.00
0.20
0.40
0.60
0.80
1.00
1.20
1.40
1.60
Current ratio (x)
Liquidity ratio (x)
Fig. 1: Comparison of the structure ratios of Ladbrokes Coral Group Plc, Paddy Power
Betfair Plc and William Hill Plc
(Source: Created by the author)
The analysis of the structure ratios of Coral Group Plc, Ladbrokes, Paddy Power Betfair Plc
and William Hill Plc show that none of the companies have the ideal liquid position, which
can help a company in meeting all its short-term financial obligations. It can also be seen that
both the liquidity and current ratios of both the companies have been fluctuating during the
past three years. As per the comparison of the three years, Paddy Power Betfair Plc has the
highest liquid position whereas Ladbrokes Coral Group Plc has the lowest liquid position.
Ratios WILLIAM HILL
PLC
LADBROKES
CORAL GROUP
PADDY POWER
BETFAIR PLC
2016 2015 2014 2016 2015 2014 2016 2015 2014
Solvency ratio
(Asset based) (%)
50.17 51.81 48.74 42.31 39.95 33.64 86.47 12.42 61.08
Shareholders
liquidity ratio (x)
1.52 2.60 1.36 1.45 1.07 0.71 14.27 0.34 37.58
5
2016
2015
2014
2016
2015
2014
2016
2015
2014
WILLIAM HILL PLC LADBROKES CORAL
GROUP PLC PADDY POWER
BETFAIR PUBLIC
LIMITED COMPANY
0.00
10.00
20.00
30.00
40.00
50.00
60.00
70.00
80.00
90.00
Shareholders liquidity ratio (x)
Solvency ratio (Asset based) (%)
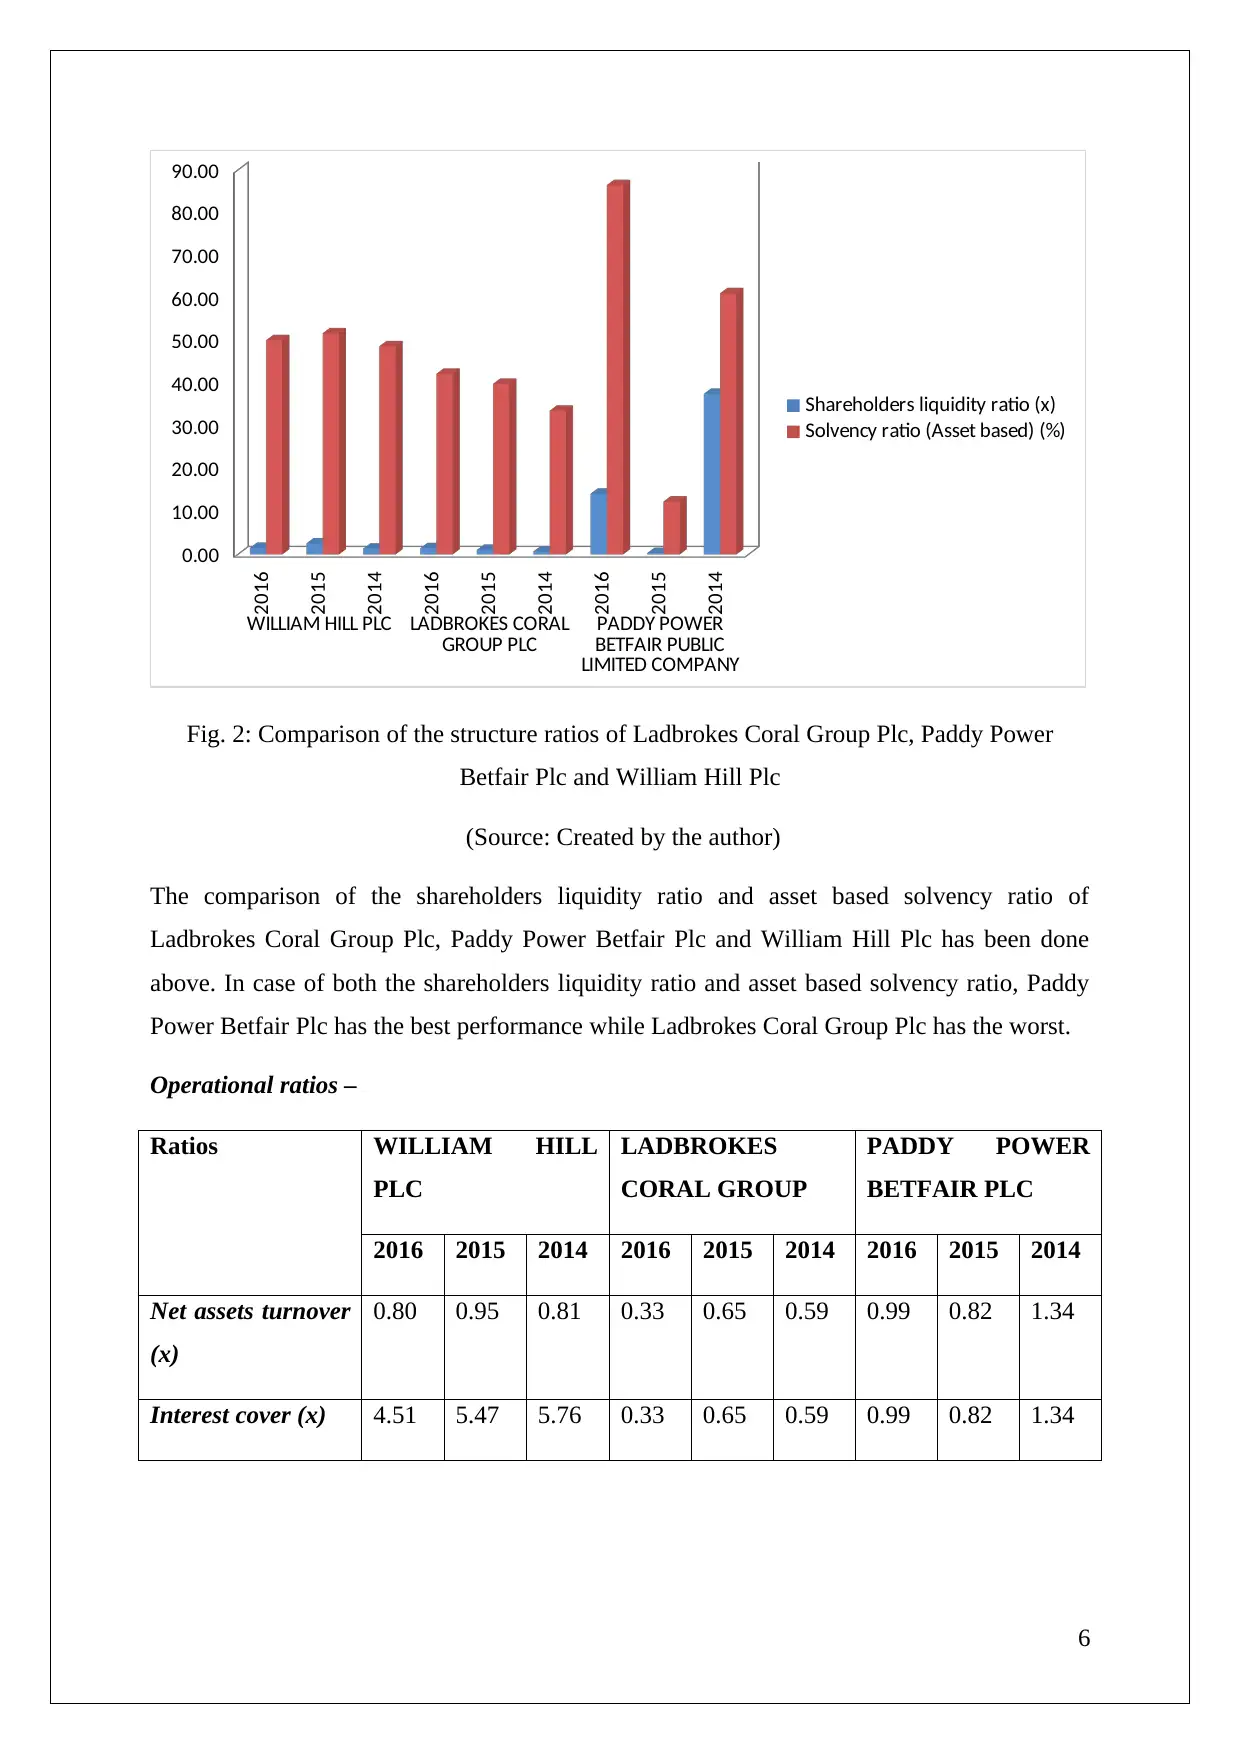
Fig. 2: Comparison of the structure ratios of Ladbrokes Coral Group Plc, Paddy Power
Betfair Plc and William Hill Plc
(Source: Created by the author)
The comparison of the shareholders liquidity ratio and asset based solvency ratio of
Ladbrokes Coral Group Plc, Paddy Power Betfair Plc and William Hill Plc has been done
above. In case of both the shareholders liquidity ratio and asset based solvency ratio, Paddy
Power Betfair Plc has the best performance while Ladbrokes Coral Group Plc has the worst.
Operational ratios –
Ratios WILLIAM HILL
PLC
LADBROKES
CORAL GROUP
PADDY POWER
BETFAIR PLC
2016 2015 2014 2016 2015 2014 2016 2015 2014
Net assets turnover
(x)
0.80 0.95 0.81 0.33 0.65 0.59 0.99 0.82 1.34
Interest cover (x) 4.51 5.47 5.76 0.33 0.65 0.59 0.99 0.82 1.34
6
2015
2014
2016
2015
2014
2016
2015
2014
WILLIAM HILL PLC LADBROKES CORAL
GROUP PLC PADDY POWER
BETFAIR PUBLIC
LIMITED COMPANY
0.00
10.00
20.00
30.00
40.00
50.00
60.00
70.00
80.00
90.00
Shareholders liquidity ratio (x)
Solvency ratio (Asset based) (%)
Fig. 2: Comparison of the structure ratios of Ladbrokes Coral Group Plc, Paddy Power
Betfair Plc and William Hill Plc
(Source: Created by the author)
The comparison of the shareholders liquidity ratio and asset based solvency ratio of
Ladbrokes Coral Group Plc, Paddy Power Betfair Plc and William Hill Plc has been done
above. In case of both the shareholders liquidity ratio and asset based solvency ratio, Paddy
Power Betfair Plc has the best performance while Ladbrokes Coral Group Plc has the worst.
Operational ratios –
Ratios WILLIAM HILL
PLC
LADBROKES
CORAL GROUP
PADDY POWER
BETFAIR PLC
2016 2015 2014 2016 2015 2014 2016 2015 2014
Net assets turnover
(x)
0.80 0.95 0.81 0.33 0.65 0.59 0.99 0.82 1.34
Interest cover (x) 4.51 5.47 5.76 0.33 0.65 0.59 0.99 0.82 1.34
6
⊘ This is a preview!⊘
Do you want full access?
Subscribe today to unlock all pages.
Trusted by 1+ million students worldwide
2016 2015 2014 2016 2015 2014 2016 2015 2014
WILLIAM HILL PLC LADBROKES CORAL
GROUP PLC PADDY POWER
BETFAIR PUBLIC
LIMITED COMPANY
0.00
1.00
2.00
3.00
4.00
5.00
6.00
Net assets turnover (x)
Interest cover (x)
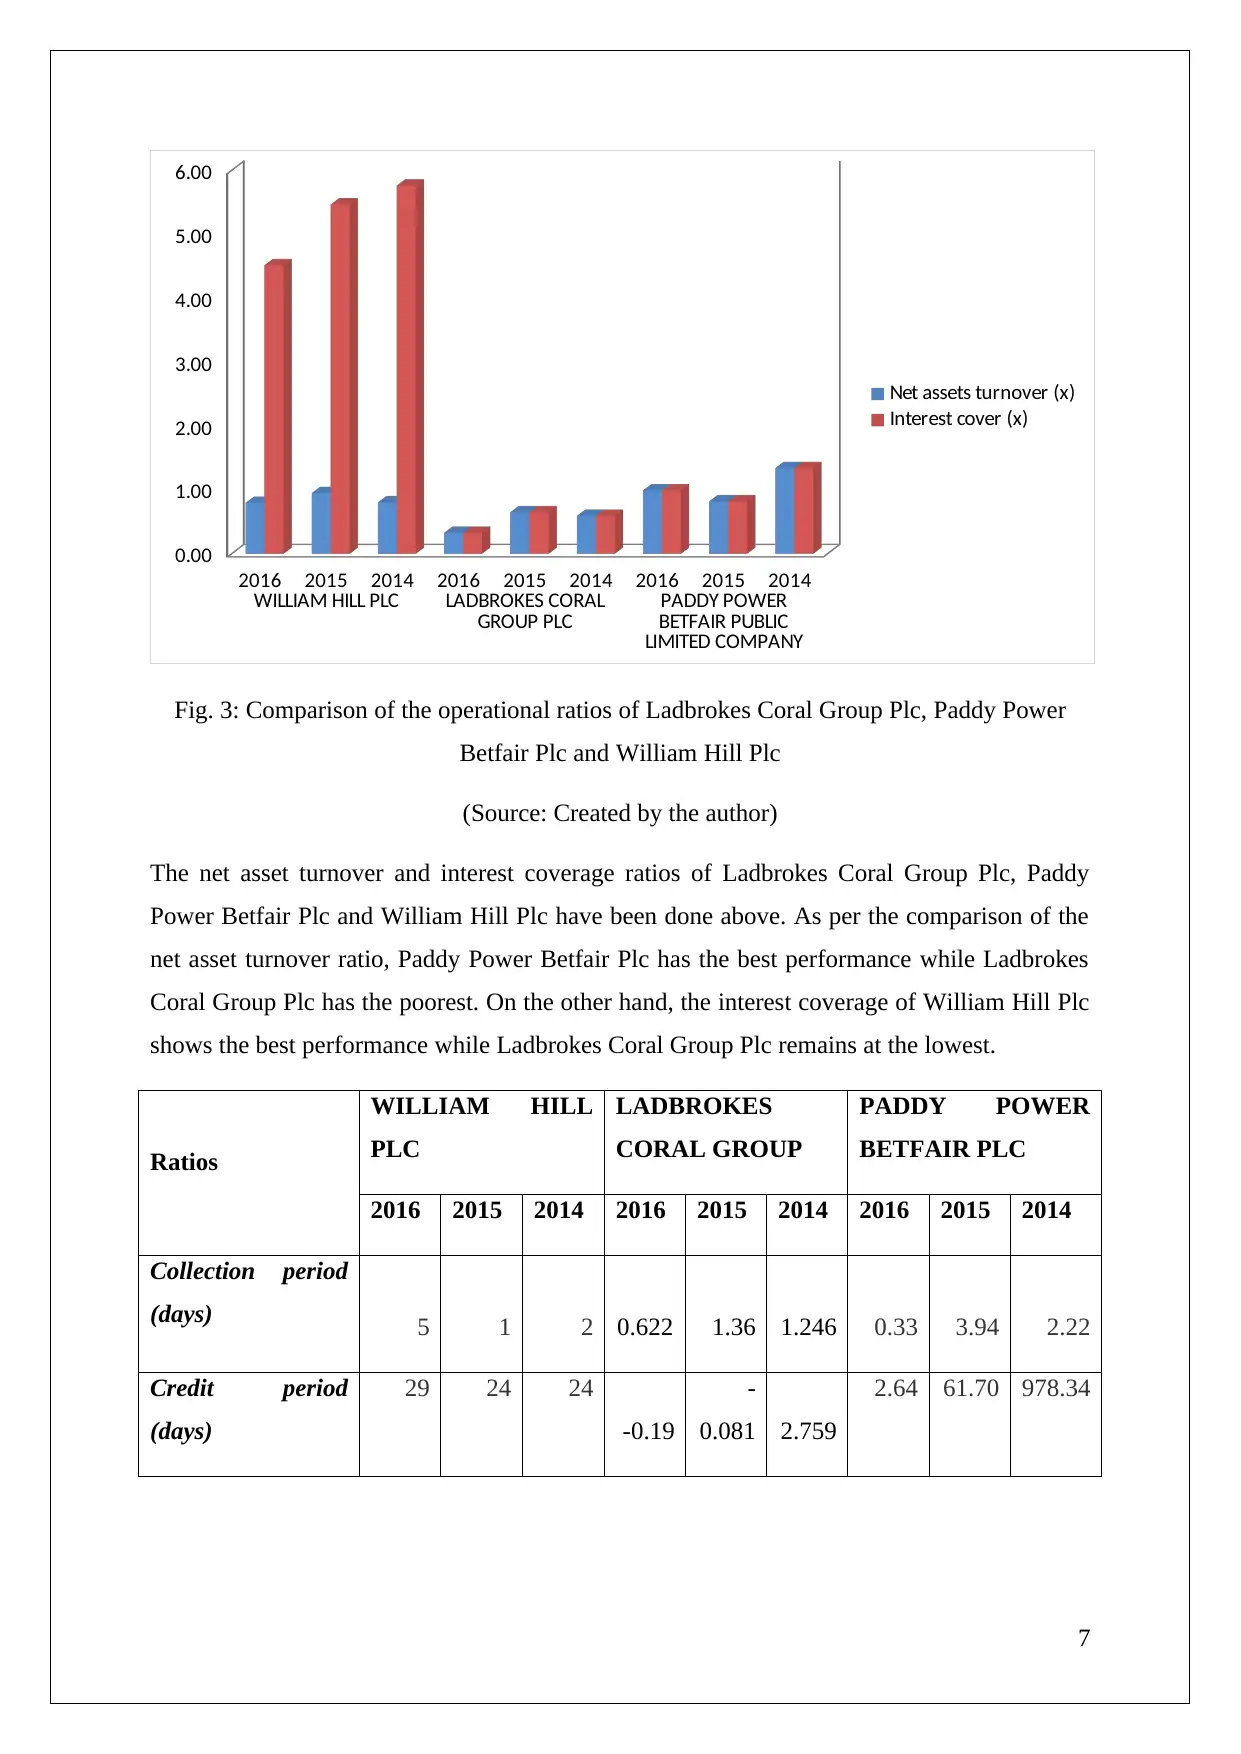
Fig. 3: Comparison of the operational ratios of Ladbrokes Coral Group Plc, Paddy Power
Betfair Plc and William Hill Plc
(Source: Created by the author)
The net asset turnover and interest coverage ratios of Ladbrokes Coral Group Plc, Paddy
Power Betfair Plc and William Hill Plc have been done above. As per the comparison of the
net asset turnover ratio, Paddy Power Betfair Plc has the best performance while Ladbrokes
Coral Group Plc has the poorest. On the other hand, the interest coverage of William Hill Plc
shows the best performance while Ladbrokes Coral Group Plc remains at the lowest.
Ratios
WILLIAM HILL
PLC
LADBROKES
CORAL GROUP
PADDY POWER
BETFAIR PLC
2016 2015 2014 2016 2015 2014 2016 2015 2014
Collection period
(days) 5 1 2 0.622 1.36 1.246 0.33 3.94 2.22
Credit period
(days)
29 24 24
-0.19
-
0.081 2.759
2.64 61.70 978.34
7
WILLIAM HILL PLC LADBROKES CORAL
GROUP PLC PADDY POWER
BETFAIR PUBLIC
LIMITED COMPANY
0.00
1.00
2.00
3.00
4.00
5.00
6.00
Net assets turnover (x)
Interest cover (x)
Fig. 3: Comparison of the operational ratios of Ladbrokes Coral Group Plc, Paddy Power
Betfair Plc and William Hill Plc
(Source: Created by the author)
The net asset turnover and interest coverage ratios of Ladbrokes Coral Group Plc, Paddy
Power Betfair Plc and William Hill Plc have been done above. As per the comparison of the
net asset turnover ratio, Paddy Power Betfair Plc has the best performance while Ladbrokes
Coral Group Plc has the poorest. On the other hand, the interest coverage of William Hill Plc
shows the best performance while Ladbrokes Coral Group Plc remains at the lowest.
Ratios
WILLIAM HILL
PLC
LADBROKES
CORAL GROUP
PADDY POWER
BETFAIR PLC
2016 2015 2014 2016 2015 2014 2016 2015 2014
Collection period
(days) 5 1 2 0.622 1.36 1.246 0.33 3.94 2.22
Credit period
(days)
29 24 24
-0.19
-
0.081 2.759
2.64 61.70 978.34
7
Paraphrase This Document
Need a fresh take? Get an instant paraphrase of this document with our AI Paraphraser
2016 2015 2014 2016 2015 2014 2016 2015 2014
WILLIAM HILL PLC LADBROKES CORAL
GROUP PLC PADDY POWER
BETFAIR PUBLIC
LIMITED COMPANY-200
0
200
400
600
800
1,000
Collection period (days)
Credit period (days)
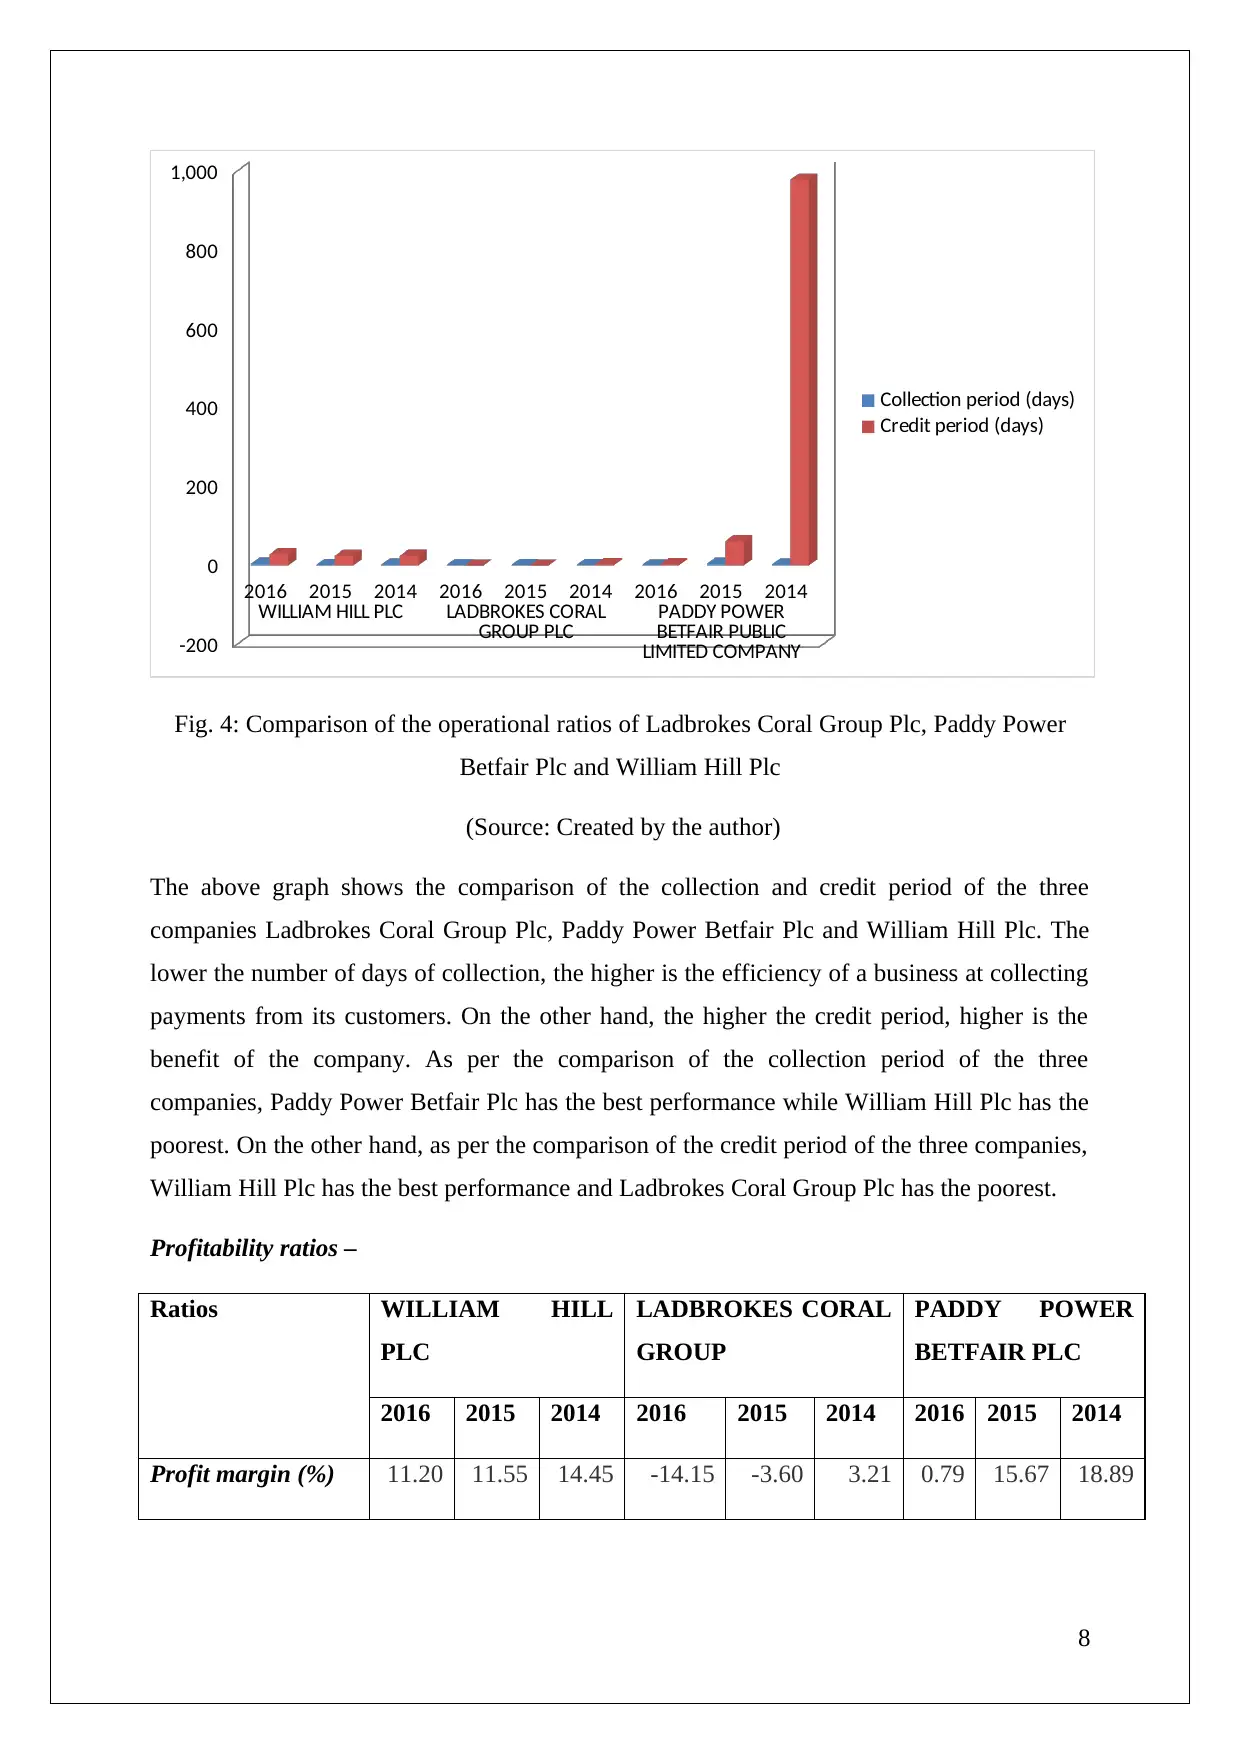
Fig. 4: Comparison of the operational ratios of Ladbrokes Coral Group Plc, Paddy Power
Betfair Plc and William Hill Plc
(Source: Created by the author)
The above graph shows the comparison of the collection and credit period of the three
companies Ladbrokes Coral Group Plc, Paddy Power Betfair Plc and William Hill Plc. The
lower the number of days of collection, the higher is the efficiency of a business at collecting
payments from its customers. On the other hand, the higher the credit period, higher is the
benefit of the company. As per the comparison of the collection period of the three
companies, Paddy Power Betfair Plc has the best performance while William Hill Plc has the
poorest. On the other hand, as per the comparison of the credit period of the three companies,
William Hill Plc has the best performance and Ladbrokes Coral Group Plc has the poorest.
Profitability ratios –
Ratios WILLIAM HILL
PLC
LADBROKES CORAL
GROUP
PADDY POWER
BETFAIR PLC
2016 2015 2014 2016 2015 2014 2016 2015 2014
Profit margin (%) 11.20 11.55 14.45 -14.15 -3.60 3.21 0.79 15.67 18.89
8
WILLIAM HILL PLC LADBROKES CORAL
GROUP PLC PADDY POWER
BETFAIR PUBLIC
LIMITED COMPANY-200
0
200
400
600
800
1,000
Collection period (days)
Credit period (days)
Fig. 4: Comparison of the operational ratios of Ladbrokes Coral Group Plc, Paddy Power
Betfair Plc and William Hill Plc
(Source: Created by the author)
The above graph shows the comparison of the collection and credit period of the three
companies Ladbrokes Coral Group Plc, Paddy Power Betfair Plc and William Hill Plc. The
lower the number of days of collection, the higher is the efficiency of a business at collecting
payments from its customers. On the other hand, the higher the credit period, higher is the
benefit of the company. As per the comparison of the collection period of the three
companies, Paddy Power Betfair Plc has the best performance while William Hill Plc has the
poorest. On the other hand, as per the comparison of the credit period of the three companies,
William Hill Plc has the best performance and Ladbrokes Coral Group Plc has the poorest.
Profitability ratios –
Ratios WILLIAM HILL
PLC
LADBROKES CORAL
GROUP
PADDY POWER
BETFAIR PLC
2016 2015 2014 2016 2015 2014 2016 2015 2014
Profit margin (%) 11.20 11.55 14.45 -14.15 -3.60 3.21 0.79 15.67 18.89
8
ROCE using Net
income (%)
10.51 13.72 12.69 -6.80 3.79 7.38 -
0.02
54.66 36.52
2016
2015
2014
2016
2015
2014
2016
2015
2014
WILLIAM HILL PLC LADBROKES CORAL
GROUP PLC PADDY POWER
BETFAIR PUBLIC
LIMITED COMPANY
-20.00
-10.00
0.00
10.00
20.00
30.00
40.00
50.00
60.00
Profit margin (%)
ROCE using Net income (%)
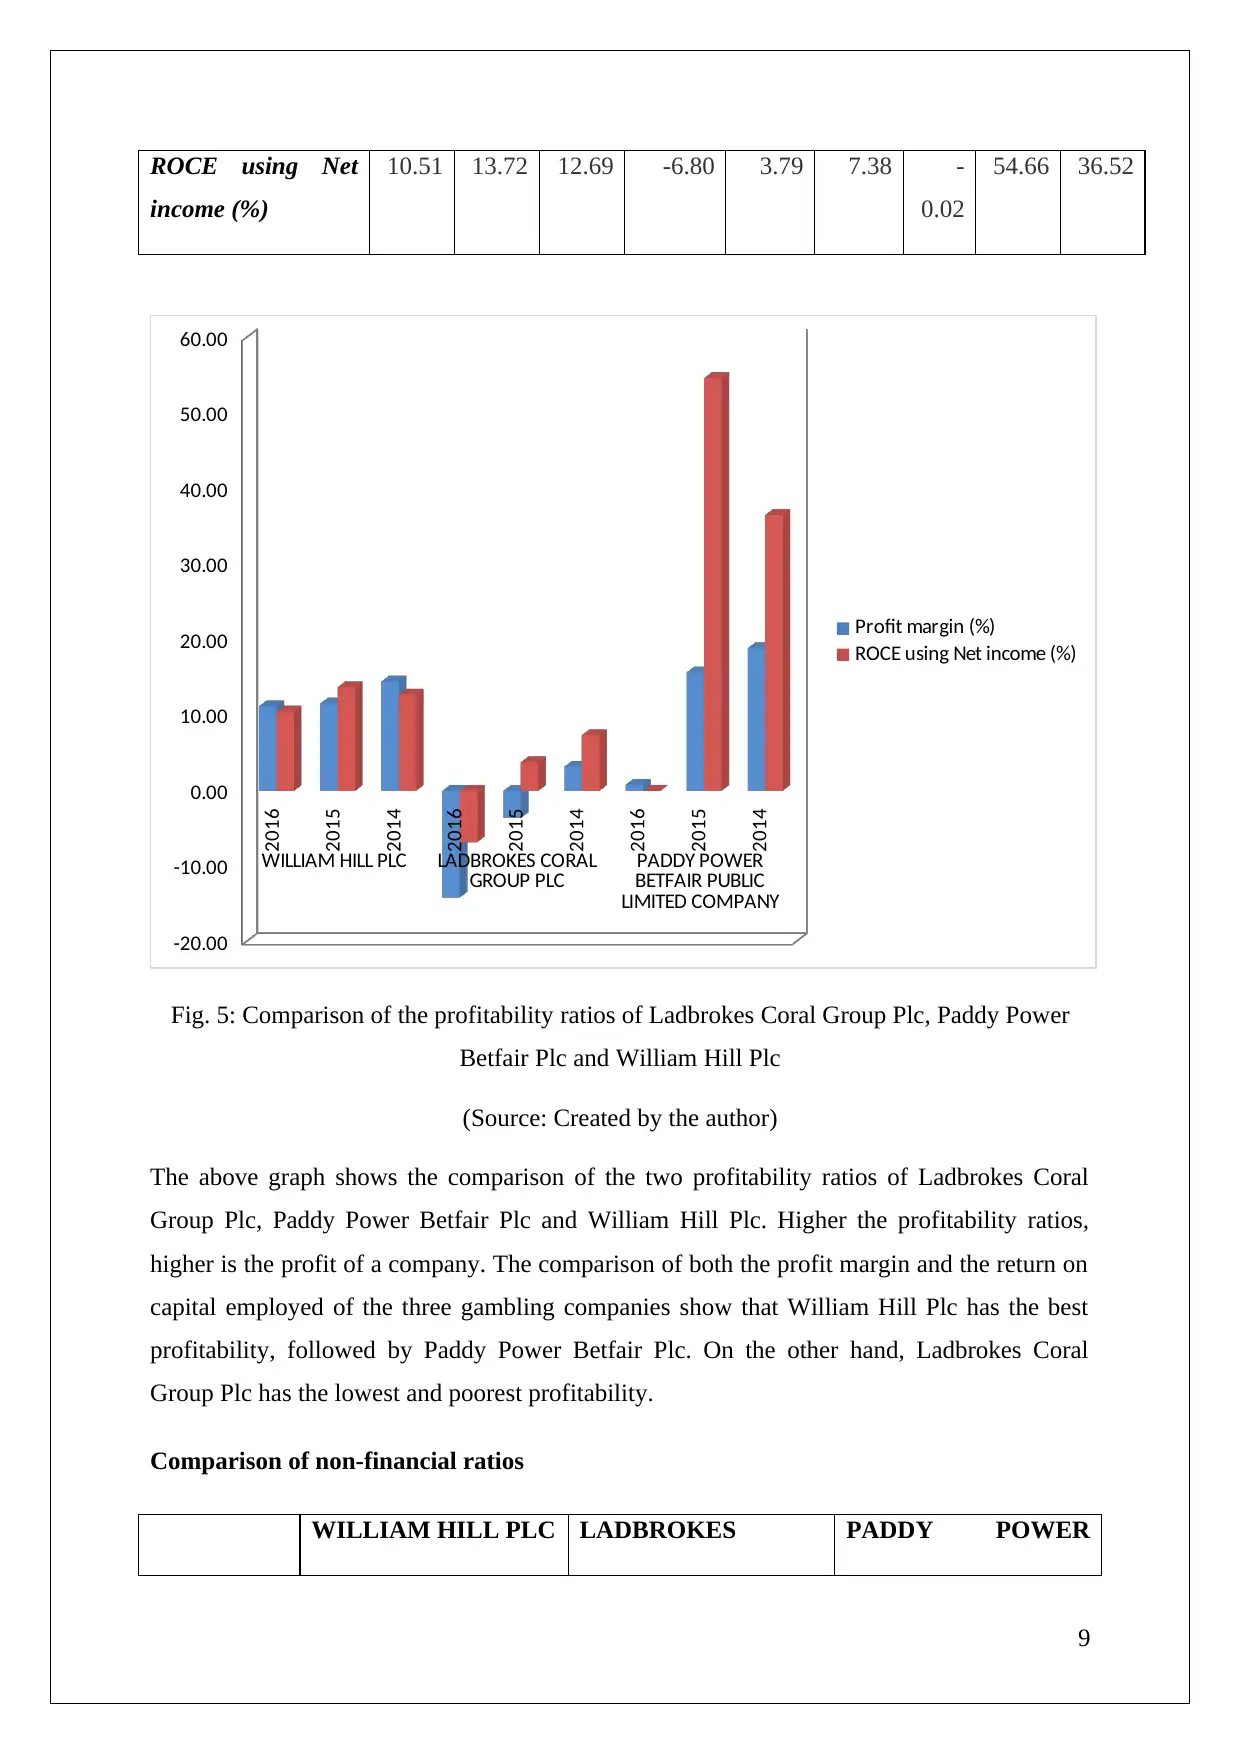
Fig. 5: Comparison of the profitability ratios of Ladbrokes Coral Group Plc, Paddy Power
Betfair Plc and William Hill Plc
(Source: Created by the author)
The above graph shows the comparison of the two profitability ratios of Ladbrokes Coral
Group Plc, Paddy Power Betfair Plc and William Hill Plc. Higher the profitability ratios,
higher is the profit of a company. The comparison of both the profit margin and the return on
capital employed of the three gambling companies show that William Hill Plc has the best
profitability, followed by Paddy Power Betfair Plc. On the other hand, Ladbrokes Coral
Group Plc has the lowest and poorest profitability.
Comparison of non-financial ratios
WILLIAM HILL PLC LADBROKES PADDY POWER
9
income (%)
10.51 13.72 12.69 -6.80 3.79 7.38 -
0.02
54.66 36.52
2016
2015
2014
2016
2015
2014
2016
2015
2014
WILLIAM HILL PLC LADBROKES CORAL
GROUP PLC PADDY POWER
BETFAIR PUBLIC
LIMITED COMPANY
-20.00
-10.00
0.00
10.00
20.00
30.00
40.00
50.00
60.00
Profit margin (%)
ROCE using Net income (%)
Fig. 5: Comparison of the profitability ratios of Ladbrokes Coral Group Plc, Paddy Power
Betfair Plc and William Hill Plc
(Source: Created by the author)
The above graph shows the comparison of the two profitability ratios of Ladbrokes Coral
Group Plc, Paddy Power Betfair Plc and William Hill Plc. Higher the profitability ratios,
higher is the profit of a company. The comparison of both the profit margin and the return on
capital employed of the three gambling companies show that William Hill Plc has the best
profitability, followed by Paddy Power Betfair Plc. On the other hand, Ladbrokes Coral
Group Plc has the lowest and poorest profitability.
Comparison of non-financial ratios
WILLIAM HILL PLC LADBROKES PADDY POWER
9
⊘ This is a preview!⊘
Do you want full access?
Subscribe today to unlock all pages.
Trusted by 1+ million students worldwide
CORAL GROUP BETFAIR PLC
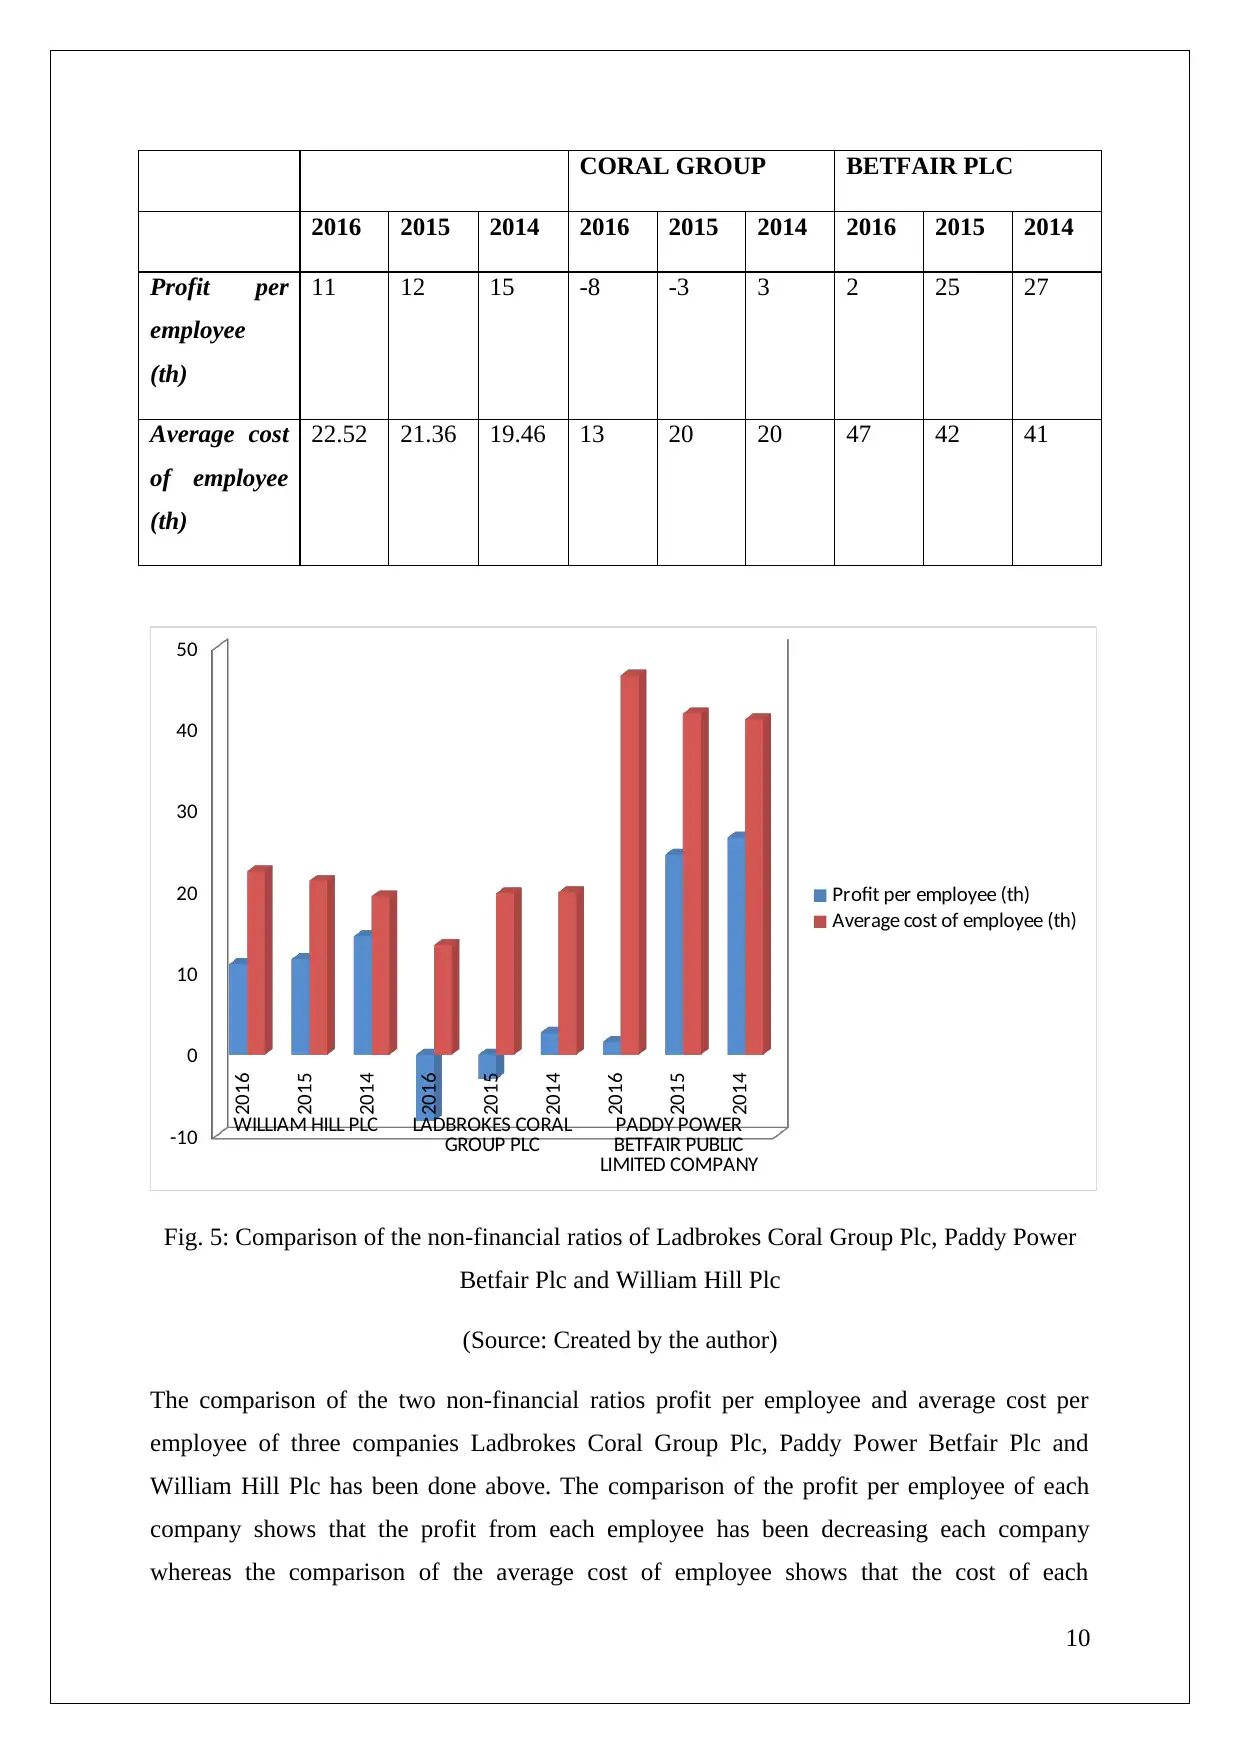
2016 2015 2014 2016 2015 2014 2016 2015 2014
Profit per
employee
(th)
11 12 15 -8 -3 3 2 25 27
Average cost
of employee
(th)
22.52 21.36 19.46 13 20 20 47 42 41
2016
2015
2014
2016
2015
2014
2016
2015
2014
WILLIAM HILL PLC LADBROKES CORAL
GROUP PLC PADDY POWER
BETFAIR PUBLIC
LIMITED COMPANY
-10
0
10
20
30
40
50
Profit per employee (th)
Average cost of employee (th)
Fig. 5: Comparison of the non-financial ratios of Ladbrokes Coral Group Plc, Paddy Power
Betfair Plc and William Hill Plc
(Source: Created by the author)
The comparison of the two non-financial ratios profit per employee and average cost per
employee of three companies Ladbrokes Coral Group Plc, Paddy Power Betfair Plc and
William Hill Plc has been done above. The comparison of the profit per employee of each
company shows that the profit from each employee has been decreasing each company
whereas the comparison of the average cost of employee shows that the cost of each
10
Paraphrase This Document
Need a fresh take? Get an instant paraphrase of this document with our AI Paraphraser
employee has been increasing. The comparison of the profit per employee shows that the
profit per employee of William Hill Plc is highest whereas that of Ladbrokes Coral Group is
lowest. On the other hand, the comparison of the average cost of each employee shows that
the best performance as per employee cost is in case of Ladbrokes Coral Group, whereas that
of Paddy Power Betfair Plc is poorest.
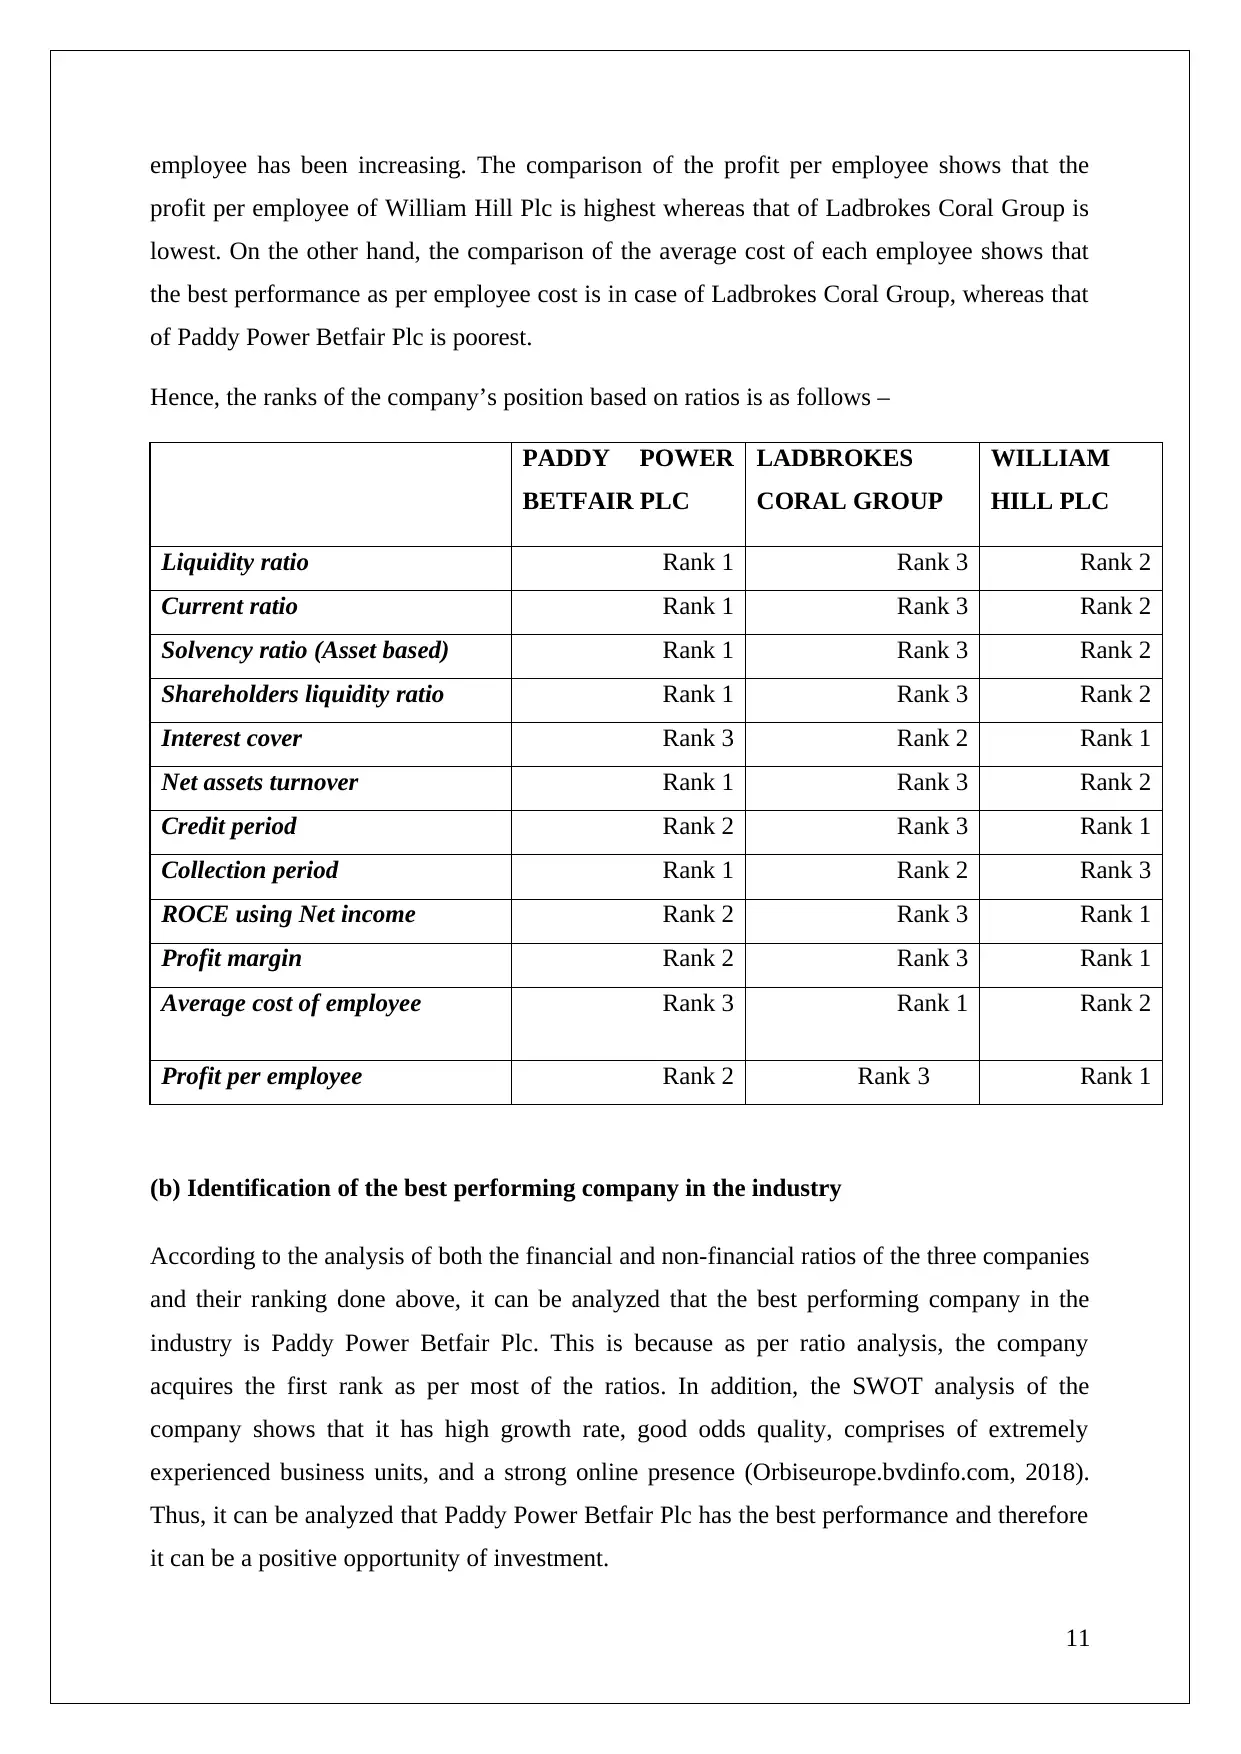
Hence, the ranks of the company’s position based on ratios is as follows –
PADDY POWER
BETFAIR PLC
LADBROKES
CORAL GROUP
WILLIAM
HILL PLC
Liquidity ratio Rank 1 Rank 3 Rank 2
Current ratio Rank 1 Rank 3 Rank 2
Solvency ratio (Asset based) Rank 1 Rank 3 Rank 2
Shareholders liquidity ratio Rank 1 Rank 3 Rank 2
Interest cover Rank 3 Rank 2 Rank 1
Net assets turnover Rank 1 Rank 3 Rank 2
Credit period Rank 2 Rank 3 Rank 1
Collection period Rank 1 Rank 2 Rank 3
ROCE using Net income Rank 2 Rank 3 Rank 1
Profit margin Rank 2 Rank 3 Rank 1
Average cost of employee Rank 3 Rank 1 Rank 2
Profit per employee Rank 2 Rank 3 Rank 1
(b) Identification of the best performing company in the industry
According to the analysis of both the financial and non-financial ratios of the three companies
and their ranking done above, it can be analyzed that the best performing company in the
industry is Paddy Power Betfair Plc. This is because as per ratio analysis, the company
acquires the first rank as per most of the ratios. In addition, the SWOT analysis of the
company shows that it has high growth rate, good odds quality, comprises of extremely
experienced business units, and a strong online presence (Orbiseurope.bvdinfo.com, 2018).
Thus, it can be analyzed that Paddy Power Betfair Plc has the best performance and therefore
it can be a positive opportunity of investment.
11
profit per employee of William Hill Plc is highest whereas that of Ladbrokes Coral Group is
lowest. On the other hand, the comparison of the average cost of each employee shows that
the best performance as per employee cost is in case of Ladbrokes Coral Group, whereas that
of Paddy Power Betfair Plc is poorest.
Hence, the ranks of the company’s position based on ratios is as follows –
PADDY POWER
BETFAIR PLC
LADBROKES
CORAL GROUP
WILLIAM
HILL PLC
Liquidity ratio Rank 1 Rank 3 Rank 2
Current ratio Rank 1 Rank 3 Rank 2
Solvency ratio (Asset based) Rank 1 Rank 3 Rank 2
Shareholders liquidity ratio Rank 1 Rank 3 Rank 2
Interest cover Rank 3 Rank 2 Rank 1
Net assets turnover Rank 1 Rank 3 Rank 2
Credit period Rank 2 Rank 3 Rank 1
Collection period Rank 1 Rank 2 Rank 3
ROCE using Net income Rank 2 Rank 3 Rank 1
Profit margin Rank 2 Rank 3 Rank 1
Average cost of employee Rank 3 Rank 1 Rank 2
Profit per employee Rank 2 Rank 3 Rank 1
(b) Identification of the best performing company in the industry
According to the analysis of both the financial and non-financial ratios of the three companies
and their ranking done above, it can be analyzed that the best performing company in the
industry is Paddy Power Betfair Plc. This is because as per ratio analysis, the company
acquires the first rank as per most of the ratios. In addition, the SWOT analysis of the
company shows that it has high growth rate, good odds quality, comprises of extremely
experienced business units, and a strong online presence (Orbiseurope.bvdinfo.com, 2018).
Thus, it can be analyzed that Paddy Power Betfair Plc has the best performance and therefore
it can be a positive opportunity of investment.
11
(c) Identification of the most poorly performing company in the industry
As per ratio analysis, Ladbrokes Coral Group has the poorest performance in the industry. In
addition to ratio analysis, the SWOT analysis of the company shows that the company is not
good at forecasting its product demand, has high attrition in terms of the rate of workforce,
does not invest in new technologies and has poor marketing activities
(Orbiseurope.bvdinfo.com, 2018). The company is recommended to adopt effective
marketing and promotional campaigns, and should implement new technologies in the
company for improving its financial performance.
12
⊘ This is a preview!⊘
Do you want full access?
Subscribe today to unlock all pages.
Trusted by 1+ million students worldwide
1 out of 18
Related Documents


Your All-in-One AI-Powered Toolkit for Academic Success.
+13062052269
info@desklib.com
Available 24*7 on WhatsApp / Email
![[object Object]](/_next/static/media/star-bottom.7253800d.svg)
Unlock your academic potential
Copyright © 2020–2026 A2Z Services. All Rights Reserved. Developed and managed by ZUCOL.