Business Finance Assignment - Financial Analysis Report
VerifiedAdded on 2019/10/30
|15
|2233
|166
Homework Assignment
AI Summary
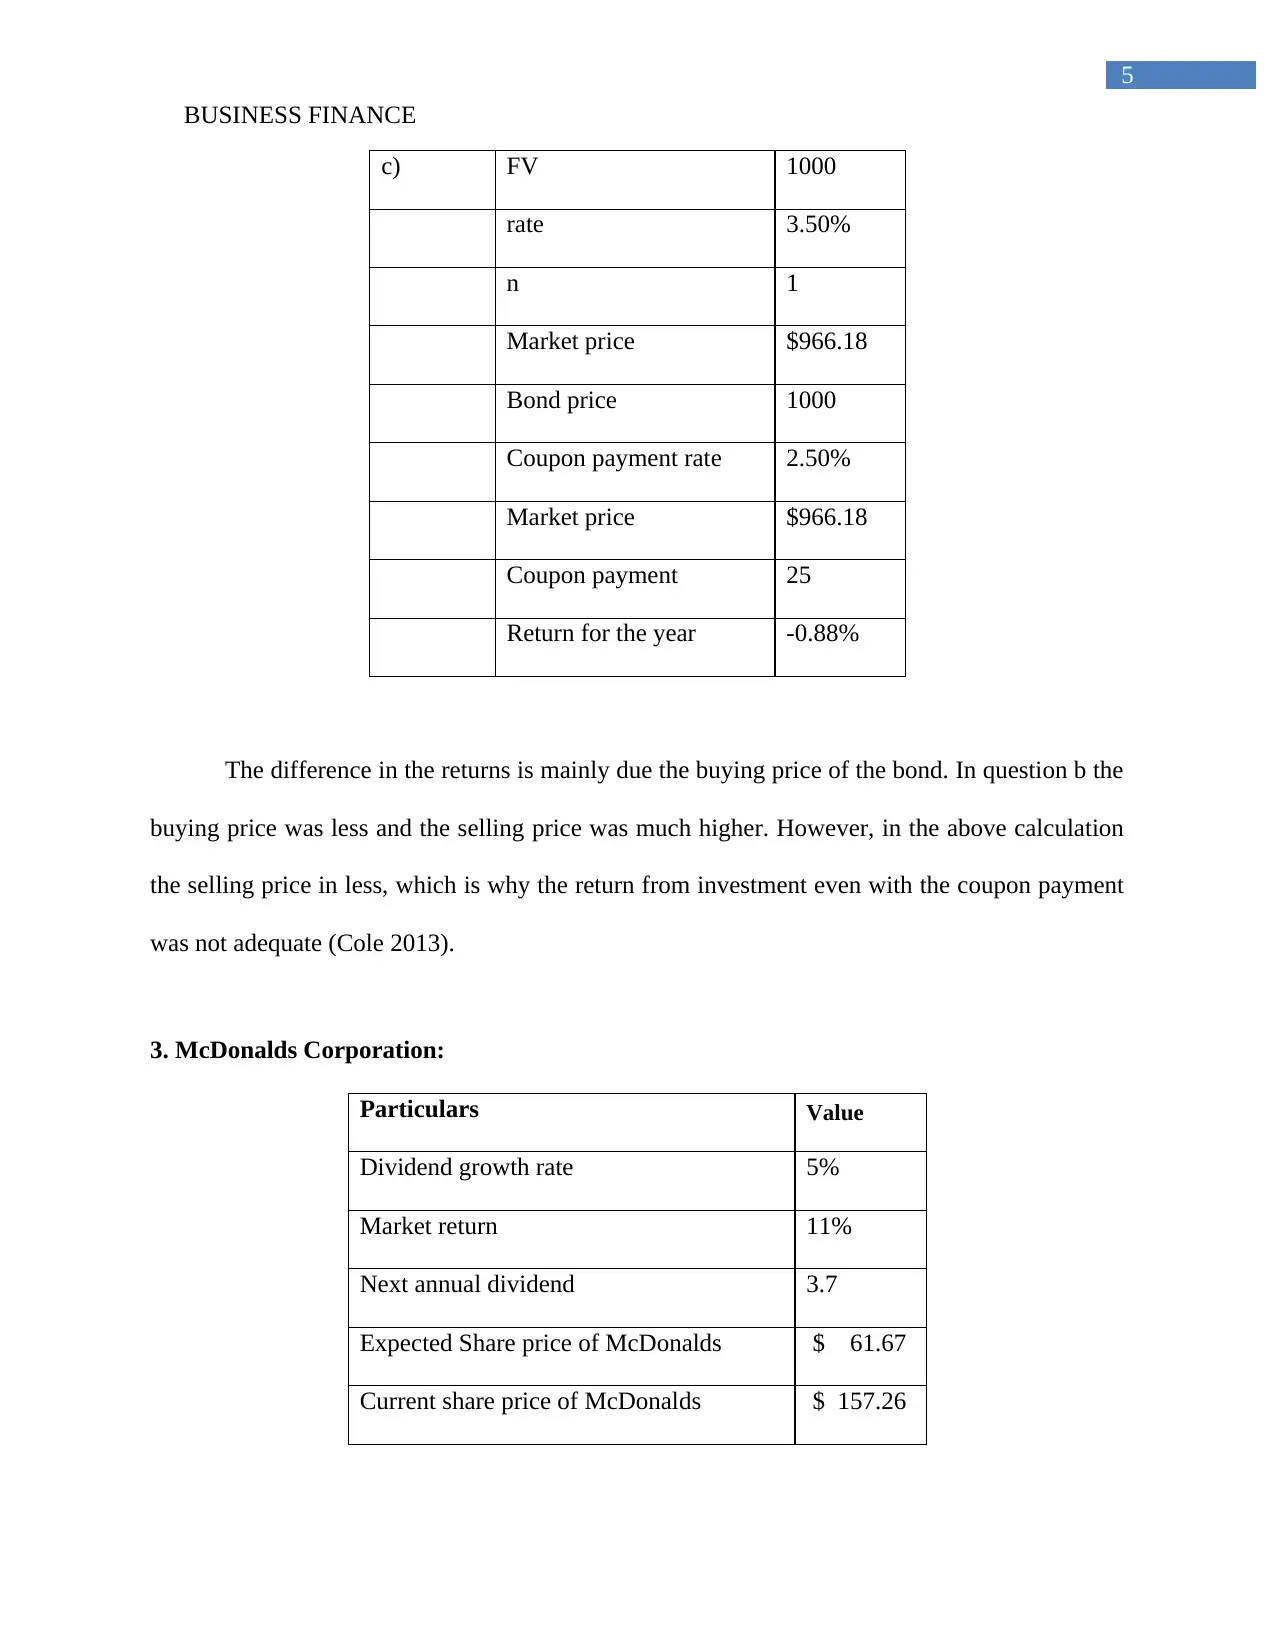
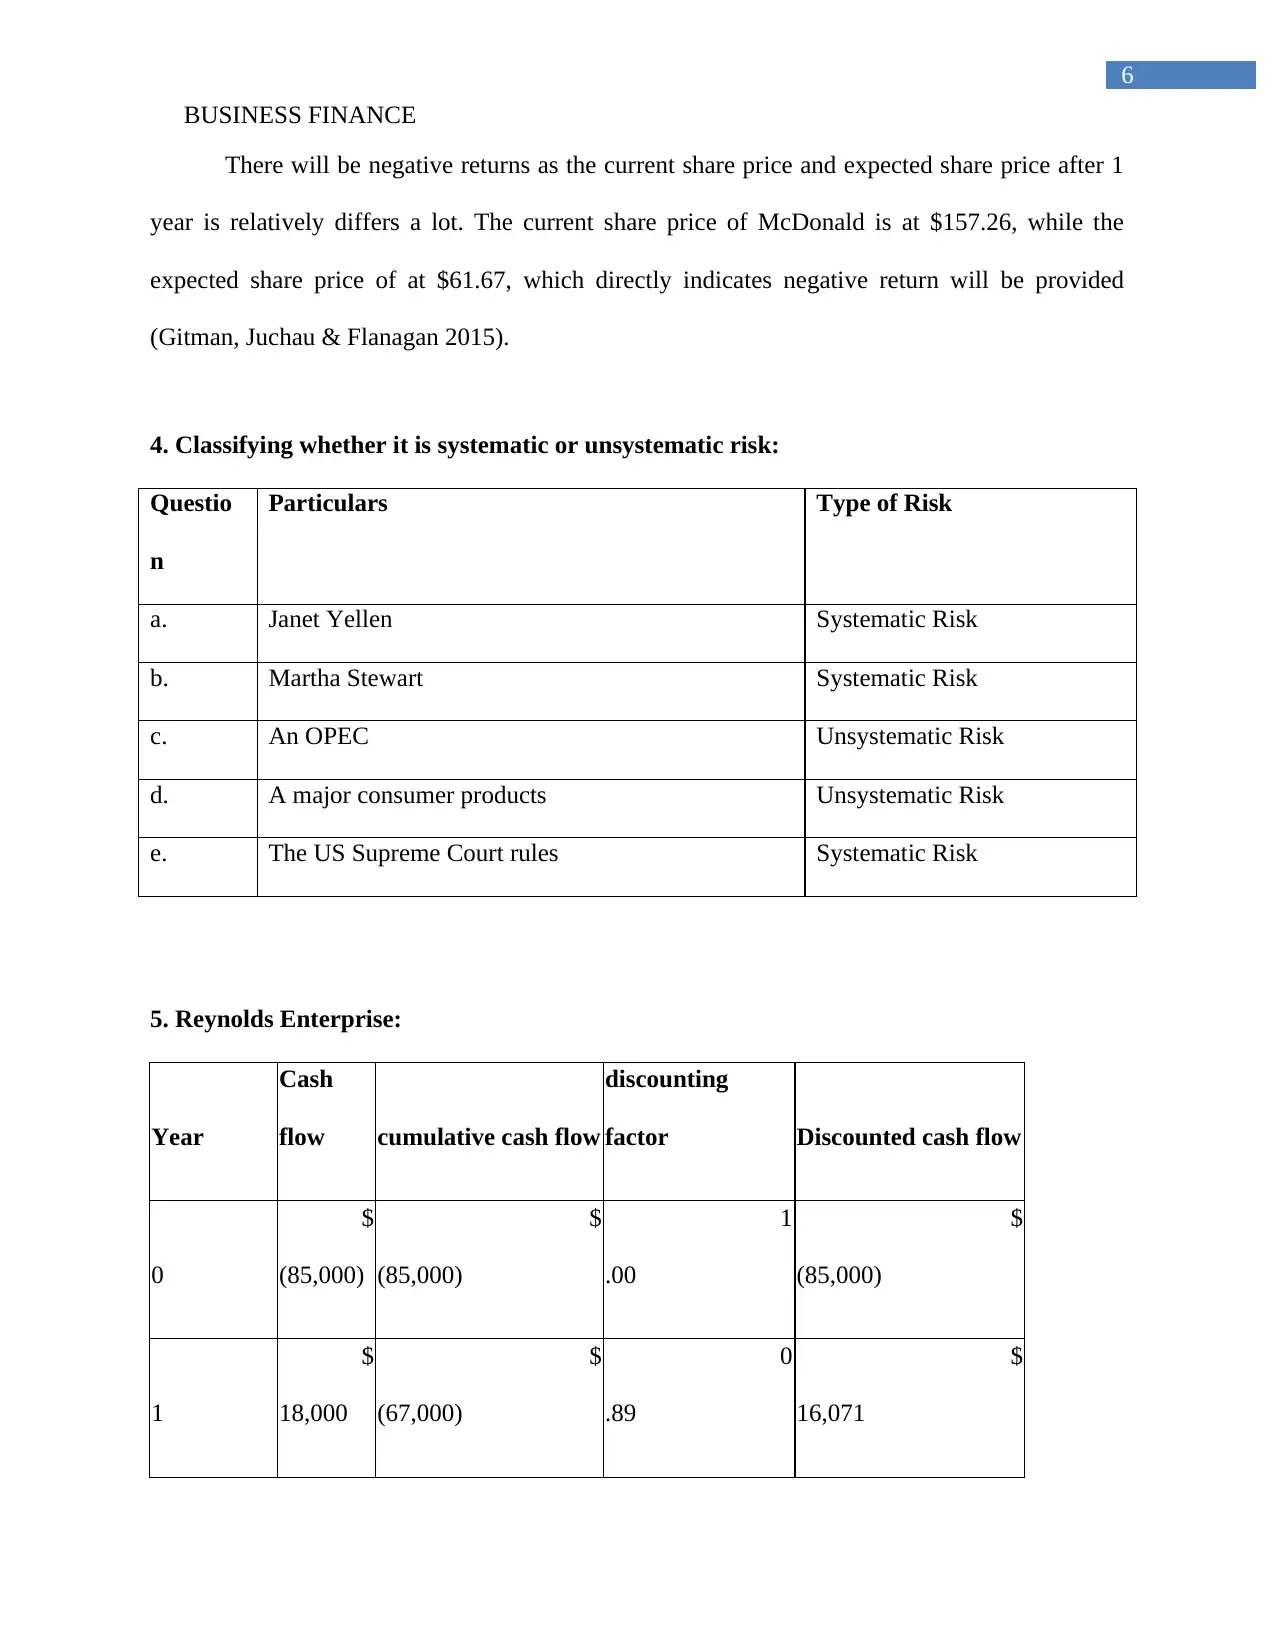
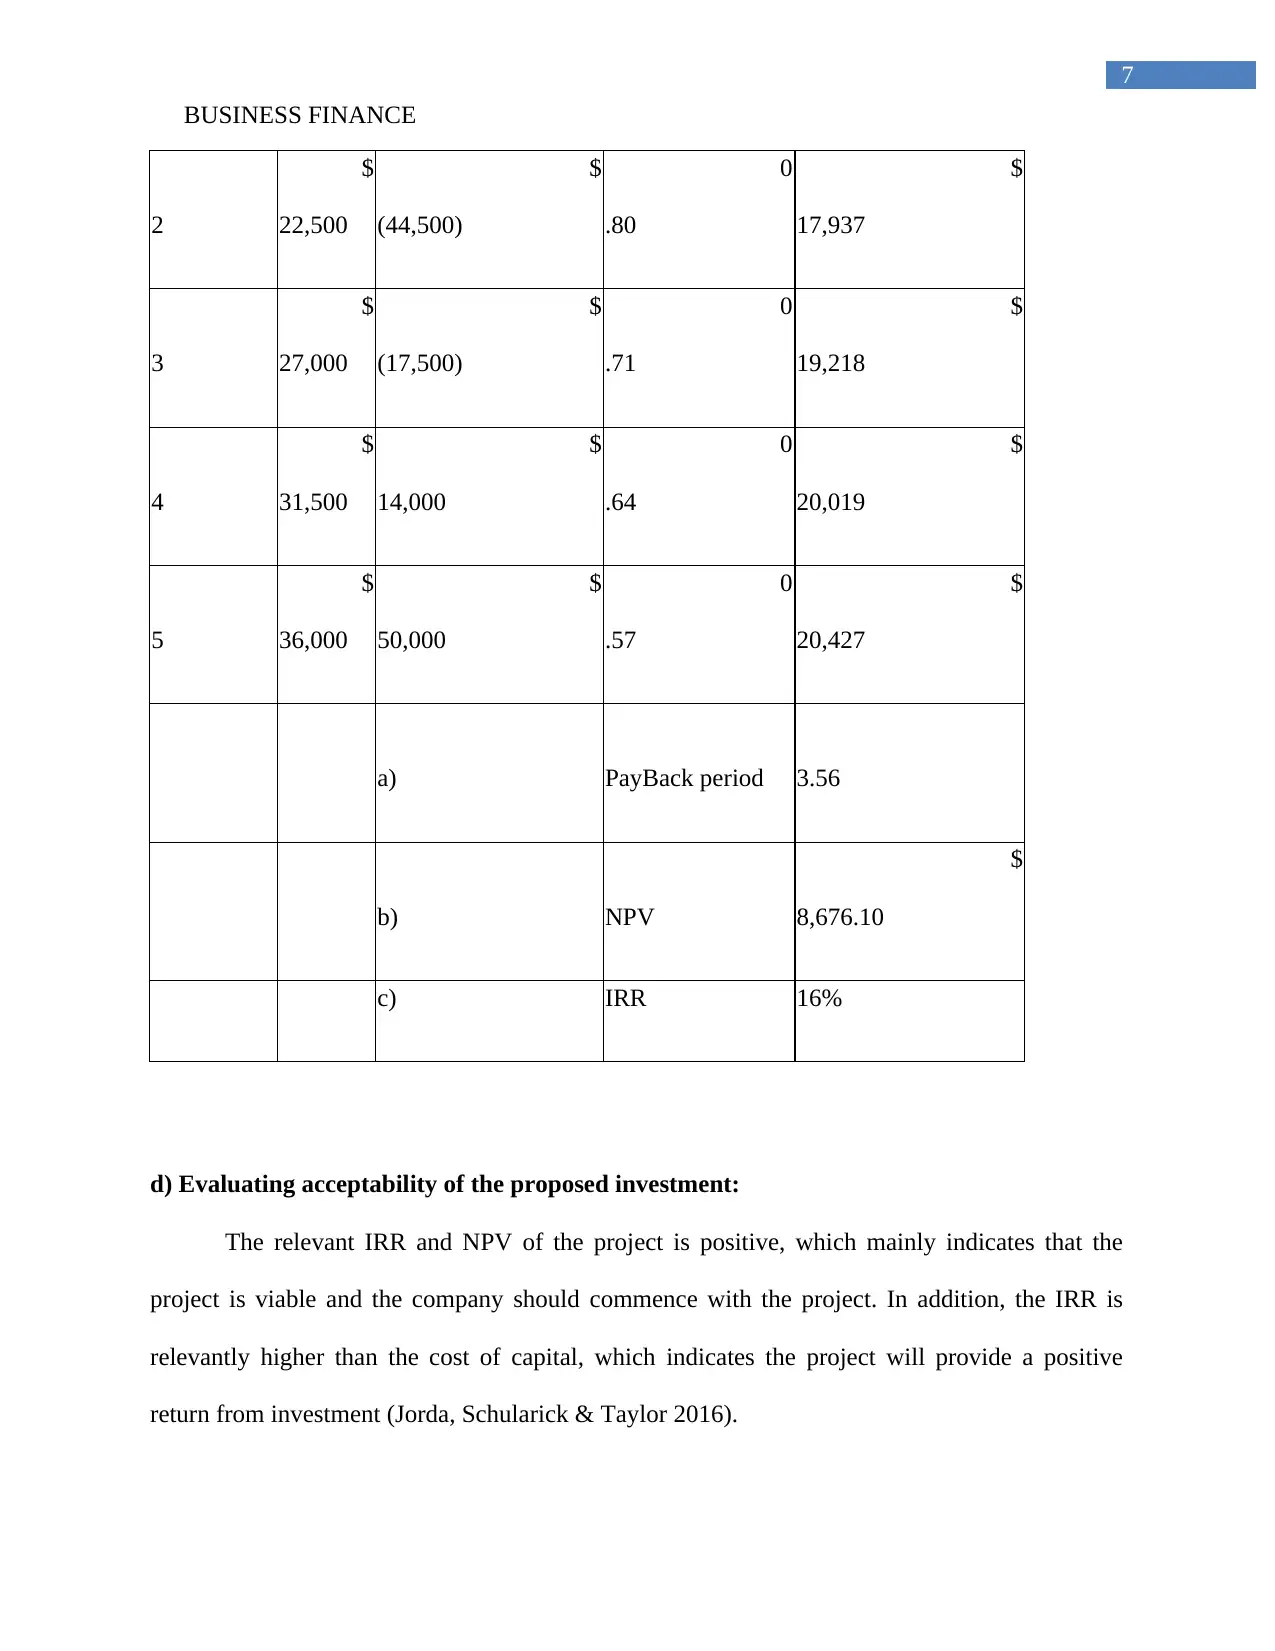
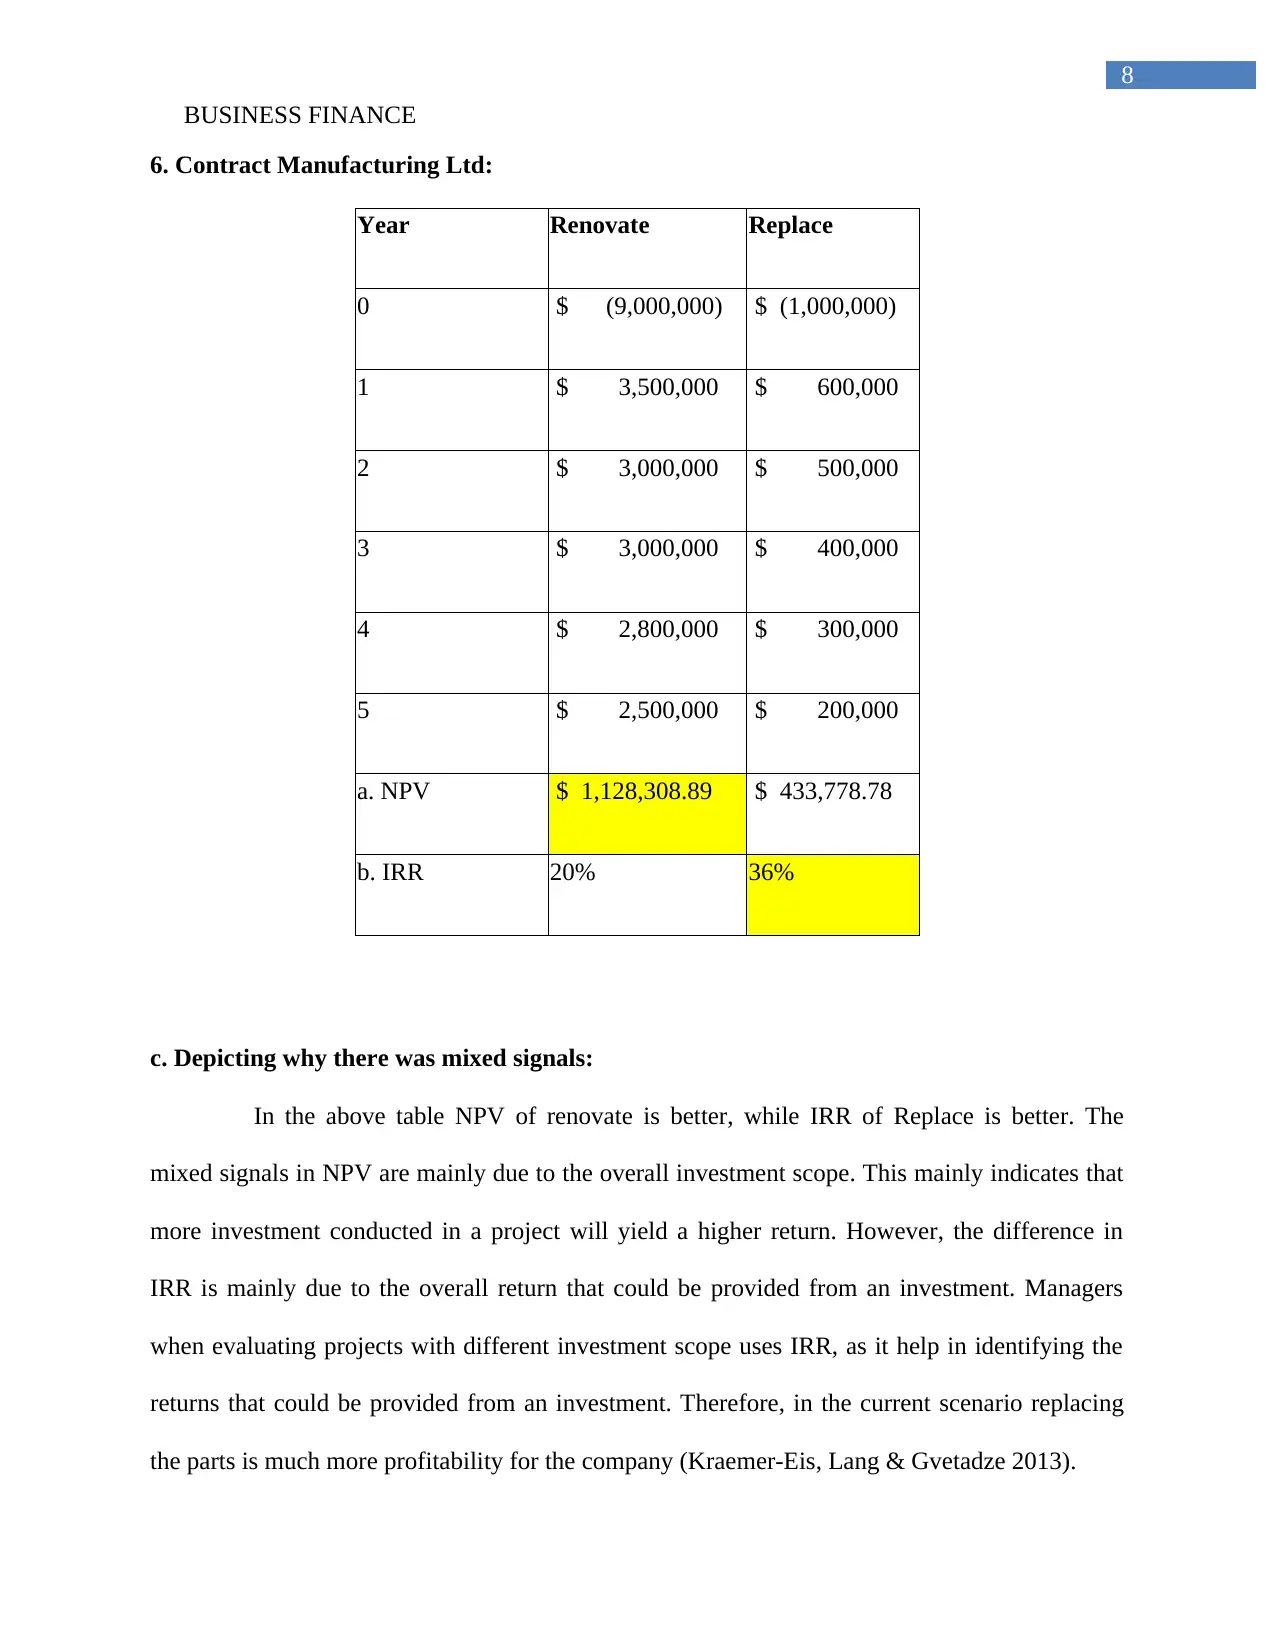
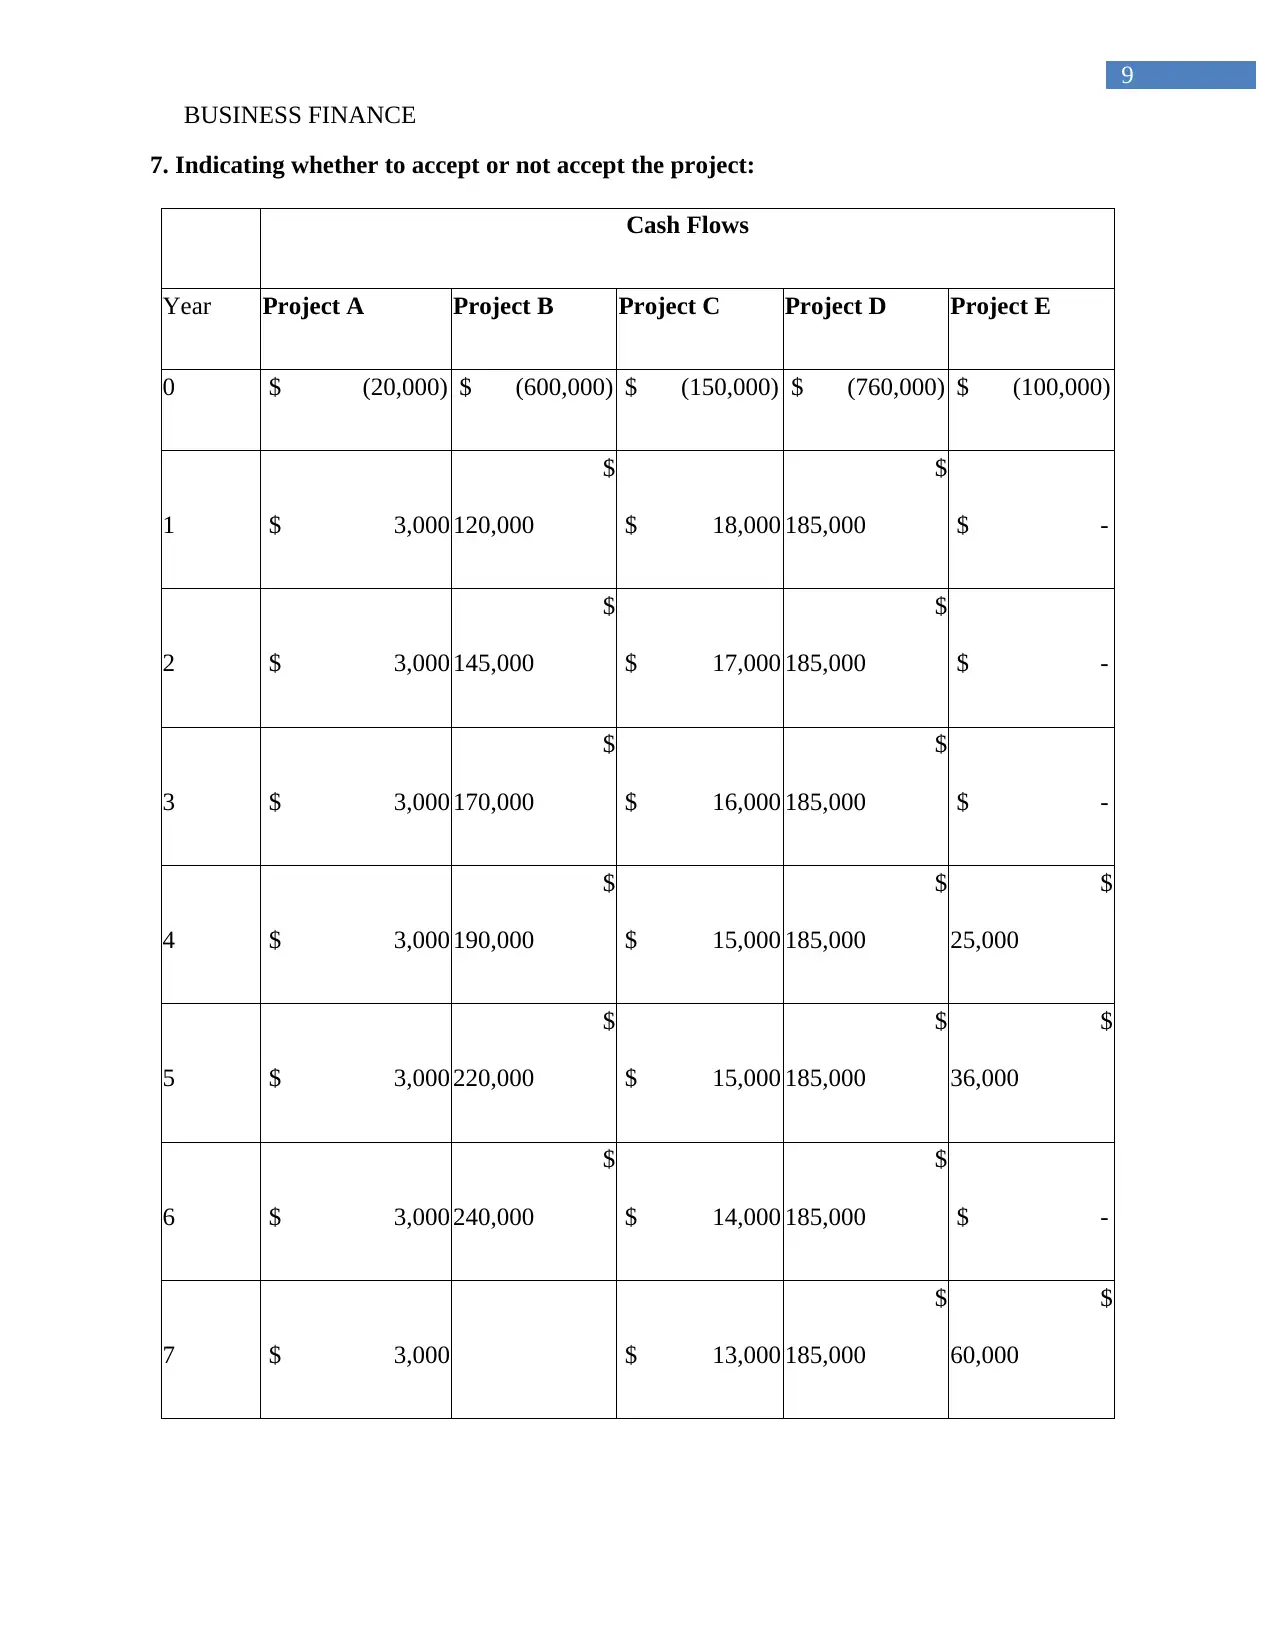
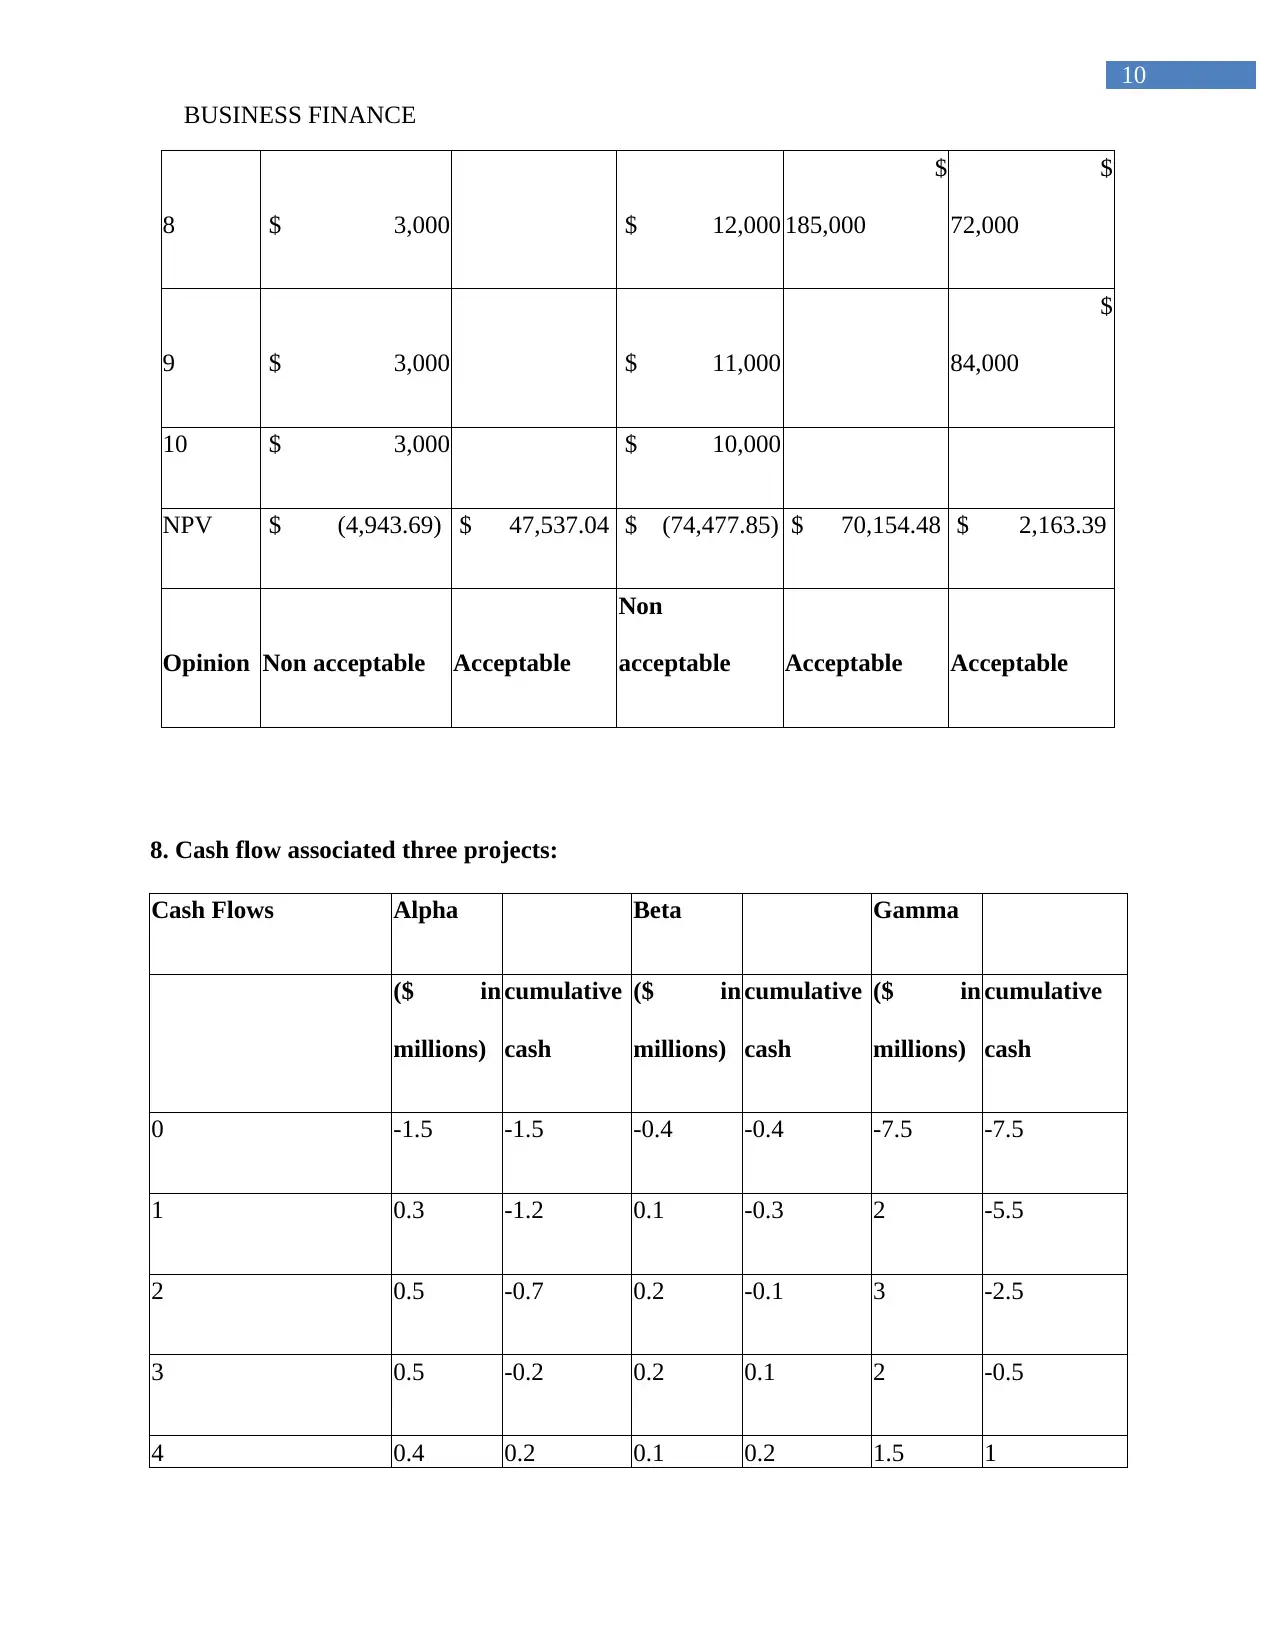
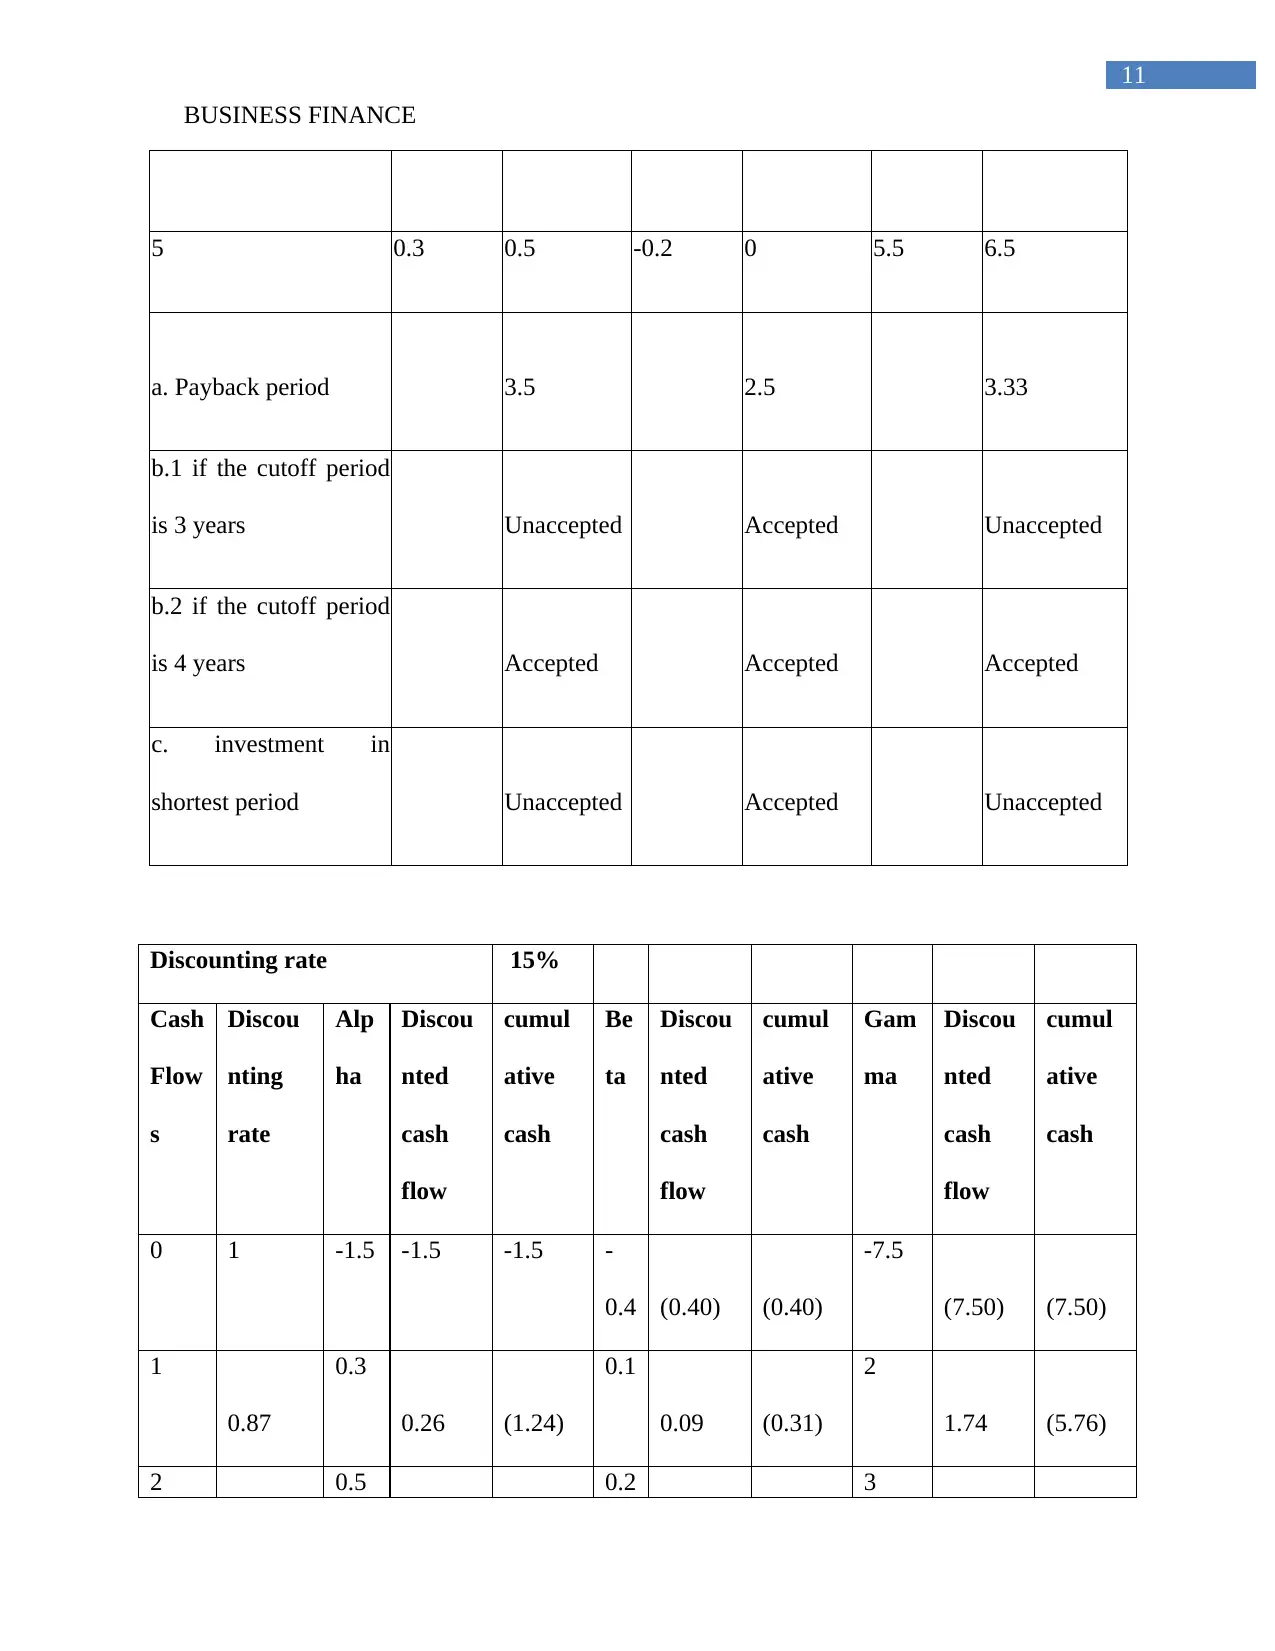
This business finance assignment provides solutions to a variety of financial problems, including calculations related to loan amortization, zero-coupon bonds, and stock valuation. The assignment analyzes risk classification, capital budgeting decisions, and the evaluation of investment projects using metrics like NPV, IRR, and payback period. It also covers the interpretation of financial ratios, portfolio management, and risk assessment, along with the depiction of an investor's risk attitude. The assignment utilizes real-world examples and financial models to illustrate key concepts and principles in business finance, offering a comprehensive overview of financial analysis and decision-making.

Running head: BUSINESS FINANCE
Business Finance
Name of the Student:
Name of the University:
Author’s Note:
Business Finance
Name of the Student:
Name of the University:
Author’s Note:
Paraphrase This Document
Need a fresh take? Get an instant paraphrase of this document with our AI Paraphraser

BUSINESS FINANCE
1
Table of Contents
1. Casino Corporation......................................................................................................................2
2. Zero coupon bonds:.....................................................................................................................4
3. McDonalds Corporation:.............................................................................................................5
4. Classifying whether it is systematic or unsystematic risk:..........................................................6
5. Reynolds Enterprise:....................................................................................................................6
d) Evaluating acceptability of the proposed investment:.................................................................7
6. Contract Manufacturing Ltd:.......................................................................................................8
c. Depicting why there was mixed signals:.....................................................................................8
7. Indicating whether to accept or not accept the project:...............................................................9
8. Cash flow associated three projects:..........................................................................................10
9. Identifying the kind of information that is provided by the following ratios:...........................12
10. Current portfolio:.....................................................................................................................13
References and Bibliography:........................................................................................................16

BUSINESS FINANCE
2
1. Casino Corporation
Particulars Value
Building value $ 25,000,000
Loan amount $ 20,000,000
Tenure 120
Interest rate 0.67%
Question Particulars Value
1) Monthly payment $ 242,655
2) First payment is interest $ 133,333
3) first payment is principal $ 109,322
4) Installments $ 242,655
Time 84
Total loan amount owed $15,568,577.62
5) Loan amount $ 15,568,578
Tenure 84
⊘ This is a preview!⊘
Do you want full access?
Subscribe today to unlock all pages.

Trusted by 1+ million students worldwide

BUSINESS FINANCE
3
Interest rate 0.58%
Refinance cost $ 250,000
Installments $ 242,655.19
Monthly loan payments $ 234,971.56
Difference $ 7,683.63
Present Value of difference $ 7,683.63
Time 84
Rate 0.58%
PV $509,096.39
6) Building value $ 25,000,000
Loan amount $ 20,000,000
Tenure 40
Interest rate 2.00%
Quarterly Payments $ 731,115
7) Quarterly Payments $ 731,114.96
Time 28
Paraphrase This Document
Need a fresh take? Get an instant paraphrase of this document with our AI Paraphraser

BUSINESS FINANCE
4
Total payments conducted in 3 years $15,559,056.50
8) Interest rate 8%
9) R 0.01
N 5.00
EAR 4.90
2. Zero coupon bonds:
Particulars Value
a) Current price 100
Time 10
Current price 78.12
Return 2.50%
Particulars Value
b) Bond price 78.12
Time 1
Current price 80.8542
Return 3.50%
4
Total payments conducted in 3 years $15,559,056.50
8) Interest rate 8%
9) R 0.01
N 5.00
EAR 4.90
2. Zero coupon bonds:
Particulars Value
a) Current price 100
Time 10
Current price 78.12
Return 2.50%
Particulars Value
b) Bond price 78.12
Time 1
Current price 80.8542
Return 3.50%

BUSINESS FINANCE
5
c) FV 1000
rate 3.50%
n 1
Market price $966.18
Bond price 1000
Coupon payment rate 2.50%
Market price $966.18
Coupon payment 25
Return for the year -0.88%
The difference in the returns is mainly due the buying price of the bond. In question b the
buying price was less and the selling price was much higher. However, in the above calculation
the selling price in less, which is why the return from investment even with the coupon payment
was not adequate (Cole 2013).
3. McDonalds Corporation:
Particulars Value
Dividend growth rate 5%
Market return 11%
Next annual dividend 3.7
Expected Share price of McDonalds $ 61.67
Current share price of McDonalds $ 157.26
⊘ This is a preview!⊘
Do you want full access?
Subscribe today to unlock all pages.

Trusted by 1+ million students worldwide

BUSINESS FINANCE
6
There will be negative returns as the current share price and expected share price after 1
year is relatively differs a lot. The current share price of McDonald is at $157.26, while the
expected share price of at $61.67, which directly indicates negative return will be provided
(Gitman, Juchau & Flanagan 2015).
4. Classifying whether it is systematic or unsystematic risk:
Questio
n
Particulars Type of Risk
a. Janet Yellen Systematic Risk
b. Martha Stewart Systematic Risk
c. An OPEC Unsystematic Risk
d. A major consumer products Unsystematic Risk
e. The US Supreme Court rules Systematic Risk
5. Reynolds Enterprise:
Year
Cash
flow cumulative cash flow
discounting
factor Discounted cash flow
0
$
(85,000)
$
(85,000)
1
.00
$
(85,000)
1
$
18,000
$
(67,000)
0
.89
$
16,071
Paraphrase This Document
Need a fresh take? Get an instant paraphrase of this document with our AI Paraphraser

BUSINESS FINANCE
7
2
$
22,500
$
(44,500)
0
.80
$
17,937
3
$
27,000
$
(17,500)
0
.71
$
19,218
4
$
31,500
$
14,000
0
.64
$
20,019
5
$
36,000
$
50,000
0
.57
$
20,427
a) PayBack period 3.56
b) NPV
$
8,676.10
c) IRR 16%
d) Evaluating acceptability of the proposed investment:
The relevant IRR and NPV of the project is positive, which mainly indicates that the
project is viable and the company should commence with the project. In addition, the IRR is
relevantly higher than the cost of capital, which indicates the project will provide a positive
return from investment (Jorda, Schularick & Taylor 2016).

BUSINESS FINANCE
8
6. Contract Manufacturing Ltd:
Year Renovate Replace
0 $ (9,000,000) $ (1,000,000)
1 $ 3,500,000 $ 600,000
2 $ 3,000,000 $ 500,000
3 $ 3,000,000 $ 400,000
4 $ 2,800,000 $ 300,000
5 $ 2,500,000 $ 200,000
a. NPV $ 1,128,308.89 $ 433,778.78
b. IRR 20% 36%
c. Depicting why there was mixed signals:
In the above table NPV of renovate is better, while IRR of Replace is better. The
mixed signals in NPV are mainly due to the overall investment scope. This mainly indicates that
more investment conducted in a project will yield a higher return. However, the difference in
IRR is mainly due to the overall return that could be provided from an investment. Managers
when evaluating projects with different investment scope uses IRR, as it help in identifying the
returns that could be provided from an investment. Therefore, in the current scenario replacing
the parts is much more profitability for the company (Kraemer-Eis, Lang & Gvetadze 2013).
⊘ This is a preview!⊘
Do you want full access?
Subscribe today to unlock all pages.

Trusted by 1+ million students worldwide

BUSINESS FINANCE
9
7. Indicating whether to accept or not accept the project:
Cash Flows
Year Project A Project B Project C Project D Project E
0 $ (20,000) $ (600,000) $ (150,000) $ (760,000) $ (100,000)
1 $ 3,000
$
120,000 $ 18,000
$
185,000 $ -
2 $ 3,000
$
145,000 $ 17,000
$
185,000 $ -
3 $ 3,000
$
170,000 $ 16,000
$
185,000 $ -
4 $ 3,000
$
190,000 $ 15,000
$
185,000
$
25,000
5 $ 3,000
$
220,000 $ 15,000
$
185,000
$
36,000
6 $ 3,000
$
240,000 $ 14,000
$
185,000 $ -
7 $ 3,000 $ 13,000
$
185,000
$
60,000
Paraphrase This Document
Need a fresh take? Get an instant paraphrase of this document with our AI Paraphraser

BUSINESS FINANCE
10
8 $ 3,000 $ 12,000
$
185,000
$
72,000
9 $ 3,000 $ 11,000
$
84,000
10 $ 3,000 $ 10,000
NPV $ (4,943.69) $ 47,537.04 $ (74,477.85) $ 70,154.48 $ 2,163.39
Opinion Non acceptable Acceptable
Non
acceptable Acceptable Acceptable
8. Cash flow associated three projects:
Cash Flows Alpha Beta Gamma
($ in
millions)
cumulative
cash
($ in
millions)
cumulative
cash
($ in
millions)
cumulative
cash
0 -1.5 -1.5 -0.4 -0.4 -7.5 -7.5
1 0.3 -1.2 0.1 -0.3 2 -5.5
2 0.5 -0.7 0.2 -0.1 3 -2.5
3 0.5 -0.2 0.2 0.1 2 -0.5
4 0.4 0.2 0.1 0.2 1.5 1

BUSINESS FINANCE
11
5 0.3 0.5 -0.2 0 5.5 6.5
a. Payback period 3.5 2.5 3.33
b.1 if the cutoff period
is 3 years Unaccepted Accepted Unaccepted
b.2 if the cutoff period
is 4 years Accepted Accepted Accepted
c. investment in
shortest period Unaccepted Accepted Unaccepted
Discounting rate 15%
Cash
Flow
s
Discou
nting
rate
Alp
ha
Discou
nted
cash
flow
cumul
ative
cash
Be
ta
Discou
nted
cash
flow
cumul
ative
cash
Gam
ma
Discou
nted
cash
flow
cumul
ative
cash
0 1 -1.5 -1.5 -1.5 -
0.4 (0.40) (0.40)
-7.5
(7.50) (7.50)
1
0.87
0.3
0.26 (1.24)
0.1
0.09 (0.31)
2
1.74 (5.76)
2 0.5 0.2 3
⊘ This is a preview!⊘
Do you want full access?
Subscribe today to unlock all pages.

Trusted by 1+ million students worldwide

BUSINESS FINANCE
12
0.76 0.38 (0.86) 0.15 (0.16) 2.27 (3.49)
3
0.66
0.5
0.33 (0.53)
0.2
0.13 (0.03)
2
1.32 (2.18)
4
0.57
0.4
0.23 (0.30)
0.1
0.06 0.03
1.5
0.86 (1.32)
5
0.50
0.3
0.15 (0.15)
-
0.2 (0.10) (0.07)
5.5
2.73 1.41
Payback period 5 year and
more 3.53
4.48
Particulars Alpha Beta Gamma
d. Payback period of four years Unaccepted Accepted Unaccepted
e. project could be saved using payback Accepted
f. One of the project should be used
discarding discounting rate
Accepted
9. Identifying the kind of information that is provided by the following ratios:
Ratios Explanation
Quick ratio This ratio allows investors to detect the actual liquidity condition of
the organist ion. The quick ratio needs to be more than 1.
Cash ratio The ratio mainly allows investors to gauge into the cash
accumulation of the company, which could be able to support its
Paraphrase This Document
Need a fresh take? Get an instant paraphrase of this document with our AI Paraphraser

BUSINESS FINANCE
13
current liabilities.
Capital intensity ratio The ratio is used to identify the relevant capital employed for
generating the revenue.
Total asset turnover The ratio mainly uses sales value and average total assets to
determine the company ability to generate the sales with the
deployed assets.
Equity multiplier Equity multipliers is used to detect the amount of firms assets, which
is been financed by the shareholders. This ratio helps in detecting the
debt accumulation of the company.
Long-term debt ratio The ratio allows the investors to detect the percentage of a company
asset, which is been financed by debt, loan or other financial
obligations.
Times interest earned
ratio
With the help of this ratio investors are able to detect company’s
ability to pay the interest on loan.
Profit margin With the help of profit margin ratio the investors are able to detect
every dollar of sales in comparison with the net profit. Investors use
the ratio for detecting increment in net profit from previous fiscal
year.
Return on assets The ratio mainly helps in portraying the percentage of profit that the
company earns after deploying all the relevant resources.
Return on equity The ratio portrays ability of the firm to generate the required profits
with the investments of the shareholders.
Price earnings ratio With the help of price earnings ratio investor are able to detect future

BUSINESS FINANCE
14
prices of a stock
10. Current portfolio:
a) Stock Rate of return
Fire 10.80%
Water 14.00%
Air 16.80%
b) Name of Company $m invested Weight Rate of return
Fire $2 20.00% 10.80%
Water $3 30.00% 14.00%
Air $5 50.00% 16.80%
TOTAL $10
Required rate of return of
portfolio
14.76%
c) Name of Company $m invested Weight Beta
Fire $2 20.00%
0.8
5
Water $3 30.00% 1.2
⊘ This is a preview!⊘
Do you want full access?
Subscribe today to unlock all pages.

Trusted by 1+ million students worldwide
1 out of 15
Related Documents

Your All-in-One AI-Powered Toolkit for Academic Success.
+13062052269
info@desklib.com
Available 24*7 on WhatsApp / Email
Unlock your academic potential
© 2024 | Zucol Services PVT LTD | All rights reserved.