Business Finance: Analysis of Housing Market Trends and Returns
VerifiedAdded on 2021/05/31
|21
|4000
|22
Report
AI Summary
This business finance report offers a comprehensive analysis of housing market trends in Sydney, Hobart, and Newcastle over a 30-year period. It compares real estate returns with Australian stocks and bonds, evaluating the performance of residential property investments. The report examines property prices, income levels of architects, and the house price-to-income ratio in the three cities. Additionally, it explores mortgage mechanisms, referencing SUB Bank of Australia to determine mortgage conditions. The report also includes graphical representations and comparisons, providing a detailed overview of the housing market's dynamics and investment potential, with the data presented and analyzed thoroughly.

RUNNING HEAD: BUSINESS FINANCE
housing finance
housing finance
Paraphrase This Document
Need a fresh take? Get an instant paraphrase of this document with our AI Paraphraser
Business finance 1
Contents
Introduction................................................................................................................................2
Part 1..........................................................................................................................................2
Housing prices over 30 years.................................................................................................2
Real estate returns VS stock and bond returns.......................................................................3
Part 2..........................................................................................................................................5
Property prices in three cities.................................................................................................5
Comparing the prices..............................................................................................................6
Income level of an architect...................................................................................................6
The house price to income level ratio.....................................................................................6
References..................................................................................................................................7
Business finance 2
Introduction
The report contains an overall analysis of housing prices in the cities named as
Sydney, Hobart and Newcastle. In the first part, the trend in housing prices of each city over
the period of 30 years is been noticed and the performance of real estate market is evaluated.
The performance of housing is then compared to the Australian stocks and bonds. The report
also focuses on the average returns delivered by the residential property in Australia in
relation with its stocks and bonds. The performance is measured on the basis of 10 years and
20 years average annual gross returns given by the direct investment in residential property,
Australian stocks and bonds. The second part of the report contains a comparison of the
house prices in three cities respectively. The income level of an architect in those cities is
also analysed and then a house price to income level ratio is calculated. In third part how
mortgages work and taking the SUB bank of Australia for the purpose of determining the
conditions for mortgage have been analysed in general. A detailed analysis of the same has
been done in the excel sheet.
Part 1
Housing prices over 30 years
The following graph shows the trends in house prices in the cities of Australia. The
cities include Sydney, Hobart and Newcastle. In order to purchase a property in one of these
cities, the trend in their housing prices is observed over the past 30 years.
⊘ This is a preview!⊘
Do you want full access?
Subscribe today to unlock all pages.
Trusted by 1+ million students worldwide
Business finance 3
1988
1990
1992
1994
1996
1998
2000
2002
2004
2006
2008
2010
2012
2014
2016
2018
0
200,000
400,000
600,000
800,000
1,000,000
1,200,000
House prices
Sydney Hobart New Castle
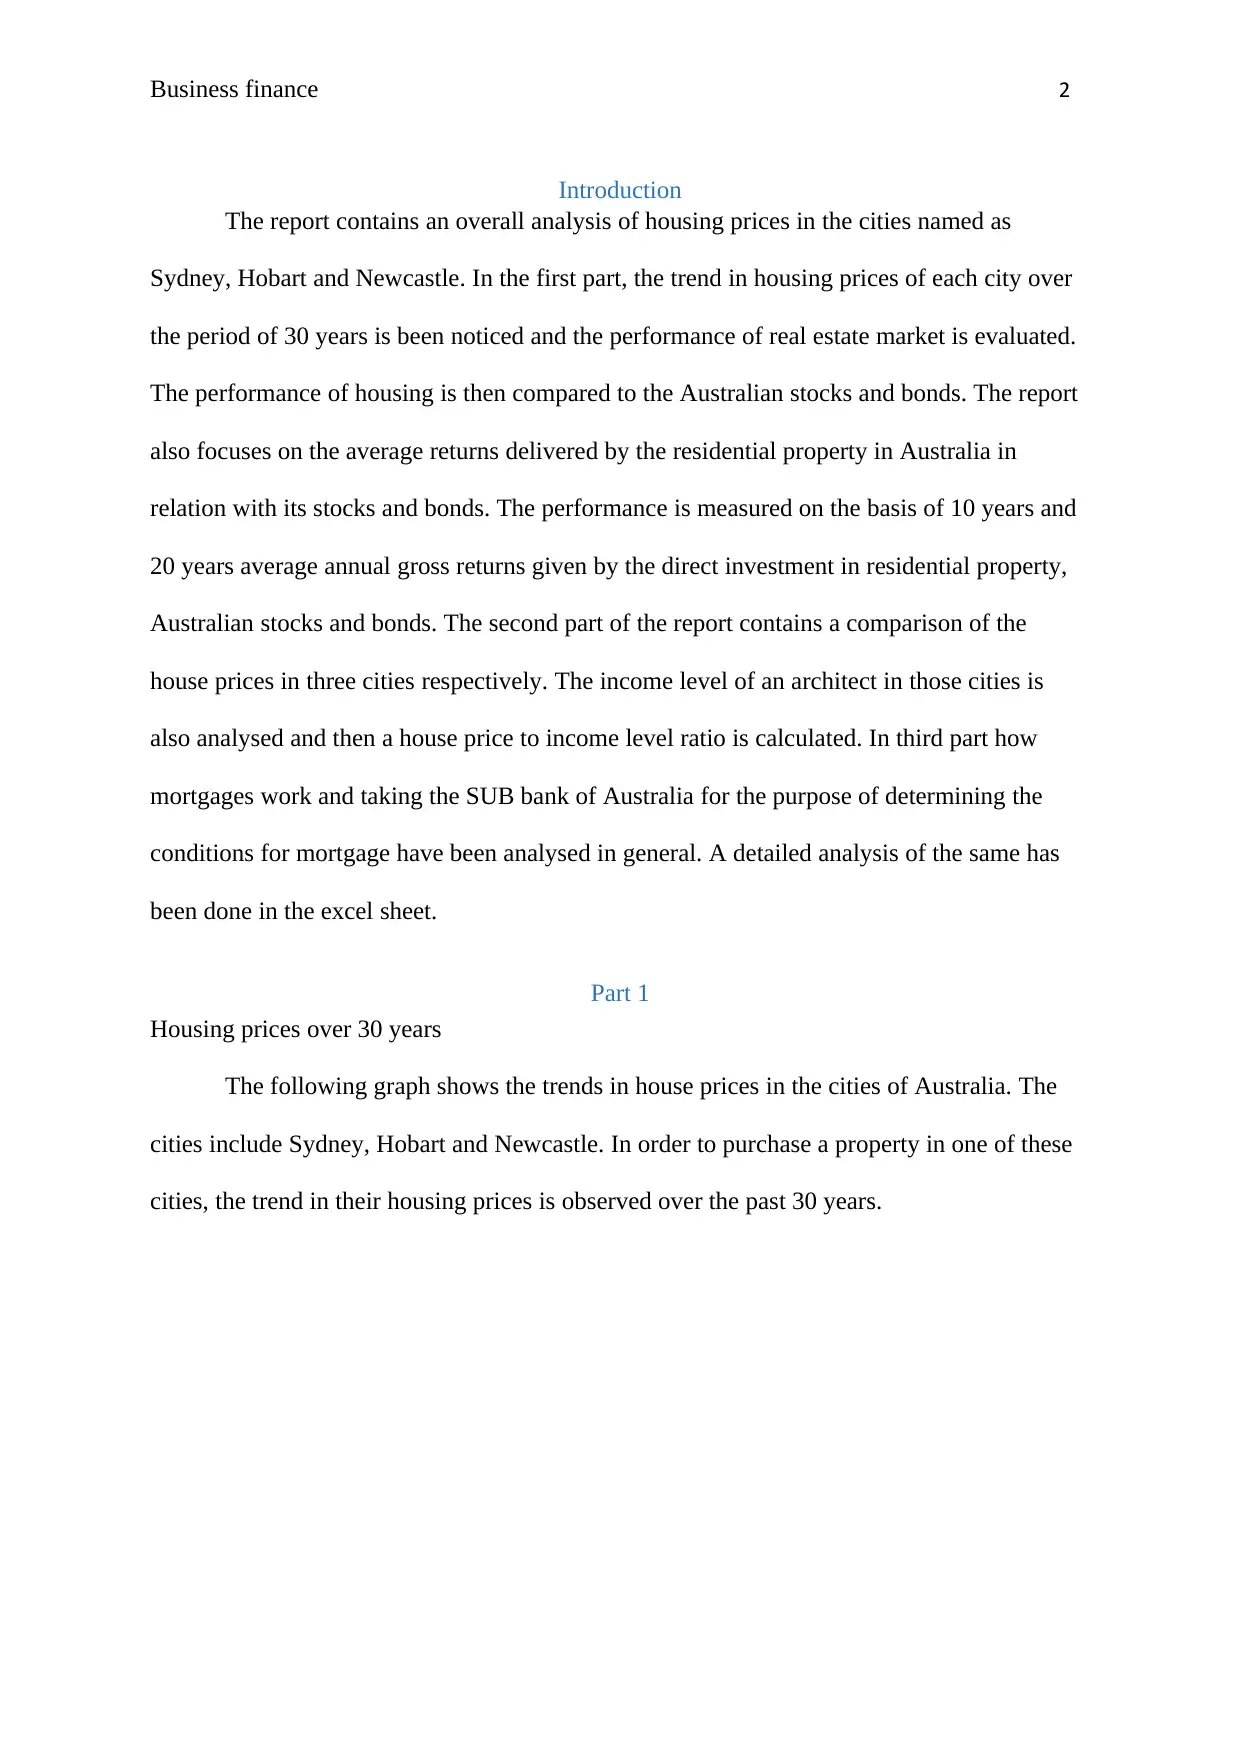
(Source: By Author)
The above graph depicts the trend or movements in the house prices of each city
respectively. At a glance, it can be said that Sydney has the highest prices and Newcastle
reports the lowest. Talking about Sydney, Australia, it is observed that an upward trend is
been there in city’s house prices. In 1998, the price was $141,000 which has now reached to
$880,743. The trend line that denotes Sydney’s prices is continuously moving upwards with
fewer fluctuations (Duke, 2018). During the period of 30 years, the highest price charged for
purchasing a house in Sydney was $972,000 in 2014. During the first ten or twelve years, a
Limitations ant rise was there in the prices. After that in year 2011 and 2012, the prices
reduce and then again increases and reaches to $972,000 in 2014. Post that period, a fall has
been there in the prices (Abelson & Chung, 2005).
As far as Hobart is concerned, its trend line is also in upward direction and its housing
price has also risen during the past 30 years. In 1998, the price was $86,000 which now has
reached to $416,840. A huge increase in the house prices of Hobart was seen during 1992 and
1993. That was the time when the price gets a huge hike and was reported at $150,500 in
1988
1990
1992
1994
1996
1998
2000
2002
2004
2006
2008
2010
2012
2014
2016
2018
0
200,000
400,000
600,000
800,000
1,000,000
1,200,000
House prices
Sydney Hobart New Castle
(Source: By Author)
The above graph depicts the trend or movements in the house prices of each city
respectively. At a glance, it can be said that Sydney has the highest prices and Newcastle
reports the lowest. Talking about Sydney, Australia, it is observed that an upward trend is
been there in city’s house prices. In 1998, the price was $141,000 which has now reached to
$880,743. The trend line that denotes Sydney’s prices is continuously moving upwards with
fewer fluctuations (Duke, 2018). During the period of 30 years, the highest price charged for
purchasing a house in Sydney was $972,000 in 2014. During the first ten or twelve years, a
Limitations ant rise was there in the prices. After that in year 2011 and 2012, the prices
reduce and then again increases and reaches to $972,000 in 2014. Post that period, a fall has
been there in the prices (Abelson & Chung, 2005).
As far as Hobart is concerned, its trend line is also in upward direction and its housing
price has also risen during the past 30 years. In 1998, the price was $86,000 which now has
reached to $416,840. A huge increase in the house prices of Hobart was seen during 1992 and
1993. That was the time when the price gets a huge hike and was reported at $150,500 in
Paraphrase This Document
Need a fresh take? Get an instant paraphrase of this document with our AI Paraphraser
Business finance 4
1933 as compared to $126,125 in 1992. After that, a continuous rise was there in the prices
and in 2017 it was $805,000 (Realestate.com.au. 2018).
The trend line of Newcastle has shown a little upward movement and is seems to be
stable for the past 30 years. This city has the lowest housing prices as compare to Sydney and
Hobart. In 1998, the housing price in Newcastle was $77,460 which has now reached to
$198,200. The prices in Newcastle has continuously risen till 2007 after that a decreasing
trend was noticed in the prices (Fred. 2018).
1992
1994
1996
1998
2000
2002
2004
2006
2008
2010
2012
2014
2016
2018
0
1000
2000
3000
4000
5000
6000
7000
S&P ASX 200
Adj Close
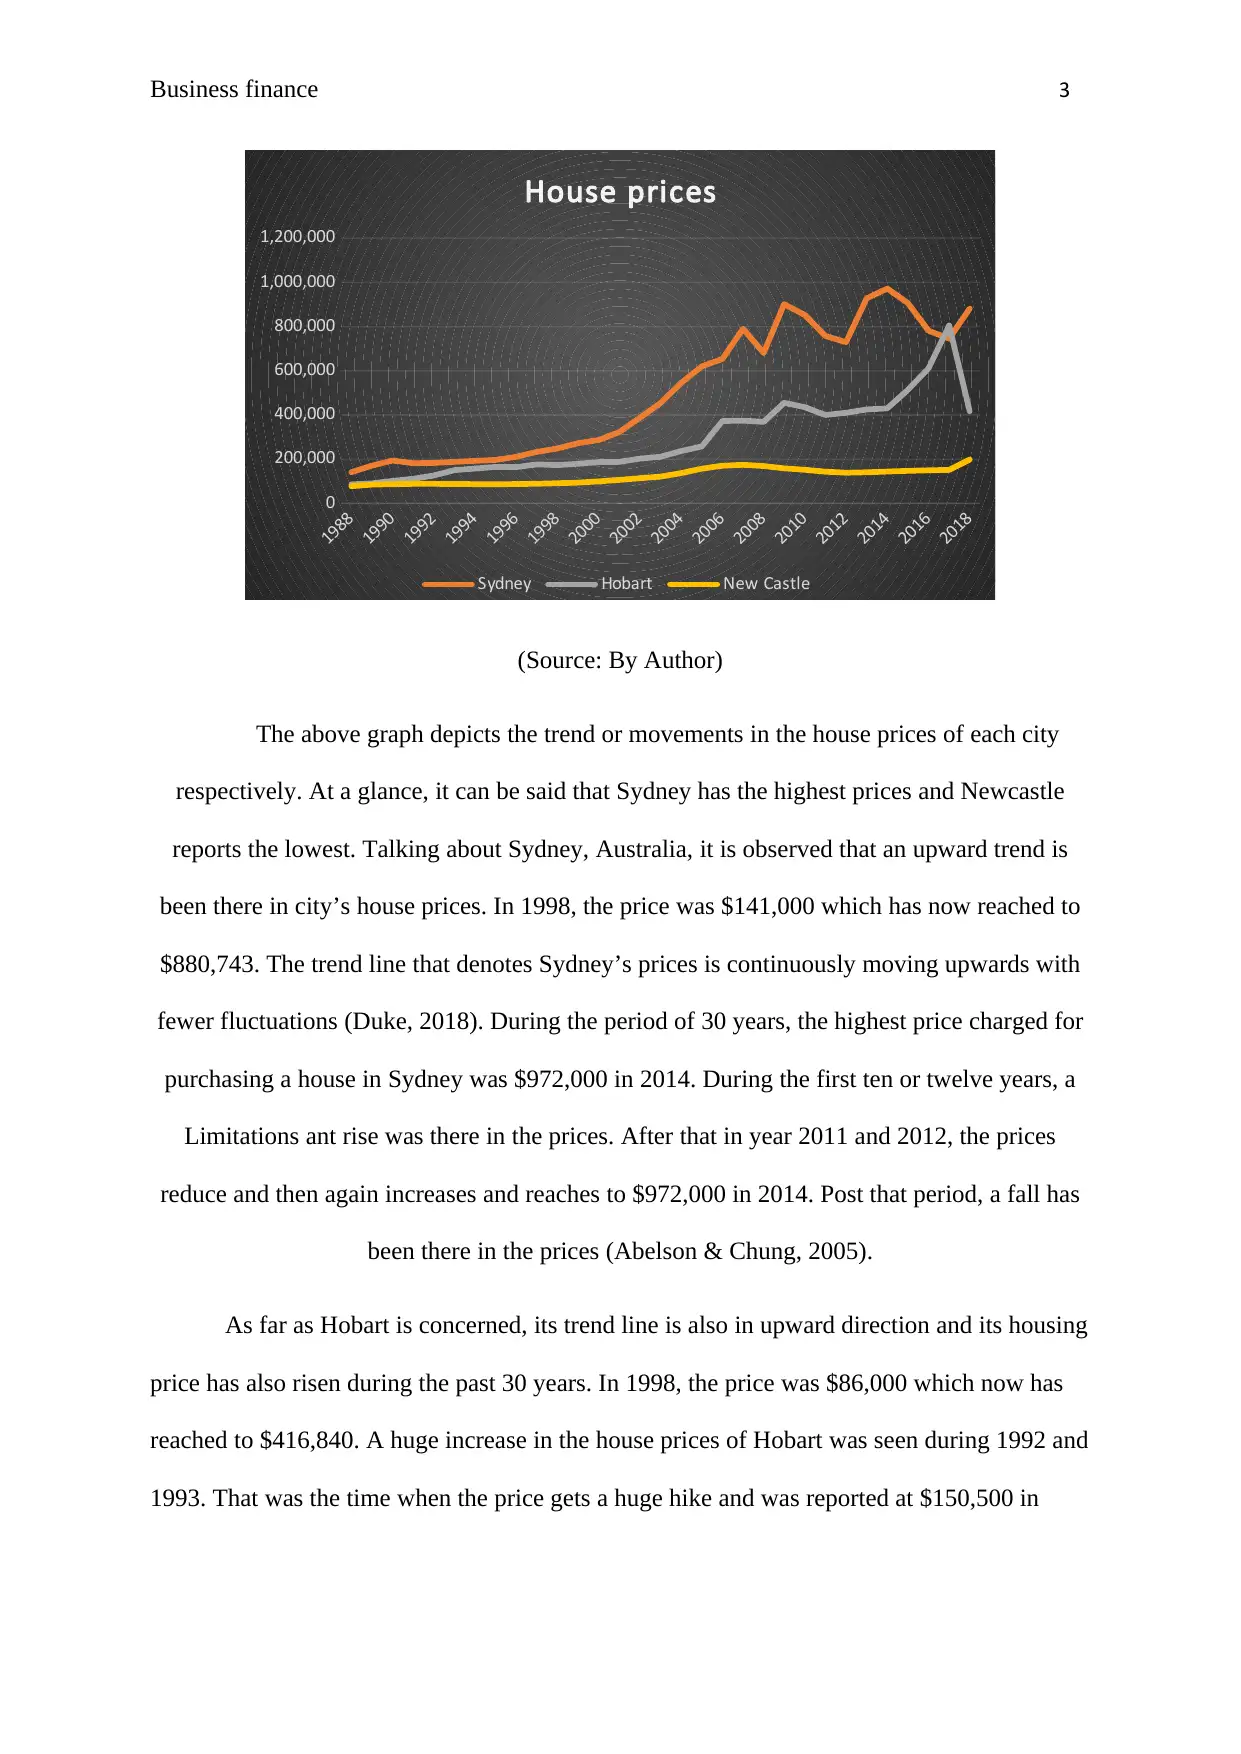
(Source: By Author)
As compared to the Australian stocks, the housing prices of Sydney has performed
much better as they are been continuously rising since 1988. The same trend can also be
noticed in the stock prices of S&P ASX 200. The prices continuously rise over the period
having less fluctuations and it was reported highest at $5773.4 in 2006. After that the prices
drop to a great extent and then suddenly rise. The stock is currently trading at $6087.4. When
comparing such trends with the housing prices of Hobart and Newcastle, it is observed that
both the cities have shown an upward trend in the prices but still has underperformed than the
ASX 200 (Yahoo Finance. 2018).
1933 as compared to $126,125 in 1992. After that, a continuous rise was there in the prices
and in 2017 it was $805,000 (Realestate.com.au. 2018).
The trend line of Newcastle has shown a little upward movement and is seems to be
stable for the past 30 years. This city has the lowest housing prices as compare to Sydney and
Hobart. In 1998, the housing price in Newcastle was $77,460 which has now reached to
$198,200. The prices in Newcastle has continuously risen till 2007 after that a decreasing
trend was noticed in the prices (Fred. 2018).
1992
1994
1996
1998
2000
2002
2004
2006
2008
2010
2012
2014
2016
2018
0
1000
2000
3000
4000
5000
6000
7000
S&P ASX 200
Adj Close
(Source: By Author)
As compared to the Australian stocks, the housing prices of Sydney has performed
much better as they are been continuously rising since 1988. The same trend can also be
noticed in the stock prices of S&P ASX 200. The prices continuously rise over the period
having less fluctuations and it was reported highest at $5773.4 in 2006. After that the prices
drop to a great extent and then suddenly rise. The stock is currently trading at $6087.4. When
comparing such trends with the housing prices of Hobart and Newcastle, it is observed that
both the cities have shown an upward trend in the prices but still has underperformed than the
ASX 200 (Yahoo Finance. 2018).
Business finance 5
Real estate returns VS stock and bond returns
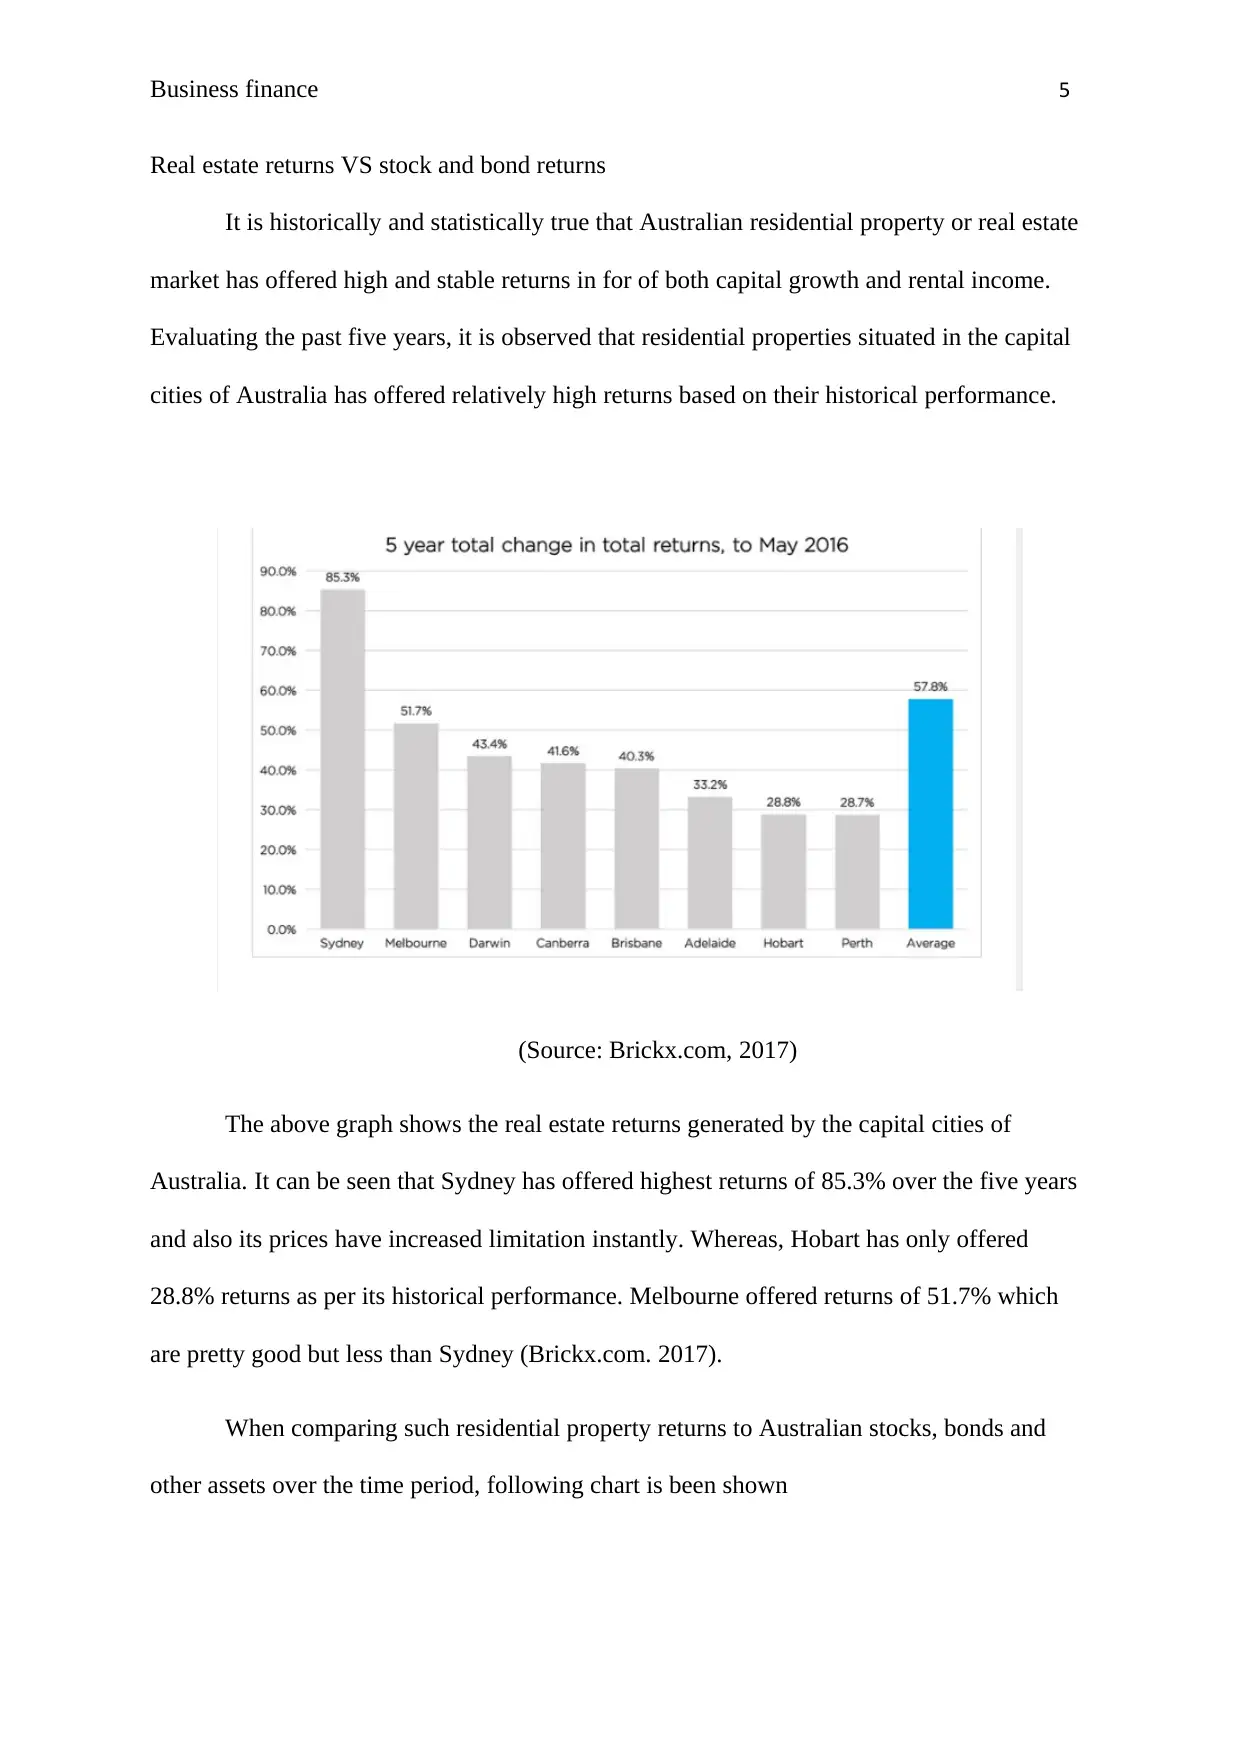
It is historically and statistically true that Australian residential property or real estate
market has offered high and stable returns in for of both capital growth and rental income.
Evaluating the past five years, it is observed that residential properties situated in the capital
cities of Australia has offered relatively high returns based on their historical performance.
(Source: Brickx.com, 2017)
The above graph shows the real estate returns generated by the capital cities of
Australia. It can be seen that Sydney has offered highest returns of 85.3% over the five years
and also its prices have increased limitation instantly. Whereas, Hobart has only offered
28.8% returns as per its historical performance. Melbourne offered returns of 51.7% which
are pretty good but less than Sydney (Brickx.com. 2017).
When comparing such residential property returns to Australian stocks, bonds and
other assets over the time period, following chart is been shown
Real estate returns VS stock and bond returns
It is historically and statistically true that Australian residential property or real estate
market has offered high and stable returns in for of both capital growth and rental income.
Evaluating the past five years, it is observed that residential properties situated in the capital
cities of Australia has offered relatively high returns based on their historical performance.
(Source: Brickx.com, 2017)
The above graph shows the real estate returns generated by the capital cities of
Australia. It can be seen that Sydney has offered highest returns of 85.3% over the five years
and also its prices have increased limitation instantly. Whereas, Hobart has only offered
28.8% returns as per its historical performance. Melbourne offered returns of 51.7% which
are pretty good but less than Sydney (Brickx.com. 2017).
When comparing such residential property returns to Australian stocks, bonds and
other assets over the time period, following chart is been shown
⊘ This is a preview!⊘
Do you want full access?
Subscribe today to unlock all pages.
Trusted by 1+ million students worldwide
Business finance 6
(Source: Brickx.com, 2017)
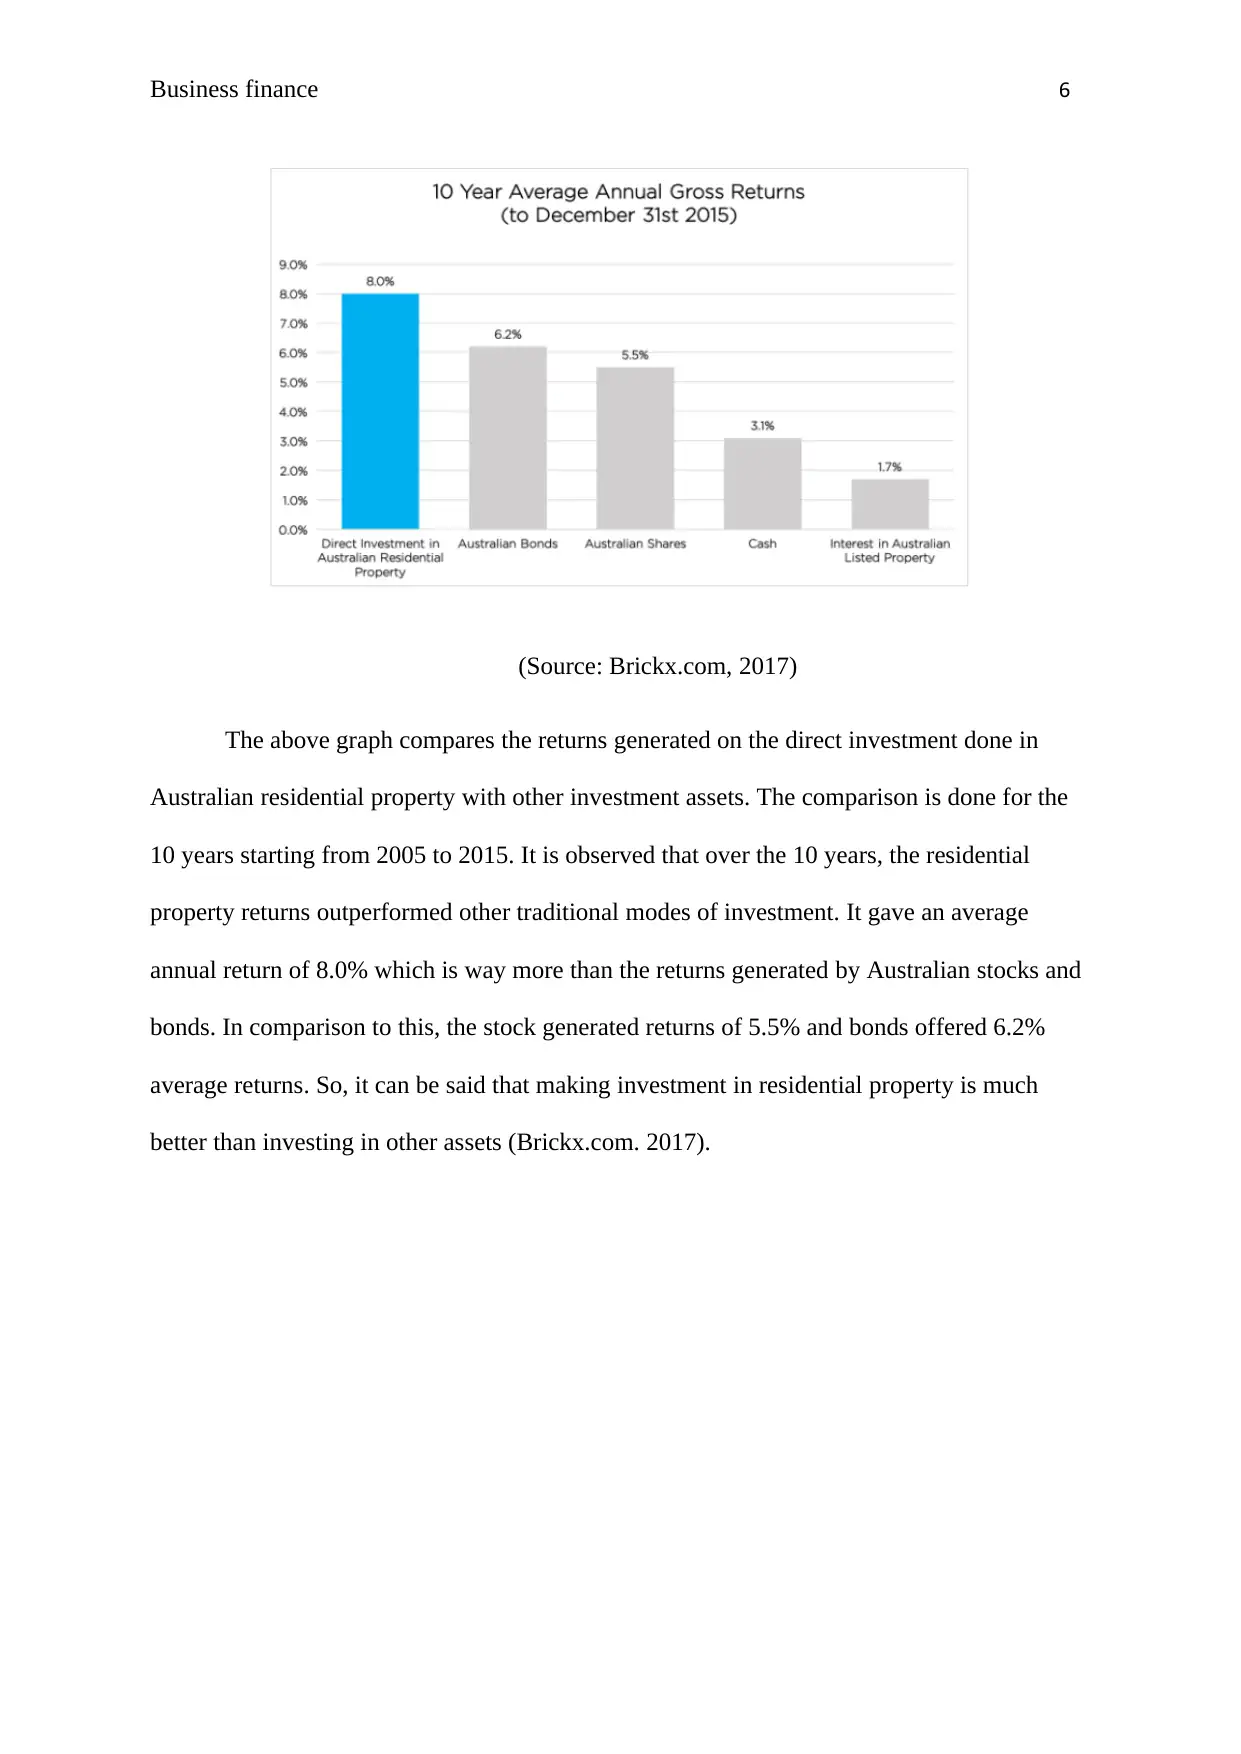
The above graph compares the returns generated on the direct investment done in
Australian residential property with other investment assets. The comparison is done for the
10 years starting from 2005 to 2015. It is observed that over the 10 years, the residential
property returns outperformed other traditional modes of investment. It gave an average
annual return of 8.0% which is way more than the returns generated by Australian stocks and
bonds. In comparison to this, the stock generated returns of 5.5% and bonds offered 6.2%
average returns. So, it can be said that making investment in residential property is much
better than investing in other assets (Brickx.com. 2017).
(Source: Brickx.com, 2017)
The above graph compares the returns generated on the direct investment done in
Australian residential property with other investment assets. The comparison is done for the
10 years starting from 2005 to 2015. It is observed that over the 10 years, the residential
property returns outperformed other traditional modes of investment. It gave an average
annual return of 8.0% which is way more than the returns generated by Australian stocks and
bonds. In comparison to this, the stock generated returns of 5.5% and bonds offered 6.2%
average returns. So, it can be said that making investment in residential property is much
better than investing in other assets (Brickx.com. 2017).
Paraphrase This Document
Need a fresh take? Get an instant paraphrase of this document with our AI Paraphraser
Business finance 7
(Source: Brickx.com, 2017)
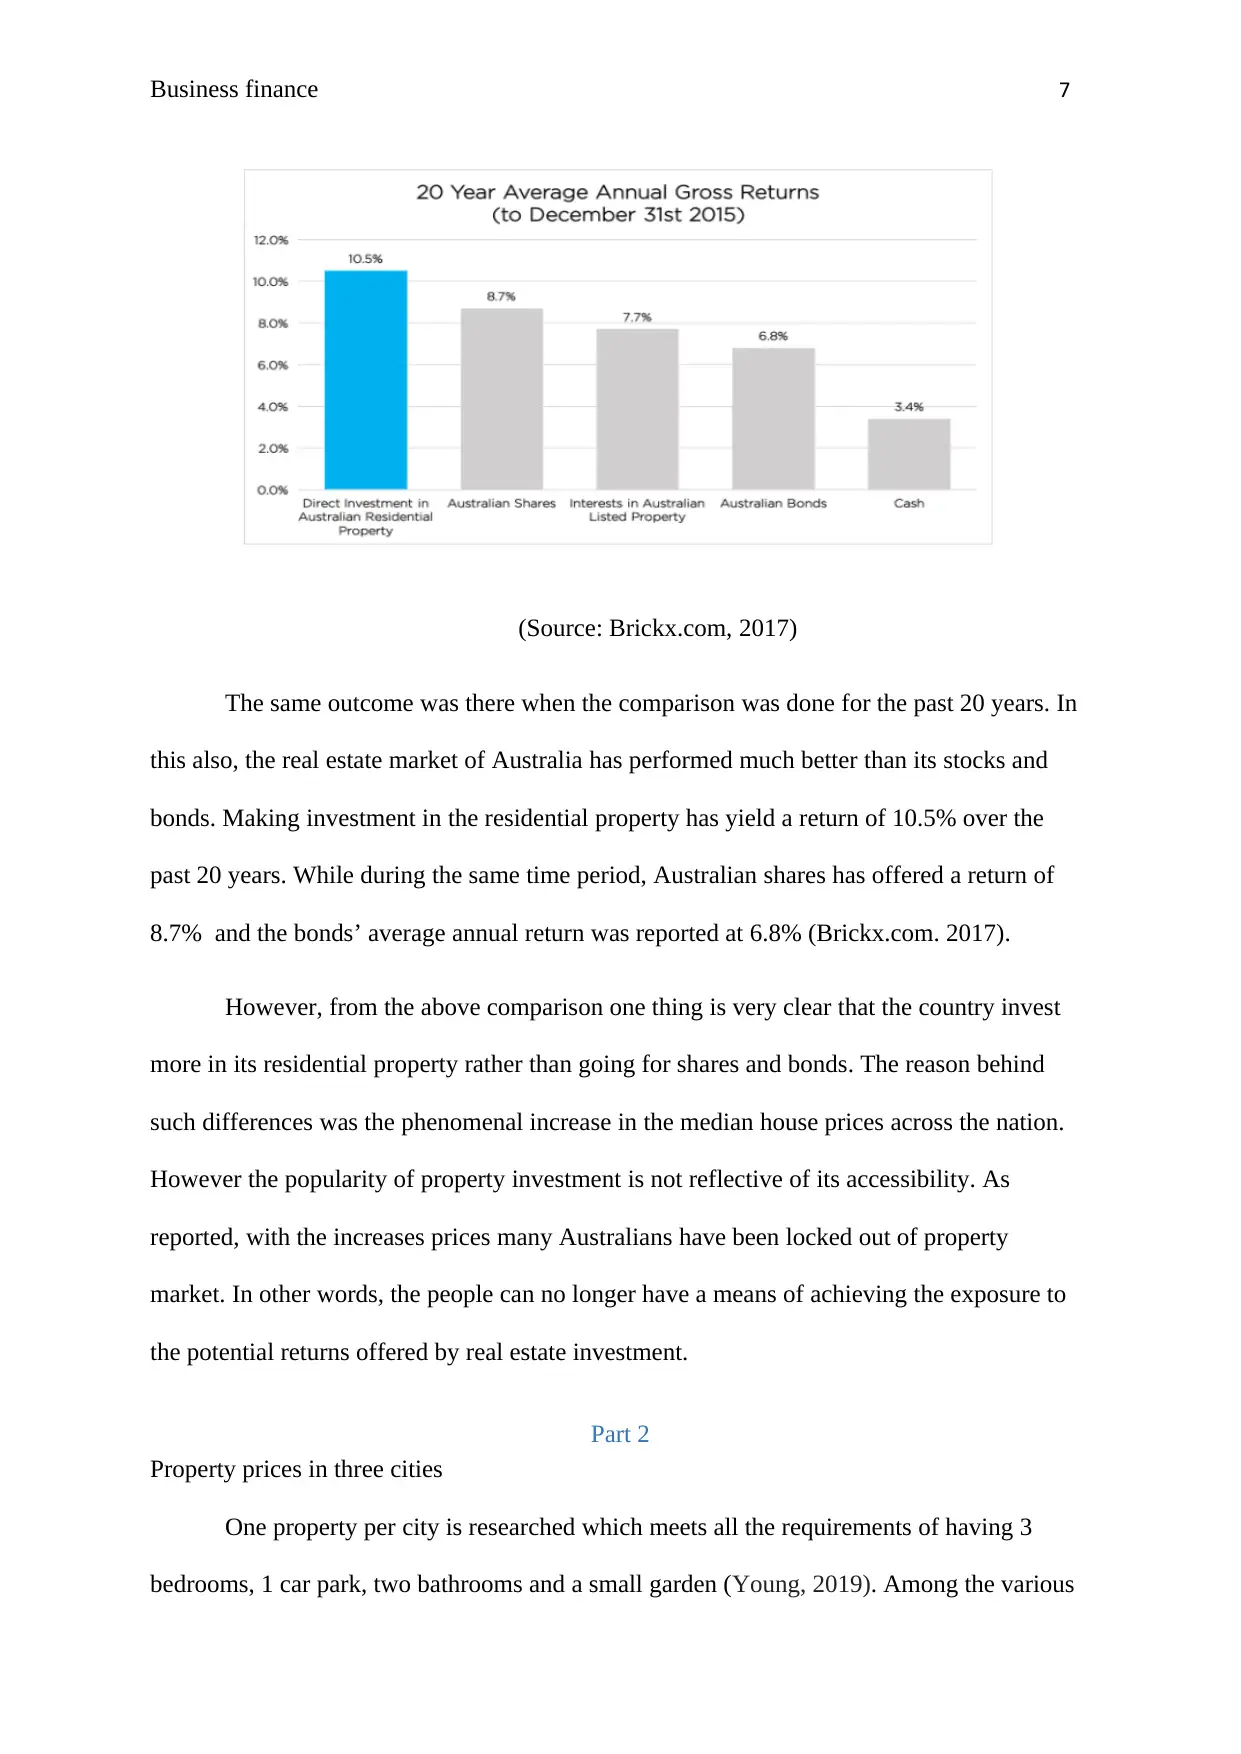
The same outcome was there when the comparison was done for the past 20 years. In
this also, the real estate market of Australia has performed much better than its stocks and
bonds. Making investment in the residential property has yield a return of 10.5% over the
past 20 years. While during the same time period, Australian shares has offered a return of
8.7% and the bonds’ average annual return was reported at 6.8% (Brickx.com. 2017).
However, from the above comparison one thing is very clear that the country invest
more in its residential property rather than going for shares and bonds. The reason behind
such differences was the phenomenal increase in the median house prices across the nation.
However the popularity of property investment is not reflective of its accessibility. As
reported, with the increases prices many Australians have been locked out of property
market. In other words, the people can no longer have a means of achieving the exposure to
the potential returns offered by real estate investment.
Part 2
Property prices in three cities
One property per city is researched which meets all the requirements of having 3
bedrooms, 1 car park, two bathrooms and a small garden (Young, 2019). Among the various
(Source: Brickx.com, 2017)
The same outcome was there when the comparison was done for the past 20 years. In
this also, the real estate market of Australia has performed much better than its stocks and
bonds. Making investment in the residential property has yield a return of 10.5% over the
past 20 years. While during the same time period, Australian shares has offered a return of
8.7% and the bonds’ average annual return was reported at 6.8% (Brickx.com. 2017).
However, from the above comparison one thing is very clear that the country invest
more in its residential property rather than going for shares and bonds. The reason behind
such differences was the phenomenal increase in the median house prices across the nation.
However the popularity of property investment is not reflective of its accessibility. As
reported, with the increases prices many Australians have been locked out of property
market. In other words, the people can no longer have a means of achieving the exposure to
the potential returns offered by real estate investment.
Part 2
Property prices in three cities
One property per city is researched which meets all the requirements of having 3
bedrooms, 1 car park, two bathrooms and a small garden (Young, 2019). Among the various
Business finance 8
properties available in Australia’s capital cities, following are been chosen from Sydney,
Hobart and Newcastle
Cities House Property
Sydney 15 Kale Road, Spring Farm, NSW 2570
Hobart 5 Gardenia Grove, Sandy Bay, TAS 7005
Newcastle Kirkwood Place, Gosforth, Newcastle upon Tyne
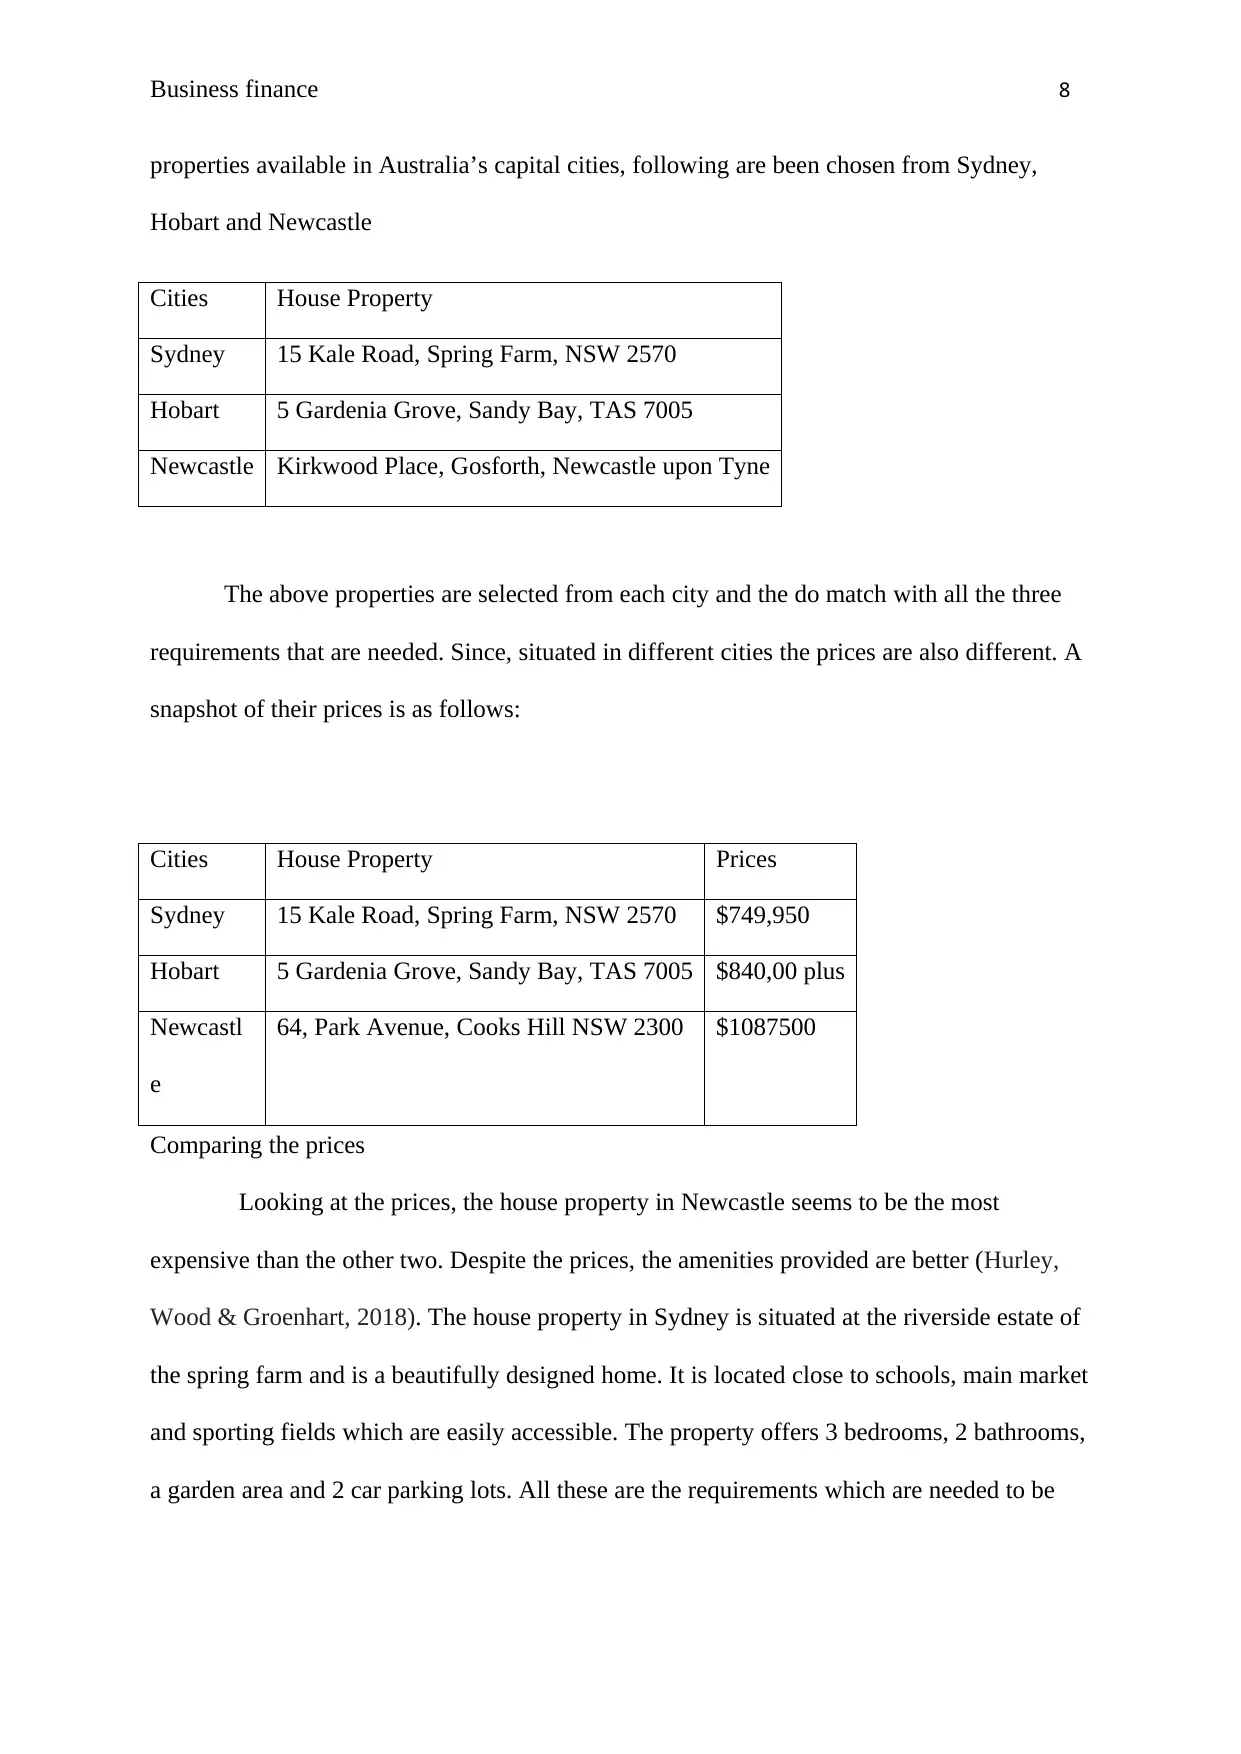
The above properties are selected from each city and the do match with all the three
requirements that are needed. Since, situated in different cities the prices are also different. A
snapshot of their prices is as follows:
Cities House Property Prices
Sydney 15 Kale Road, Spring Farm, NSW 2570 $749,950
Hobart 5 Gardenia Grove, Sandy Bay, TAS 7005 $840,00 plus
Newcastl
e
64, Park Avenue, Cooks Hill NSW 2300 $1087500
Comparing the prices
Looking at the prices, the house property in Newcastle seems to be the most
expensive than the other two. Despite the prices, the amenities provided are better (Hurley,
Wood & Groenhart, 2018). The house property in Sydney is situated at the riverside estate of
the spring farm and is a beautifully designed home. It is located close to schools, main market
and sporting fields which are easily accessible. The property offers 3 bedrooms, 2 bathrooms,
a garden area and 2 car parking lots. All these are the requirements which are needed to be
properties available in Australia’s capital cities, following are been chosen from Sydney,
Hobart and Newcastle
Cities House Property
Sydney 15 Kale Road, Spring Farm, NSW 2570
Hobart 5 Gardenia Grove, Sandy Bay, TAS 7005
Newcastle Kirkwood Place, Gosforth, Newcastle upon Tyne
The above properties are selected from each city and the do match with all the three
requirements that are needed. Since, situated in different cities the prices are also different. A
snapshot of their prices is as follows:
Cities House Property Prices
Sydney 15 Kale Road, Spring Farm, NSW 2570 $749,950
Hobart 5 Gardenia Grove, Sandy Bay, TAS 7005 $840,00 plus
Newcastl
e
64, Park Avenue, Cooks Hill NSW 2300 $1087500
Comparing the prices
Looking at the prices, the house property in Newcastle seems to be the most
expensive than the other two. Despite the prices, the amenities provided are better (Hurley,
Wood & Groenhart, 2018). The house property in Sydney is situated at the riverside estate of
the spring farm and is a beautifully designed home. It is located close to schools, main market
and sporting fields which are easily accessible. The property offers 3 bedrooms, 2 bathrooms,
a garden area and 2 car parking lots. All these are the requirements which are needed to be
⊘ This is a preview!⊘
Do you want full access?
Subscribe today to unlock all pages.
Trusted by 1+ million students worldwide
Business finance 9
fulfilled. The land area is 390sqm. The house is stylish and gives a perfect view of riverside
(Realestateview.com. 2018).
On the other hand, the property located in Hobart is situated in a quiet street which is
surrounded by other quality homes. It gives a view of River Derwent, have high end fixtures
and fittings and provides a comfortable living. It has 3 bedrooms, 2 modern style bathrooms
and 2 car parking. Along with this the house is surrounded by many bushes providing a
garden area also. With the land area of 860sqm, it perfectly fits with the requirements.
However, the prices are too high to afford (Realestateview.com. 2018).
The house in Newcastle is available at very high price worth $1,087500 and also
fulfils all the requirements. It is located in the area which covers the local shops, cafes, close
to transport facilities and fireplaces. (Li, Bao, Sellis, Yan & Zhang, 2018). The house is six
bedroom semi-detached bungalow which offer beautiful private gardens, 3 garage spaces, a
balcony, and I ground swimming pool and secure parking facility. A bungalow style house
offers great facilities apart from the mentioned above include alarm and floorboards
(Onthemarket.com. 2018).
Income level of an architect
Architects are been known for designing and creating new houses and building. In
different cities of world they are been paid differently (Akimov & Stevenson, 2017). Talking
about Sydney, the average income of a design architect is $62,457 per year. The skills which
make a person to get highly paid for his profile are Arch CAD, GRAPHISOFT, Project
management and many more. While, in Hobart architects are paid $92,939 per year. This is
almost 1.6 times more than the median wage of the country. However, the tax charges on
income level amounted to $23,878.07 which makes the net income of $69,060.57. In
Paraphrase This Document
Need a fresh take? Get an instant paraphrase of this document with our AI Paraphraser
Business finance 10
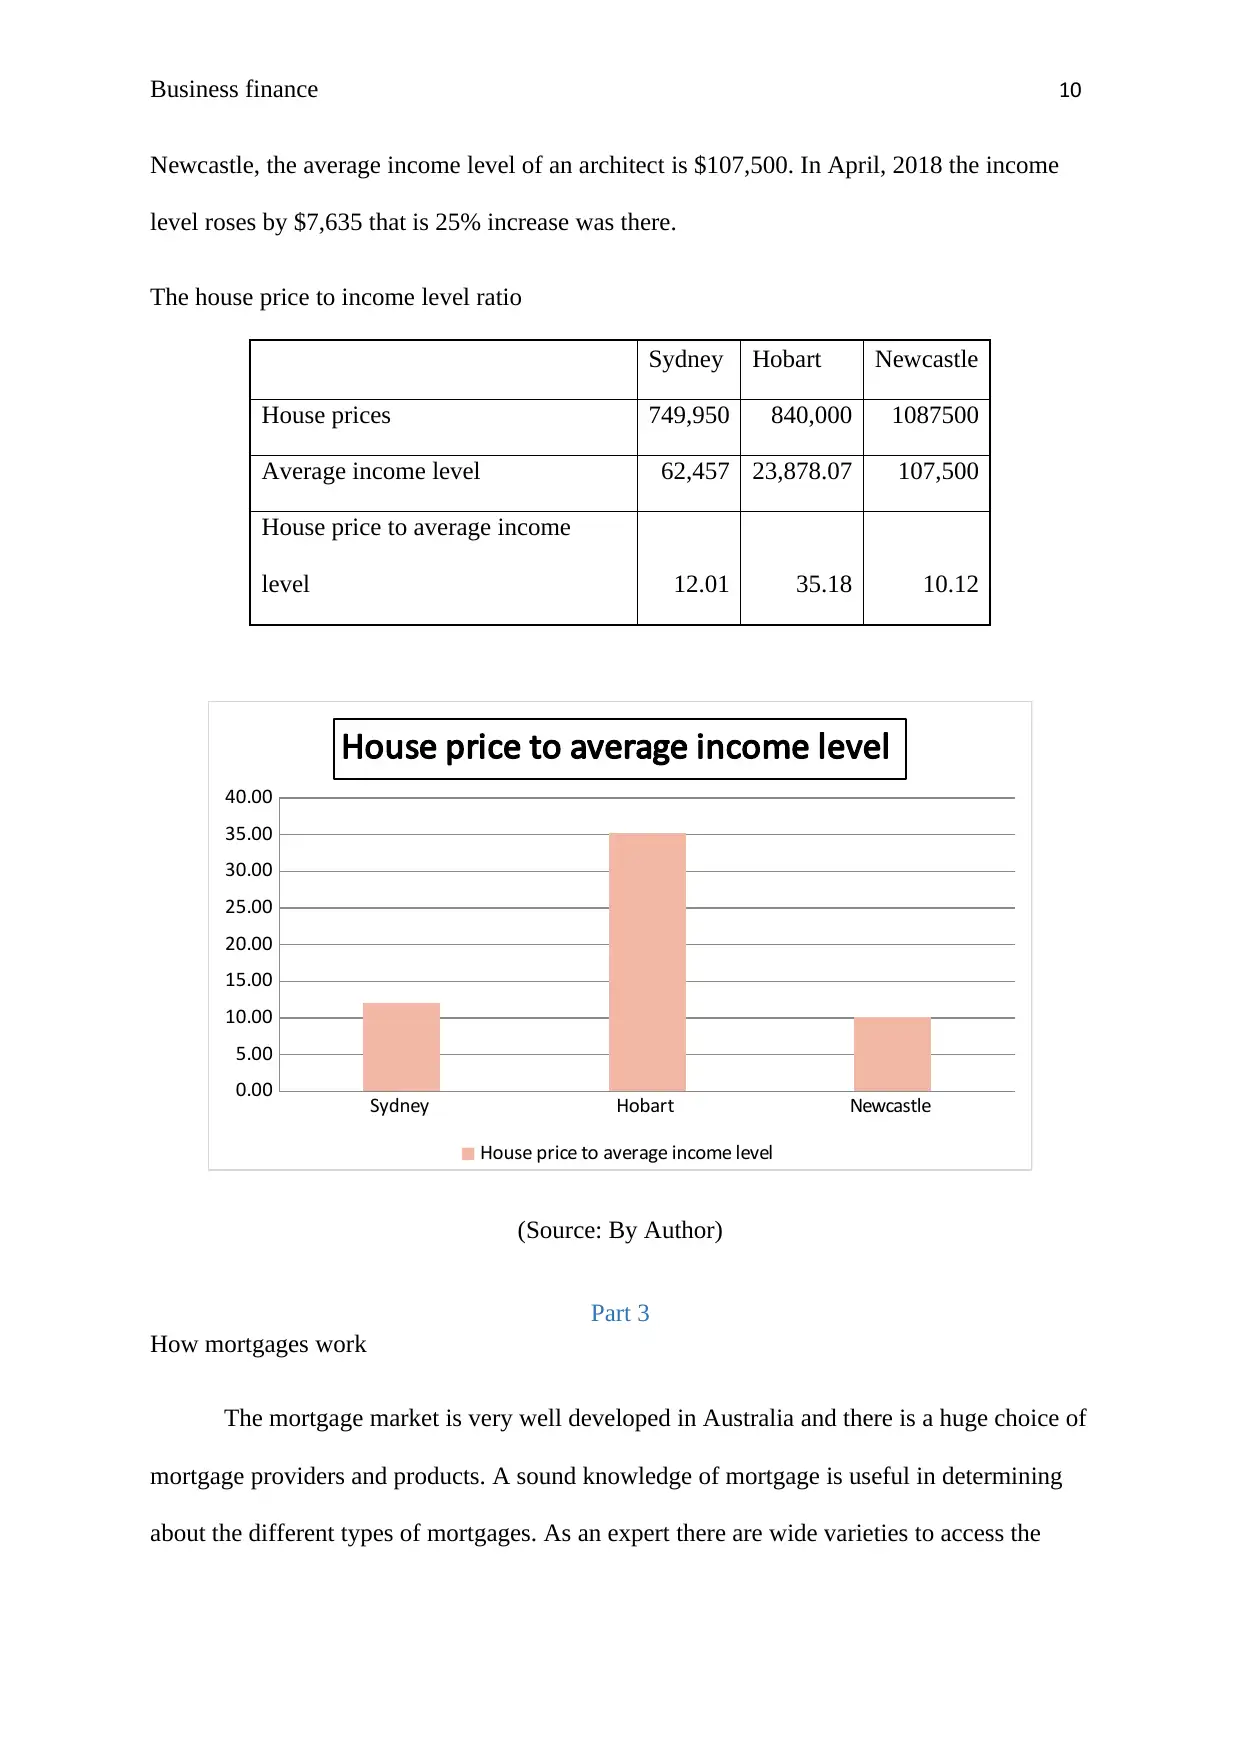
Newcastle, the average income level of an architect is $107,500. In April, 2018 the income
level roses by $7,635 that is 25% increase was there.
The house price to income level ratio
Sydney Hobart Newcastle
House prices 749,950 840,000 1087500
Average income level 62,457 23,878.07 107,500
House price to average income
level 12.01 35.18 10.12
Sydney Hobart Newcastle
0.00
5.00
10.00
15.00
20.00
25.00
30.00
35.00
40.00
House price to average income level
House price to average income level
(Source: By Author)
Part 3
How mortgages work
The mortgage market is very well developed in Australia and there is a huge choice of
mortgage providers and products. A sound knowledge of mortgage is useful in determining
about the different types of mortgages. As an expert there are wide varieties to access the
Business finance 11
options. The first decision shall be the decision about the rates whether the selection shall be
the variable and fixed rate. Fixed rate mortgages are associated with the same interest rate
will be applicable for the duration of the agreement (Blöchliger, Égert, Alvarez & Paciorek,
2015). They are applicable usually for few years. Variable rate mortgages however can
fluctuate according to the variability of cost. They typically track the standard variable rate
which is decided by the bank, or the central bank rates. Another option for the first buyers
can be is the hybrid options which contain the discounted variable rate, before moving on to
the bank’s standard variable rate. This is sold as a honeymoon offer, especially for new
customers but might end up costing more than what is expected as the standard variable rate
is not necessary the best reliable rate available for the customers.
There are also certain types of products which are available only to the buyers in
specific situations (Wilson, 2015). This is also known as the professional package under
which the services are revolving around the concept of the home loans which is made
available to the professional buyers which are made variable for professional buyers.
Applying for home loans requires some conditions which are discussed as follows.
The personal information includes the fulltime employment history, current and
previous addresses, details of the current assets are required to put up collateral security such
as car, bike or other properties and most importantly the proof of your income and current
outgoing expenses (Robertson & Rogers, 2017).
Current records of the salary, latest return of the tax and notices if nay for the purpose
of assessment, copies of the recent credit card statements are required which confirms the
credit limits. The last six months bank statements. Also the stamp duty and lender’s mortgage
insurance is reviewed.
⊘ This is a preview!⊘
Do you want full access?
Subscribe today to unlock all pages.
Trusted by 1+ million students worldwide
1 out of 21
Related Documents


Your All-in-One AI-Powered Toolkit for Academic Success.
+13062052269
info@desklib.com
Available 24*7 on WhatsApp / Email
![[object Object]](/_next/static/media/star-bottom.7253800d.svg)
Unlock your academic potential
Copyright © 2020–2026 A2Z Services. All Rights Reserved. Developed and managed by ZUCOL.