MA514 Business Finance: Home Loan and Affordability Plan for a Client
VerifiedAdded on 2023/06/11
|13
|2507
|292
Report
AI Summary
This report provides a detailed financial plan for a client seeking to purchase a home in Sydney. It calculates historical housing prices and income growth rates, determines tax liabilities and net income, and estimates the maximum loan amount the client can borrow. The report assesses mortgage options with and without premium, presents financial plans with 5% and 20% upfront payments, and analyzes the impact of interest rate changes on mortgage payments. It also identifies potential risks associated with the proposed financial plan, offering a comprehensive overview of the client's financial situation and homeownership prospects. Desklib offers a variety of solved assignments and past papers to aid students in their academic pursuits.
Running head: BUSINESS FINANCE
Business Finance
Name of the Student:
Name of the University:
Authors Note:
Business Finance
Name of the Student:
Name of the University:
Authors Note:
Paraphrase This Document
Need a fresh take? Get an instant paraphrase of this document with our AI Paraphraser
BUSINESS FINANCE
1
Table of Contents
1. Calculating the historical housing price of Sydney, while justifying the future prices used
for the assumptions:...................................................................................................................2
2. Calculating the historical income of citizens living in Sydney and deriving ht growth rate:
....................................................................................................................................................3
3. Calculating tax, net income, and maximum amount the client could borrow for a home
loan:............................................................................................................................................5
4. Detecting the value of mortgage that will be allowed without premium and with premium
to the client:................................................................................................................................6
5. Indicating the financial plan with 5% upfront payment and 20% upfront payment:.............7
6. Indicating whether any changes in interest rate would affect mortgage payment of the
client:..........................................................................................................................................9
7. Depicting the risk involved in the plan drafted for the client:...............................................9
Reference and Bibliography:....................................................................................................11
BUSINESS FINANCE
2
1. Calculating the historical housing price of Sydney, while justifying the future prices
used for the assumptions:
Q1
Q2
Q3
Q4
Q1
Q2
Q3
Q4
Q1
Q2
Q3
Q4
Q1
Q2
Q3
Q4
Q1
Q2
Q3
Q4
Q1
Q2
Q3
Q4
Q1
Q2
Q3
Q4
Q1
Q2
Q3
Q4
Q1
Q2
Q3
Q4
Q1
Q2
Q3
Q4
Q1
Q2
Q3
Q4
Q1
Q2
Q3
Q4
Q1
Q2
Q3
Q4
Q1
Q2
Q3
Q4
Q1
Q2
Q3
Q4
Q1
Q2
Q3
Q4
Q1
Q2
Q3
Q4
Q1
Q2
Q3
Q4
Q1
Q2
Q3
Q4
Q1
Q2
Q3
Q4
0 1 2 3 4 5 6 7 8 0 10 11 12 13 14 15 16 17 18 19 20
$-
$500.00
$1,000.00
$1,500.00
$2,000.00
$2,500.00
$3,000.00
$3,500.00
$4,000.00
$1,020.00 $3,664.33
Housing Price of Sydney ("000)
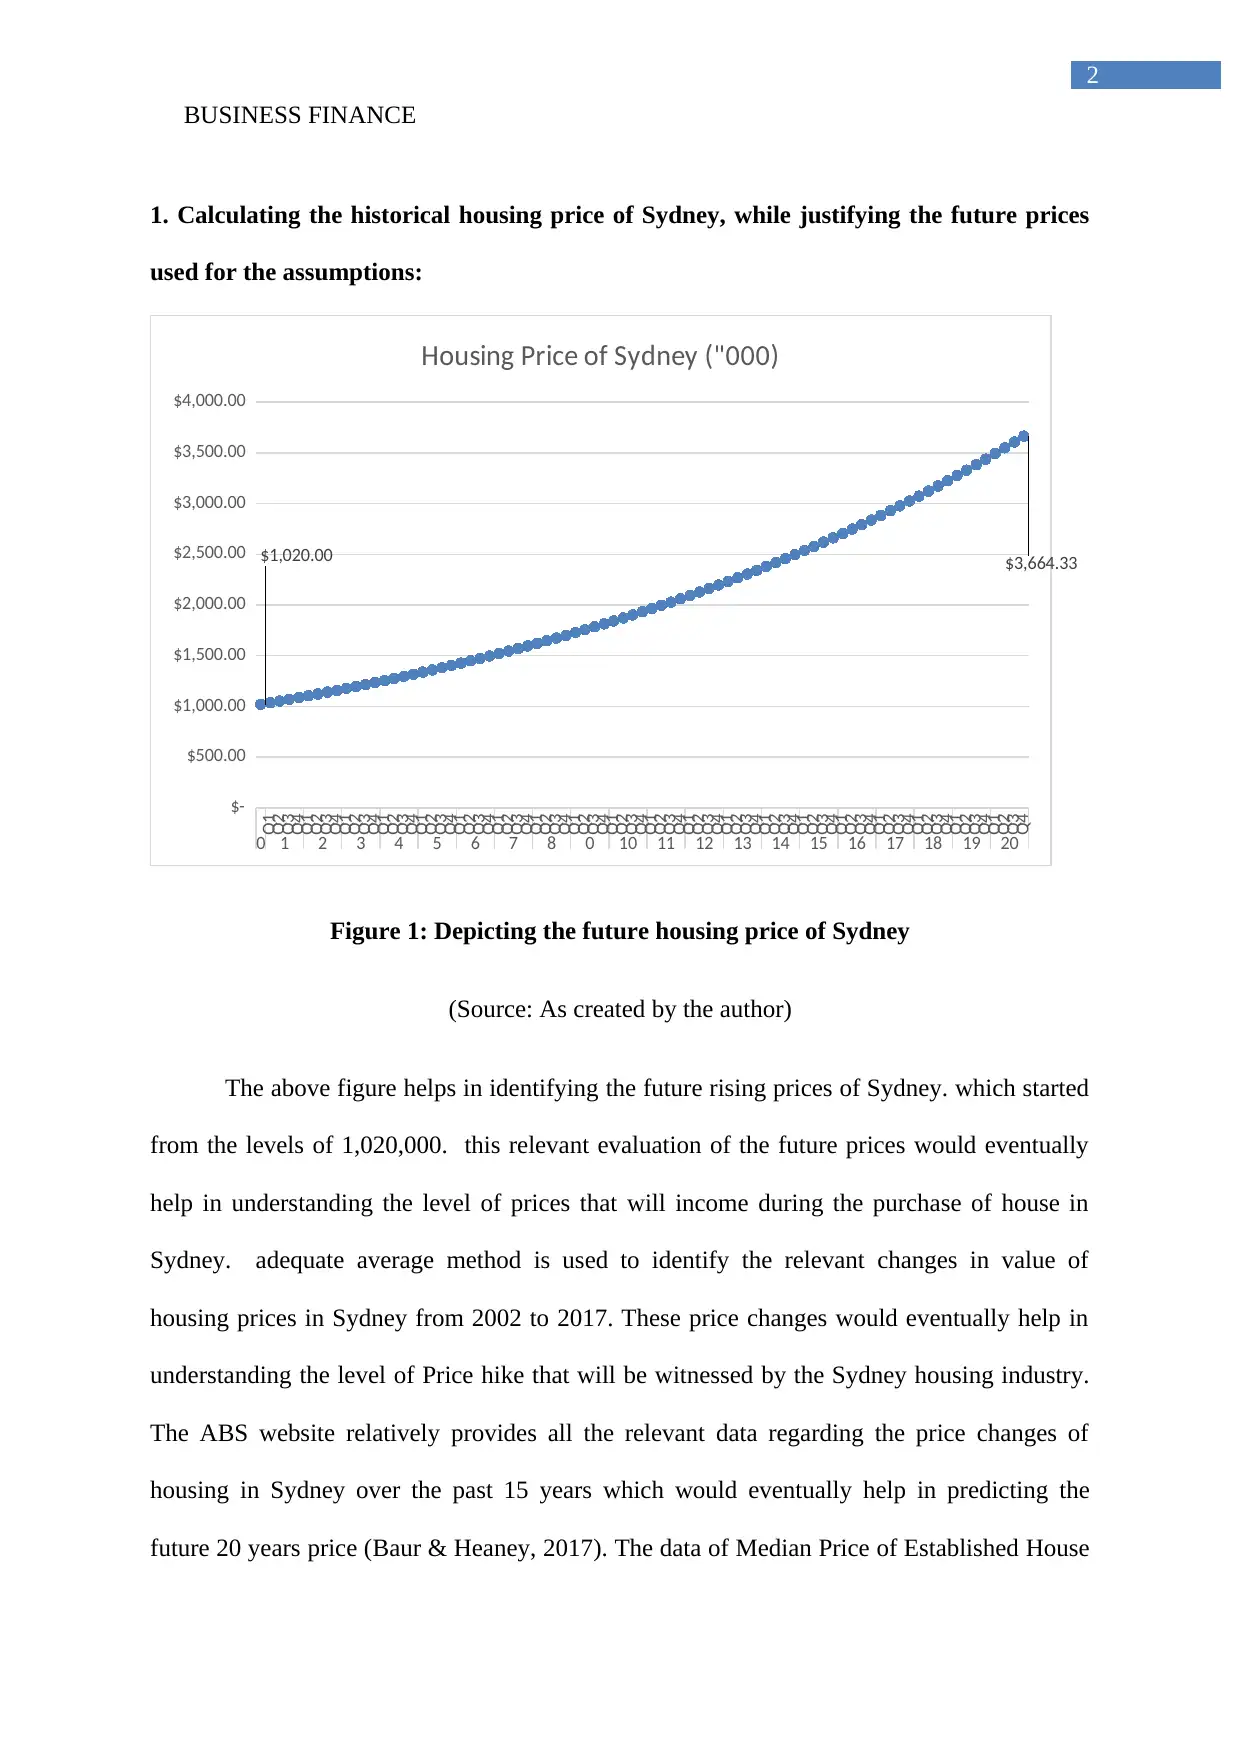
Figure 1: Depicting the future housing price of Sydney
(Source: As created by the author)
The above figure helps in identifying the future rising prices of Sydney. which started
from the levels of 1,020,000. this relevant evaluation of the future prices would eventually
help in understanding the level of prices that will income during the purchase of house in
Sydney. adequate average method is used to identify the relevant changes in value of
housing prices in Sydney from 2002 to 2017. These price changes would eventually help in
understanding the level of Price hike that will be witnessed by the Sydney housing industry.
The ABS website relatively provides all the relevant data regarding the price changes of
housing in Sydney over the past 15 years which would eventually help in predicting the
future 20 years price (Baur & Heaney, 2017). The data of Median Price of Established House
2
1. Calculating the historical housing price of Sydney, while justifying the future prices
used for the assumptions:
Q1
Q2
Q3
Q4
Q1
Q2
Q3
Q4
Q1
Q2
Q3
Q4
Q1
Q2
Q3
Q4
Q1
Q2
Q3
Q4
Q1
Q2
Q3
Q4
Q1
Q2
Q3
Q4
Q1
Q2
Q3
Q4
Q1
Q2
Q3
Q4
Q1
Q2
Q3
Q4
Q1
Q2
Q3
Q4
Q1
Q2
Q3
Q4
Q1
Q2
Q3
Q4
Q1
Q2
Q3
Q4
Q1
Q2
Q3
Q4
Q1
Q2
Q3
Q4
Q1
Q2
Q3
Q4
Q1
Q2
Q3
Q4
Q1
Q2
Q3
Q4
Q1
Q2
Q3
Q4
0 1 2 3 4 5 6 7 8 0 10 11 12 13 14 15 16 17 18 19 20
$-
$500.00
$1,000.00
$1,500.00
$2,000.00
$2,500.00
$3,000.00
$3,500.00
$4,000.00
$1,020.00 $3,664.33
Housing Price of Sydney ("000)
Figure 1: Depicting the future housing price of Sydney
(Source: As created by the author)
The above figure helps in identifying the future rising prices of Sydney. which started
from the levels of 1,020,000. this relevant evaluation of the future prices would eventually
help in understanding the level of prices that will income during the purchase of house in
Sydney. adequate average method is used to identify the relevant changes in value of
housing prices in Sydney from 2002 to 2017. These price changes would eventually help in
understanding the level of Price hike that will be witnessed by the Sydney housing industry.
The ABS website relatively provides all the relevant data regarding the price changes of
housing in Sydney over the past 15 years which would eventually help in predicting the
future 20 years price (Baur & Heaney, 2017). The data of Median Price of Established House
⊘ This is a preview!⊘
Do you want full access?
Subscribe today to unlock all pages.
Trusted by 1+ million students worldwide
BUSINESS FINANCE
3
Transfers (Unstratified) Sydney and Median Price of Attached Dwelling Transfers
(Unstratified) Sydney is used for the calculation purposes.
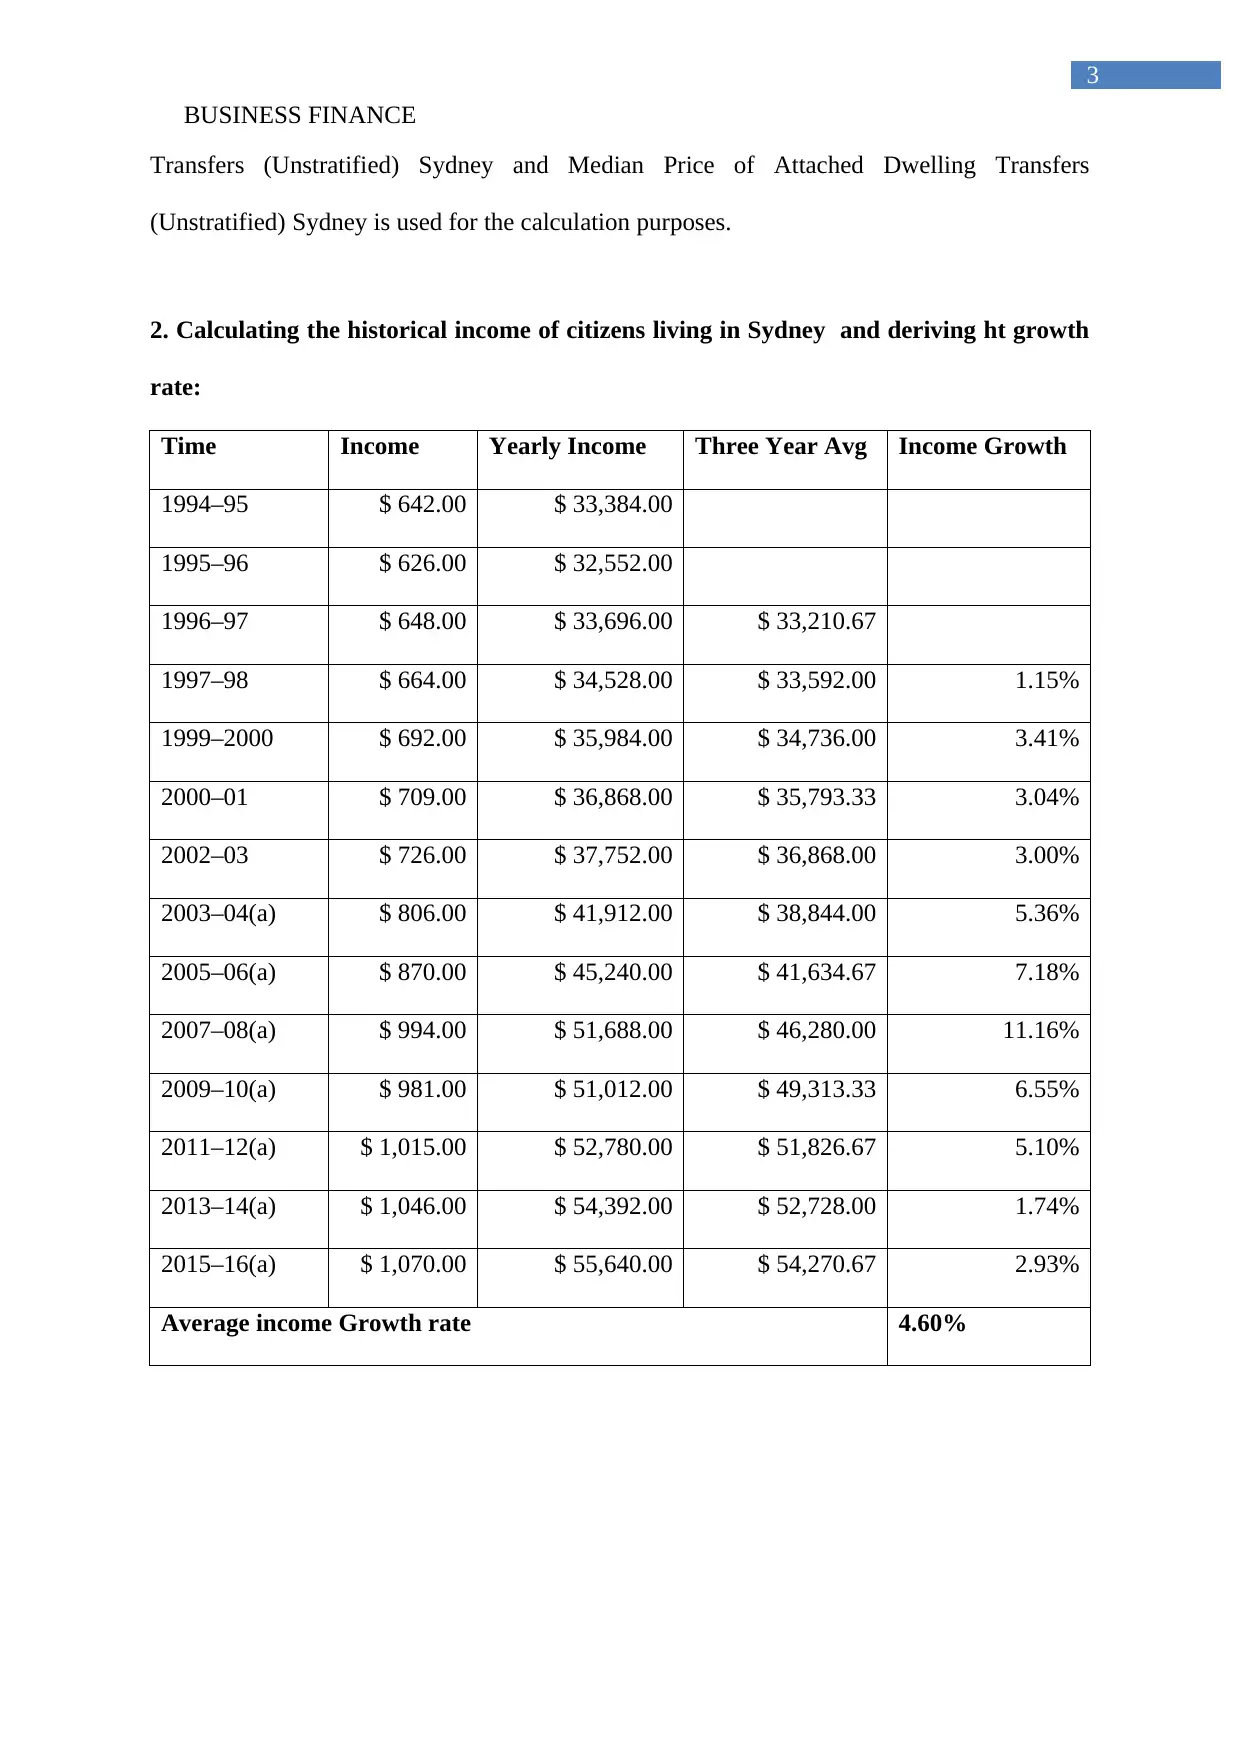
2. Calculating the historical income of citizens living in Sydney and deriving ht growth
rate:
Time Income Yearly Income Three Year Avg Income Growth
1994–95 $ 642.00 $ 33,384.00
1995–96 $ 626.00 $ 32,552.00
1996–97 $ 648.00 $ 33,696.00 $ 33,210.67
1997–98 $ 664.00 $ 34,528.00 $ 33,592.00 1.15%
1999–2000 $ 692.00 $ 35,984.00 $ 34,736.00 3.41%
2000–01 $ 709.00 $ 36,868.00 $ 35,793.33 3.04%
2002–03 $ 726.00 $ 37,752.00 $ 36,868.00 3.00%
2003–04(a) $ 806.00 $ 41,912.00 $ 38,844.00 5.36%
2005–06(a) $ 870.00 $ 45,240.00 $ 41,634.67 7.18%
2007–08(a) $ 994.00 $ 51,688.00 $ 46,280.00 11.16%
2009–10(a) $ 981.00 $ 51,012.00 $ 49,313.33 6.55%
2011–12(a) $ 1,015.00 $ 52,780.00 $ 51,826.67 5.10%
2013–14(a) $ 1,046.00 $ 54,392.00 $ 52,728.00 1.74%
2015–16(a) $ 1,070.00 $ 55,640.00 $ 54,270.67 2.93%
Average income Growth rate 4.60%
3
Transfers (Unstratified) Sydney and Median Price of Attached Dwelling Transfers
(Unstratified) Sydney is used for the calculation purposes.
2. Calculating the historical income of citizens living in Sydney and deriving ht growth
rate:
Time Income Yearly Income Three Year Avg Income Growth
1994–95 $ 642.00 $ 33,384.00
1995–96 $ 626.00 $ 32,552.00
1996–97 $ 648.00 $ 33,696.00 $ 33,210.67
1997–98 $ 664.00 $ 34,528.00 $ 33,592.00 1.15%
1999–2000 $ 692.00 $ 35,984.00 $ 34,736.00 3.41%
2000–01 $ 709.00 $ 36,868.00 $ 35,793.33 3.04%
2002–03 $ 726.00 $ 37,752.00 $ 36,868.00 3.00%
2003–04(a) $ 806.00 $ 41,912.00 $ 38,844.00 5.36%
2005–06(a) $ 870.00 $ 45,240.00 $ 41,634.67 7.18%
2007–08(a) $ 994.00 $ 51,688.00 $ 46,280.00 11.16%
2009–10(a) $ 981.00 $ 51,012.00 $ 49,313.33 6.55%
2011–12(a) $ 1,015.00 $ 52,780.00 $ 51,826.67 5.10%
2013–14(a) $ 1,046.00 $ 54,392.00 $ 52,728.00 1.74%
2015–16(a) $ 1,070.00 $ 55,640.00 $ 54,270.67 2.93%
Average income Growth rate 4.60%
Paraphrase This Document
Need a fresh take? Get an instant paraphrase of this document with our AI Paraphraser
BUSINESS FINANCE
4
0 1 2 3 4 5 6 7 8 9 1 0
$-
$20,000.00
$40,000.00
$60,000.00
$80,000.00
$100,000.00
$120,000.00
$140,000.00
$80,000.00
$125,450.38
Growth rate In 10 years
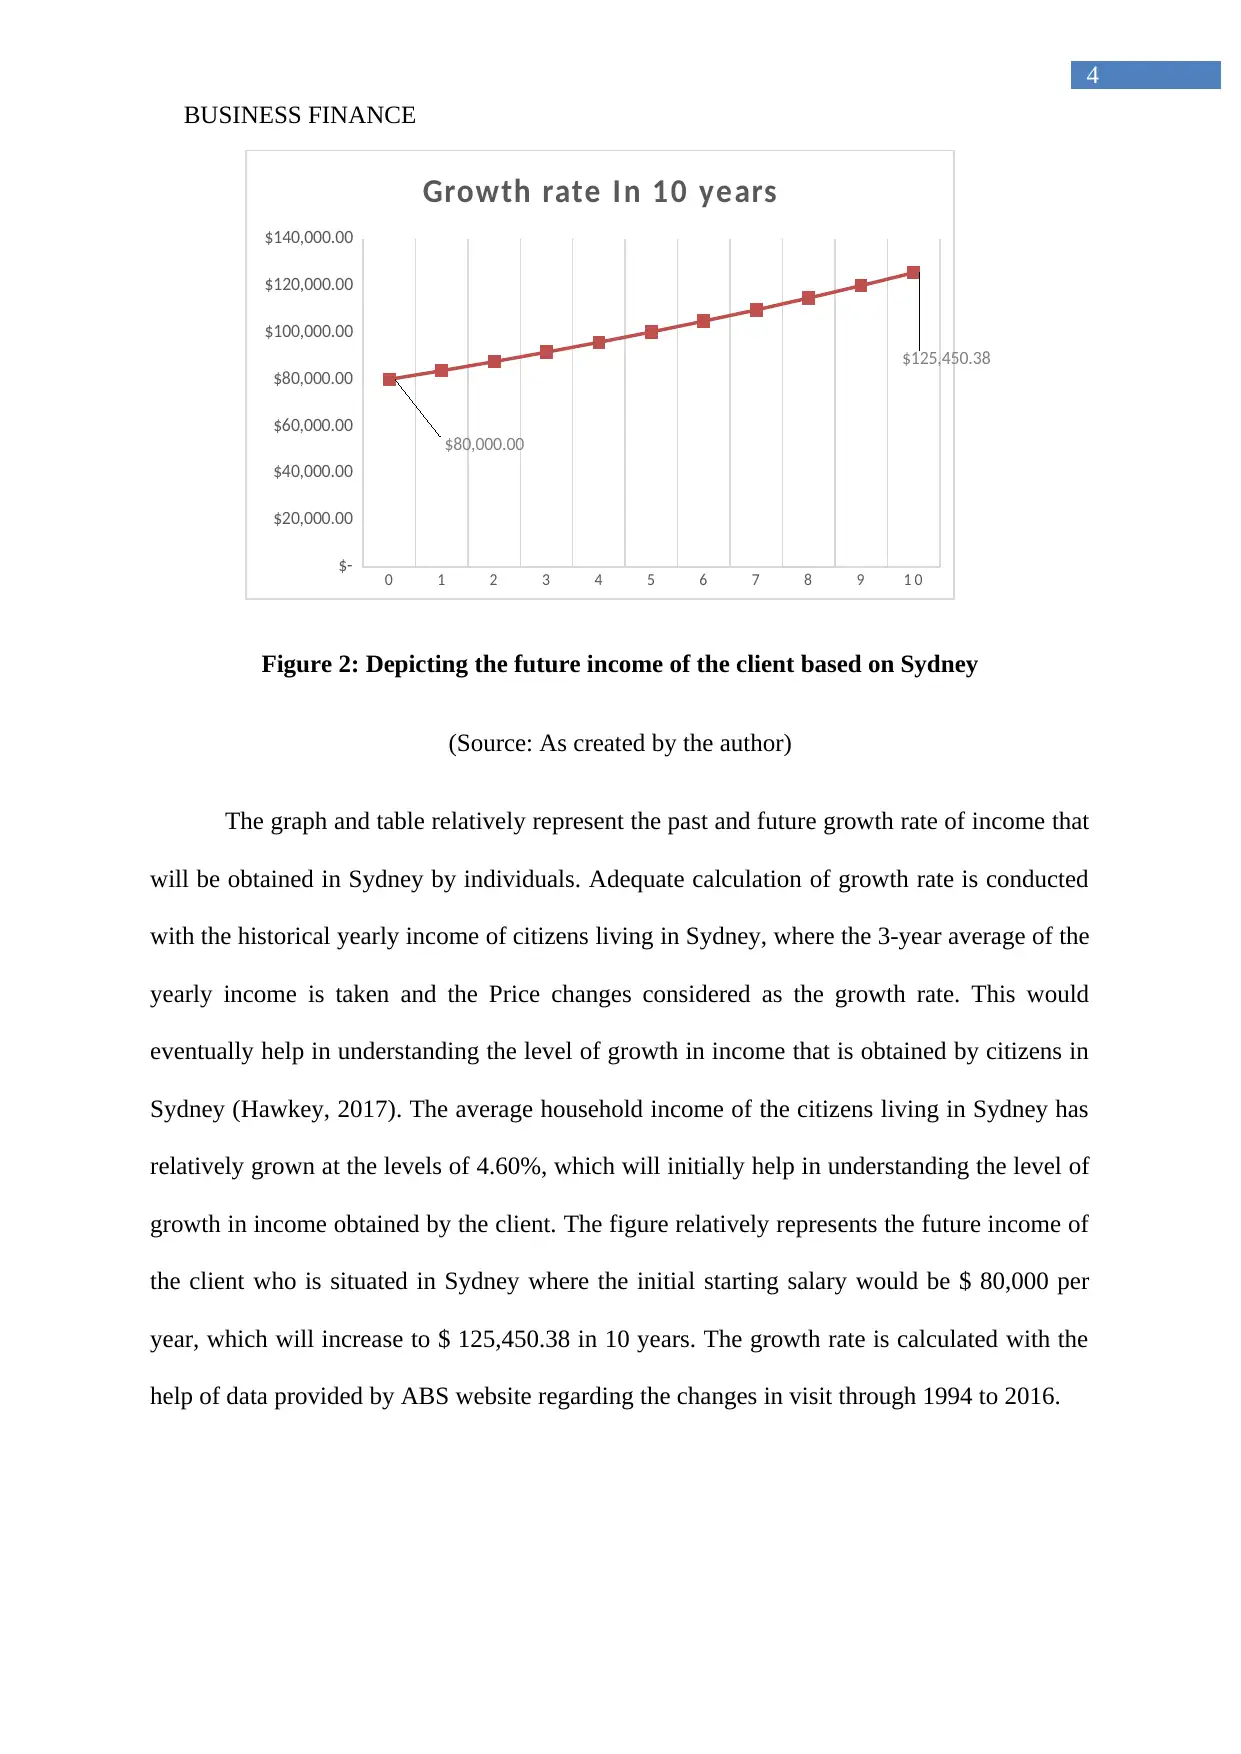
Figure 2: Depicting the future income of the client based on Sydney
(Source: As created by the author)
The graph and table relatively represent the past and future growth rate of income that
will be obtained in Sydney by individuals. Adequate calculation of growth rate is conducted
with the historical yearly income of citizens living in Sydney, where the 3-year average of the
yearly income is taken and the Price changes considered as the growth rate. This would
eventually help in understanding the level of growth in income that is obtained by citizens in
Sydney (Hawkey, 2017). The average household income of the citizens living in Sydney has
relatively grown at the levels of 4.60%, which will initially help in understanding the level of
growth in income obtained by the client. The figure relatively represents the future income of
the client who is situated in Sydney where the initial starting salary would be $ 80,000 per
year, which will increase to $ 125,450.38 in 10 years. The growth rate is calculated with the
help of data provided by ABS website regarding the changes in visit through 1994 to 2016.
4
0 1 2 3 4 5 6 7 8 9 1 0
$-
$20,000.00
$40,000.00
$60,000.00
$80,000.00
$100,000.00
$120,000.00
$140,000.00
$80,000.00
$125,450.38
Growth rate In 10 years
Figure 2: Depicting the future income of the client based on Sydney
(Source: As created by the author)
The graph and table relatively represent the past and future growth rate of income that
will be obtained in Sydney by individuals. Adequate calculation of growth rate is conducted
with the historical yearly income of citizens living in Sydney, where the 3-year average of the
yearly income is taken and the Price changes considered as the growth rate. This would
eventually help in understanding the level of growth in income that is obtained by citizens in
Sydney (Hawkey, 2017). The average household income of the citizens living in Sydney has
relatively grown at the levels of 4.60%, which will initially help in understanding the level of
growth in income obtained by the client. The figure relatively represents the future income of
the client who is situated in Sydney where the initial starting salary would be $ 80,000 per
year, which will increase to $ 125,450.38 in 10 years. The growth rate is calculated with the
help of data provided by ABS website regarding the changes in visit through 1994 to 2016.
BUSINESS FINANCE
5
3. Calculating tax, net income, and maximum amount the client could borrow for a
home loan:
Particulars Monthly Yearly
Annual Salary $ 6,666.67 $ 80,000.00
Yearly expense
Amenities $ 1,450.00 $ 17,400.00
Rent $ 1,100.00 $ 13,200.00
Expense of living $ 2,550.00 $ 30,600.00
Tax $ 17,547.00
Savings $ 2,654.42 $ 31,853.00
Particulars Values
Interest rate 3.69%
Years 30
Max LVR 80%
Price of the property $ 400,000
Borrowed Amount $ 318,147
Deposit for loan $ 81,853
From the calculation of above table, the relevant tax rate and net savings of the client
could be identified. The client would eventually pay tax of $17,547, while the savings will be
at the levels for the year is of $31,853, while the total savings is $81,853. Moreover, from the
valuation conducted on the deposit savings of the client the relevant Property value of $
400,000 can only be purchased due to the max LVR of 80%, which is been provided by the
⊘ This is a preview!⊘
Do you want full access?
Subscribe today to unlock all pages.
Trusted by 1+ million students worldwide
BUSINESS FINANCE
6
bank. Additionally, the interest rates on home loans for citizens in Sydney at the levels of
3.69%.
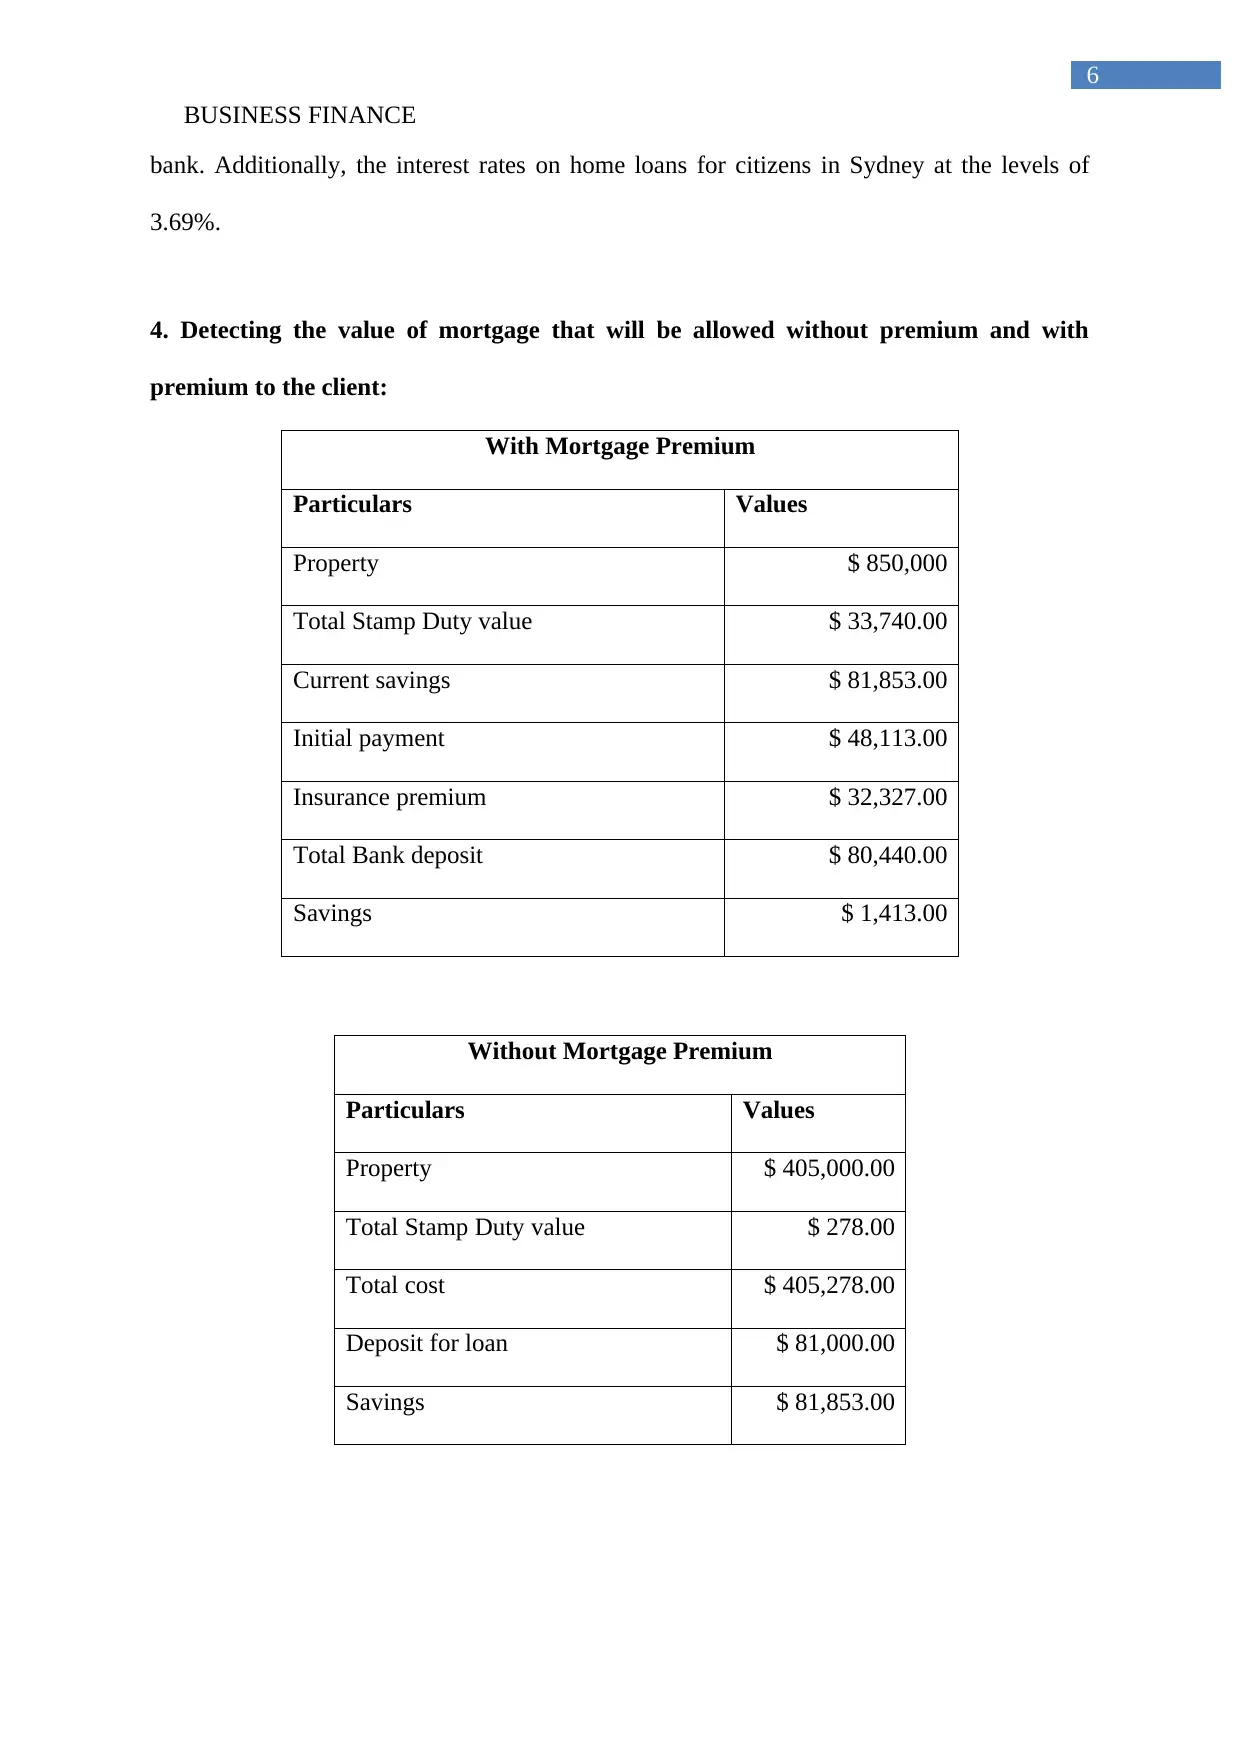
4. Detecting the value of mortgage that will be allowed without premium and with
premium to the client:
With Mortgage Premium
Particulars Values
Property $ 850,000
Total Stamp Duty value $ 33,740.00
Current savings $ 81,853.00
Initial payment $ 48,113.00
Insurance premium $ 32,327.00
Total Bank deposit $ 80,440.00
Savings $ 1,413.00
Without Mortgage Premium
Particulars Values
Property $ 405,000.00
Total Stamp Duty value $ 278.00
Total cost $ 405,278.00
Deposit for loan $ 81,000.00
Savings $ 81,853.00
6
bank. Additionally, the interest rates on home loans for citizens in Sydney at the levels of
3.69%.
4. Detecting the value of mortgage that will be allowed without premium and with
premium to the client:
With Mortgage Premium
Particulars Values
Property $ 850,000
Total Stamp Duty value $ 33,740.00
Current savings $ 81,853.00
Initial payment $ 48,113.00
Insurance premium $ 32,327.00
Total Bank deposit $ 80,440.00
Savings $ 1,413.00
Without Mortgage Premium
Particulars Values
Property $ 405,000.00
Total Stamp Duty value $ 278.00
Total cost $ 405,278.00
Deposit for loan $ 81,000.00
Savings $ 81,853.00
Paraphrase This Document
Need a fresh take? Get an instant paraphrase of this document with our AI Paraphraser
BUSINESS FINANCE
7
The calculation relatively represents the overall property that could be bought by the
client with mortgage premium and without mortgage premium. There is a significant
difference in the property value if mortgage premium is not used by the client during the
purchase of the property. as without the mortgage premium the client needs to pay 20% of
the overall Property value from its savings. However, the client currently has a total savings
of $ 81,853, which will allow him to buy the property with a value of $ 405,000. On the other
hand, if insurance premium is paid by the client then the total Property value will be at the
levels of $ 850,000With the insurance premium of $ 32,327.00. Therefore, the difference
between the property value with and without mortgage premium can be identified, where
with the mortgage premium the client would eventually get a bigger house for herself (De
Visscher, 2016).
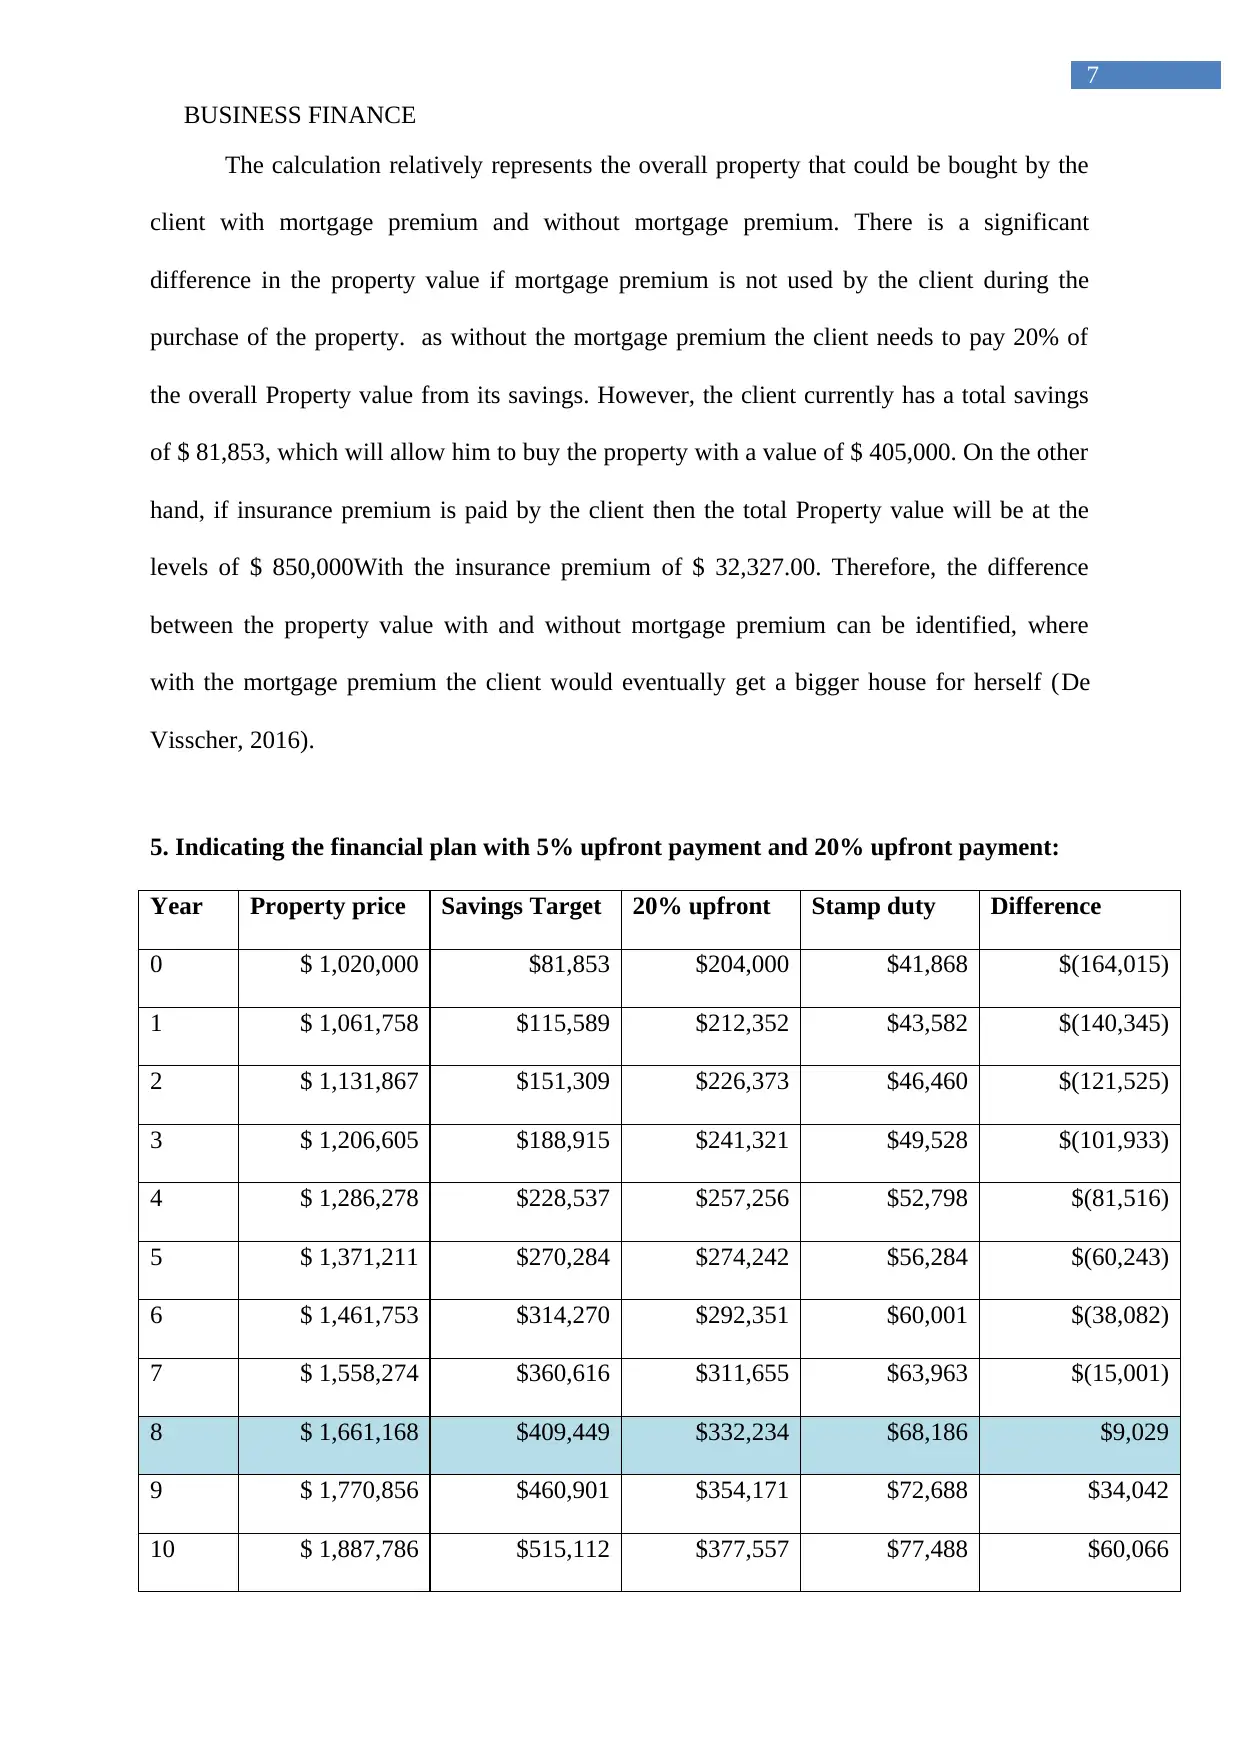
5. Indicating the financial plan with 5% upfront payment and 20% upfront payment:
Year Property price Savings Target 20% upfront Stamp duty Difference
0 $ 1,020,000 $81,853 $204,000 $41,868 $(164,015)
1 $ 1,061,758 $115,589 $212,352 $43,582 $(140,345)
2 $ 1,131,867 $151,309 $226,373 $46,460 $(121,525)
3 $ 1,206,605 $188,915 $241,321 $49,528 $(101,933)
4 $ 1,286,278 $228,537 $257,256 $52,798 $(81,516)
5 $ 1,371,211 $270,284 $274,242 $56,284 $(60,243)
6 $ 1,461,753 $314,270 $292,351 $60,001 $(38,082)
7 $ 1,558,274 $360,616 $311,655 $63,963 $(15,001)
8 $ 1,661,168 $409,449 $332,234 $68,186 $9,029
9 $ 1,770,856 $460,901 $354,171 $72,688 $34,042
10 $ 1,887,786 $515,112 $377,557 $77,488 $60,066
7
The calculation relatively represents the overall property that could be bought by the
client with mortgage premium and without mortgage premium. There is a significant
difference in the property value if mortgage premium is not used by the client during the
purchase of the property. as without the mortgage premium the client needs to pay 20% of
the overall Property value from its savings. However, the client currently has a total savings
of $ 81,853, which will allow him to buy the property with a value of $ 405,000. On the other
hand, if insurance premium is paid by the client then the total Property value will be at the
levels of $ 850,000With the insurance premium of $ 32,327.00. Therefore, the difference
between the property value with and without mortgage premium can be identified, where
with the mortgage premium the client would eventually get a bigger house for herself (De
Visscher, 2016).
5. Indicating the financial plan with 5% upfront payment and 20% upfront payment:
Year Property price Savings Target 20% upfront Stamp duty Difference
0 $ 1,020,000 $81,853 $204,000 $41,868 $(164,015)
1 $ 1,061,758 $115,589 $212,352 $43,582 $(140,345)
2 $ 1,131,867 $151,309 $226,373 $46,460 $(121,525)
3 $ 1,206,605 $188,915 $241,321 $49,528 $(101,933)
4 $ 1,286,278 $228,537 $257,256 $52,798 $(81,516)
5 $ 1,371,211 $270,284 $274,242 $56,284 $(60,243)
6 $ 1,461,753 $314,270 $292,351 $60,001 $(38,082)
7 $ 1,558,274 $360,616 $311,655 $63,963 $(15,001)
8 $ 1,661,168 $409,449 $332,234 $68,186 $9,029
9 $ 1,770,856 $460,901 $354,171 $72,688 $34,042
10 $ 1,887,786 $515,112 $377,557 $77,488 $60,066
BUSINESS FINANCE
8
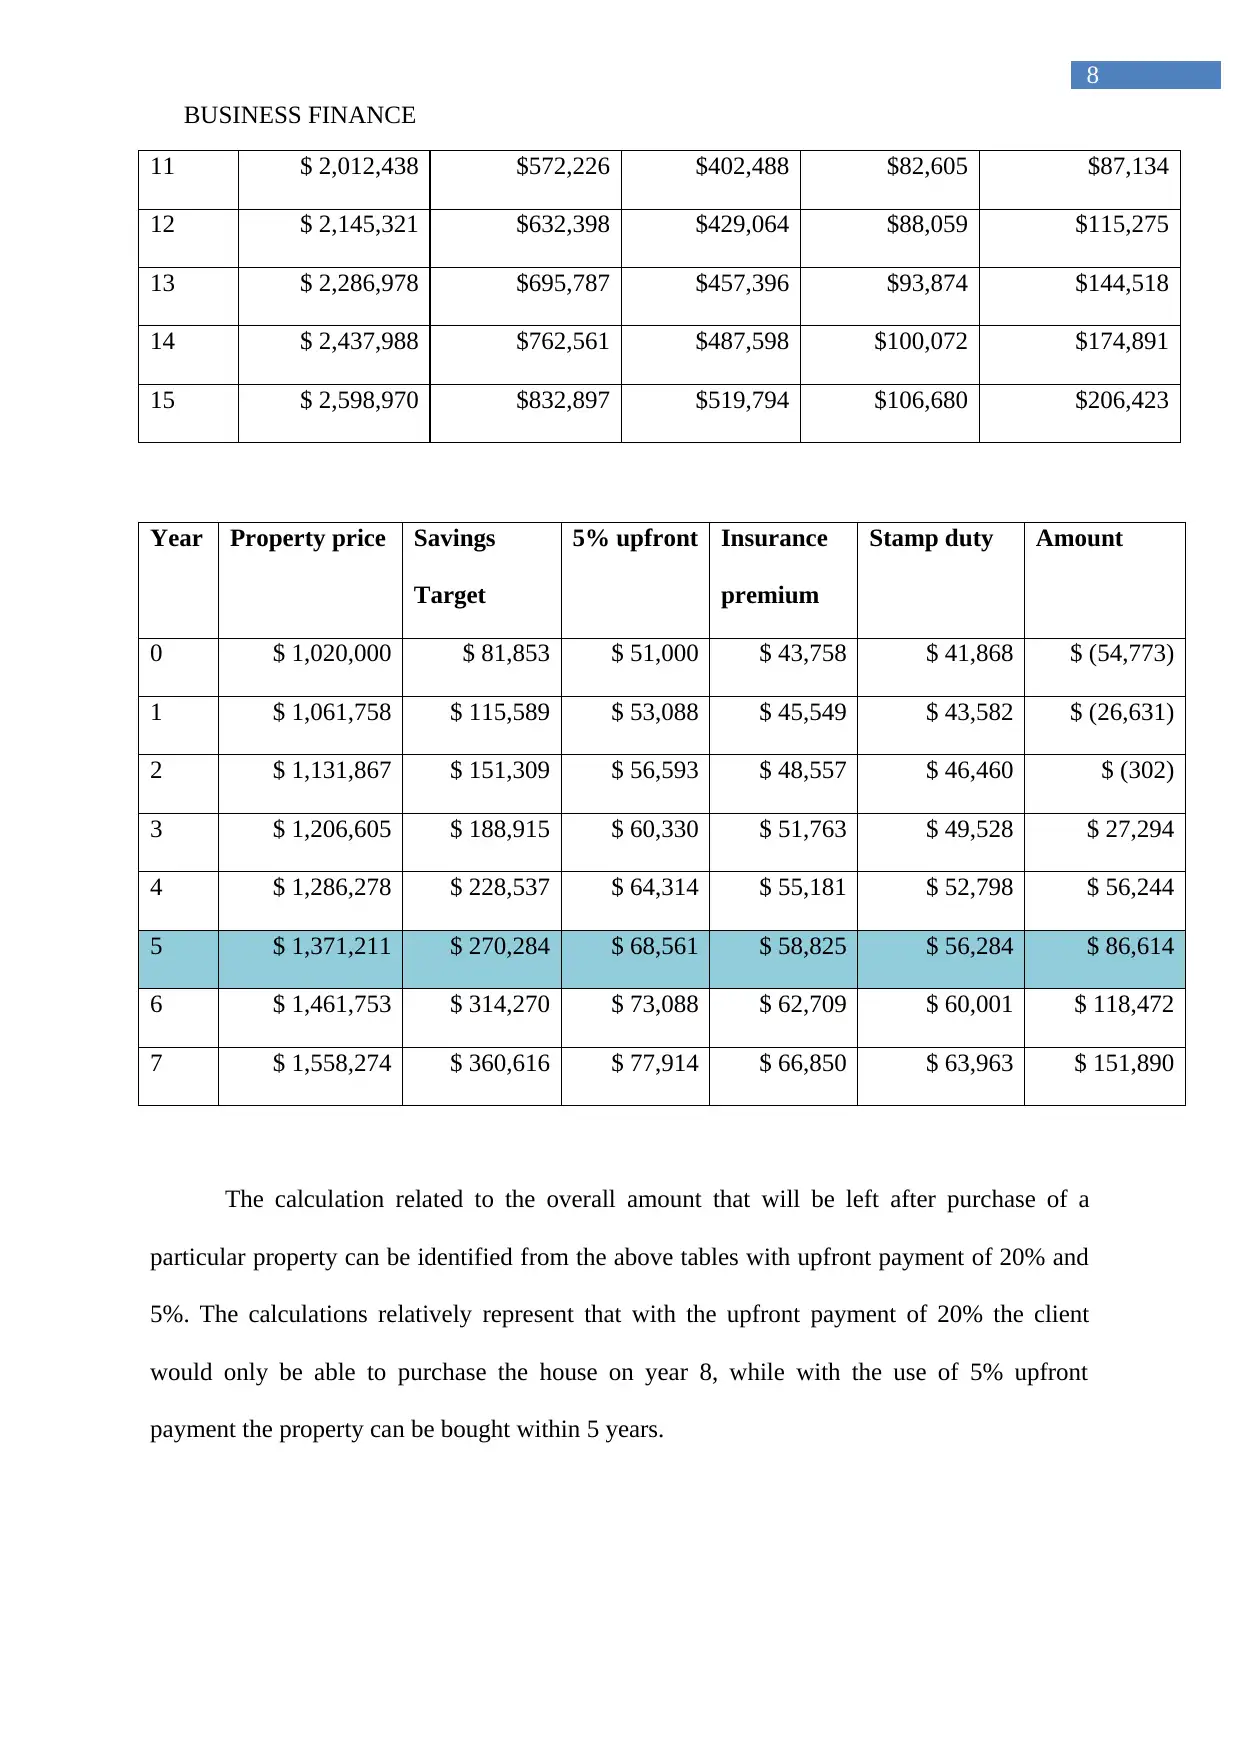
11 $ 2,012,438 $572,226 $402,488 $82,605 $87,134
12 $ 2,145,321 $632,398 $429,064 $88,059 $115,275
13 $ 2,286,978 $695,787 $457,396 $93,874 $144,518
14 $ 2,437,988 $762,561 $487,598 $100,072 $174,891
15 $ 2,598,970 $832,897 $519,794 $106,680 $206,423
Year Property price Savings
Target
5% upfront Insurance
premium
Stamp duty Amount
0 $ 1,020,000 $ 81,853 $ 51,000 $ 43,758 $ 41,868 $ (54,773)
1 $ 1,061,758 $ 115,589 $ 53,088 $ 45,549 $ 43,582 $ (26,631)
2 $ 1,131,867 $ 151,309 $ 56,593 $ 48,557 $ 46,460 $ (302)
3 $ 1,206,605 $ 188,915 $ 60,330 $ 51,763 $ 49,528 $ 27,294
4 $ 1,286,278 $ 228,537 $ 64,314 $ 55,181 $ 52,798 $ 56,244
5 $ 1,371,211 $ 270,284 $ 68,561 $ 58,825 $ 56,284 $ 86,614
6 $ 1,461,753 $ 314,270 $ 73,088 $ 62,709 $ 60,001 $ 118,472
7 $ 1,558,274 $ 360,616 $ 77,914 $ 66,850 $ 63,963 $ 151,890
The calculation related to the overall amount that will be left after purchase of a
particular property can be identified from the above tables with upfront payment of 20% and
5%. The calculations relatively represent that with the upfront payment of 20% the client
would only be able to purchase the house on year 8, while with the use of 5% upfront
payment the property can be bought within 5 years.
8
11 $ 2,012,438 $572,226 $402,488 $82,605 $87,134
12 $ 2,145,321 $632,398 $429,064 $88,059 $115,275
13 $ 2,286,978 $695,787 $457,396 $93,874 $144,518
14 $ 2,437,988 $762,561 $487,598 $100,072 $174,891
15 $ 2,598,970 $832,897 $519,794 $106,680 $206,423
Year Property price Savings
Target
5% upfront Insurance
premium
Stamp duty Amount
0 $ 1,020,000 $ 81,853 $ 51,000 $ 43,758 $ 41,868 $ (54,773)
1 $ 1,061,758 $ 115,589 $ 53,088 $ 45,549 $ 43,582 $ (26,631)
2 $ 1,131,867 $ 151,309 $ 56,593 $ 48,557 $ 46,460 $ (302)
3 $ 1,206,605 $ 188,915 $ 60,330 $ 51,763 $ 49,528 $ 27,294
4 $ 1,286,278 $ 228,537 $ 64,314 $ 55,181 $ 52,798 $ 56,244
5 $ 1,371,211 $ 270,284 $ 68,561 $ 58,825 $ 56,284 $ 86,614
6 $ 1,461,753 $ 314,270 $ 73,088 $ 62,709 $ 60,001 $ 118,472
7 $ 1,558,274 $ 360,616 $ 77,914 $ 66,850 $ 63,963 $ 151,890
The calculation related to the overall amount that will be left after purchase of a
particular property can be identified from the above tables with upfront payment of 20% and
5%. The calculations relatively represent that with the upfront payment of 20% the client
would only be able to purchase the house on year 8, while with the use of 5% upfront
payment the property can be bought within 5 years.
⊘ This is a preview!⊘
Do you want full access?
Subscribe today to unlock all pages.
Trusted by 1+ million students worldwide
BUSINESS FINANCE
9
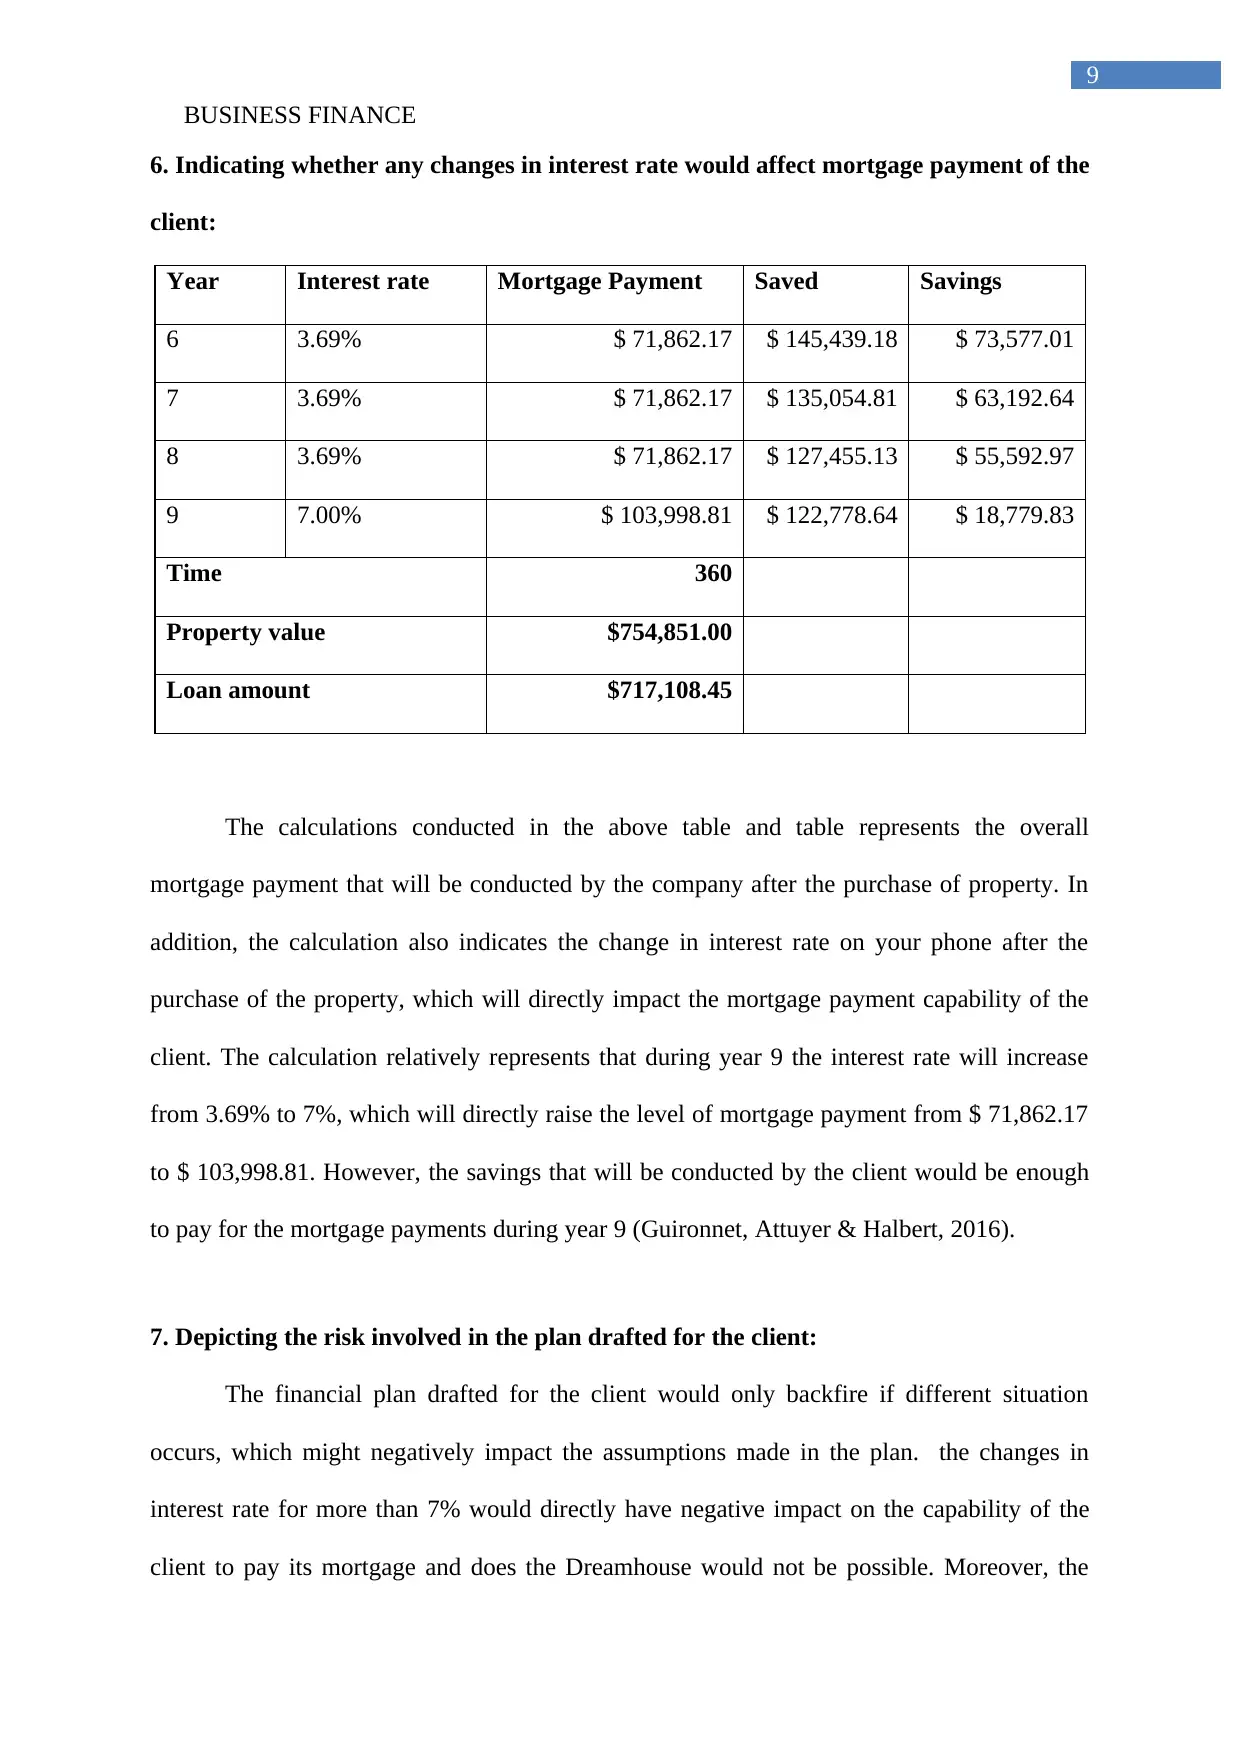
6. Indicating whether any changes in interest rate would affect mortgage payment of the
client:
Year Interest rate Mortgage Payment Saved Savings
6 3.69% $ 71,862.17 $ 145,439.18 $ 73,577.01
7 3.69% $ 71,862.17 $ 135,054.81 $ 63,192.64
8 3.69% $ 71,862.17 $ 127,455.13 $ 55,592.97
9 7.00% $ 103,998.81 $ 122,778.64 $ 18,779.83
Time 360
Property value $754,851.00
Loan amount $717,108.45
The calculations conducted in the above table and table represents the overall
mortgage payment that will be conducted by the company after the purchase of property. In
addition, the calculation also indicates the change in interest rate on your phone after the
purchase of the property, which will directly impact the mortgage payment capability of the
client. The calculation relatively represents that during year 9 the interest rate will increase
from 3.69% to 7%, which will directly raise the level of mortgage payment from $ 71,862.17
to $ 103,998.81. However, the savings that will be conducted by the client would be enough
to pay for the mortgage payments during year 9 (Guironnet, Attuyer & Halbert, 2016).
7. Depicting the risk involved in the plan drafted for the client:
The financial plan drafted for the client would only backfire if different situation
occurs, which might negatively impact the assumptions made in the plan. the changes in
interest rate for more than 7% would directly have negative impact on the capability of the
client to pay its mortgage and does the Dreamhouse would not be possible. Moreover, the
9
6. Indicating whether any changes in interest rate would affect mortgage payment of the
client:
Year Interest rate Mortgage Payment Saved Savings
6 3.69% $ 71,862.17 $ 145,439.18 $ 73,577.01
7 3.69% $ 71,862.17 $ 135,054.81 $ 63,192.64
8 3.69% $ 71,862.17 $ 127,455.13 $ 55,592.97
9 7.00% $ 103,998.81 $ 122,778.64 $ 18,779.83
Time 360
Property value $754,851.00
Loan amount $717,108.45
The calculations conducted in the above table and table represents the overall
mortgage payment that will be conducted by the company after the purchase of property. In
addition, the calculation also indicates the change in interest rate on your phone after the
purchase of the property, which will directly impact the mortgage payment capability of the
client. The calculation relatively represents that during year 9 the interest rate will increase
from 3.69% to 7%, which will directly raise the level of mortgage payment from $ 71,862.17
to $ 103,998.81. However, the savings that will be conducted by the client would be enough
to pay for the mortgage payments during year 9 (Guironnet, Attuyer & Halbert, 2016).
7. Depicting the risk involved in the plan drafted for the client:
The financial plan drafted for the client would only backfire if different situation
occurs, which might negatively impact the assumptions made in the plan. the changes in
interest rate for more than 7% would directly have negative impact on the capability of the
client to pay its mortgage and does the Dreamhouse would not be possible. Moreover, the
Paraphrase This Document
Need a fresh take? Get an instant paraphrase of this document with our AI Paraphraser

BUSINESS FINANCE
10
situation where client does not lose her job is also evaluated, which mitre directly impact the
financial plan and effect ability of the client to fulfil her Australian dream. The risk that is
listed in the above scenario relatively depicts the worst case condition for the client where no
financial plan could help to achieve the Austrian dream.
BUSINESS FINANCE
11
Reference and Bibliography:
Abs.gov.au. (2018). Ato.gov.au. Retrieved 26 May 2018, from
https://www.ato.gov.au/calculators-and-tools/simple-tax-calculator/
Baur, D. G., & Heaney, R. (2017). Bubbles in the Australian housing market. Pacific-Basin
Finance Journal, 44, 113-126.
Chia, W. M., Li, M., & Zheng, H. (2017). Behavioral heterogeneity in the Australian housing
market. Applied Economics, 49(9), 872-885.
De Visscher, F. M. (2016). Financing transitions: Managing capital and liquidity in the
family business. Springer.
De Visscher, F. M. (2016). Financing transitions: Managing capital and liquidity in the
family business. Springer.
Guironnet, A., Attuyer, K., & Halbert, L. (2016). Building cities on financial assets: The
financialisation of property markets and its implications for city governments in the
Paris city-region. Urban Studies, 53(7), 1442-1464.
Hawkey, J. (2017). Exit Strategy Planning: Grooming your business for sale or succession.
Routledge.
Living, C. (2018). Cost of Living in Melbourne, Australia. May 2018 prices in
Melbourne.. Expatistan, cost of living comparisons. Retrieved 26 May 2018, from
https://www.expatistan.com/cost-of-living/melbourne
Macaulay, S. (2018). Non-contractual relations in business: A preliminary study. In The Law
and Society Canon (pp. 155-167). Routledge.
⊘ This is a preview!⊘
Do you want full access?
Subscribe today to unlock all pages.
Trusted by 1+ million students worldwide
1 out of 13
Related Documents


Your All-in-One AI-Powered Toolkit for Academic Success.
+13062052269
info@desklib.com
Available 24*7 on WhatsApp / Email
![[object Object]](/_next/static/media/star-bottom.7253800d.svg)
Unlock your academic potential
Copyright © 2020–2026 A2Z Services. All Rights Reserved. Developed and managed by ZUCOL.