University Investment Analysis: BAFI3184 - Investment Selection Report
VerifiedAdded on 2020/09/17
|23
|3091
|106
Report
AI Summary
This report presents a financial analysis of two potential investment projects for Aura Investment: a 10-story hotel apartment building in London, UK, and a 15-story hotel apartment building in Da Nang, Vietnam. The analysis employs various capital investment evaluation techniques, including Net Present Value (NPV), Internal Rate of Return (IRR), Payback Period, and Annualized Net Present Value (EAA), to determine the most suitable investment. The report considers sunk costs, side effects, and opportunity costs for each project, calculating net cash flows and depreciation using the straight-line method. The financial performance of each project is evaluated using tables and calculations within Excel worksheets. The London project demonstrates a positive NPV, a shorter payback period, a higher IRR, and a positive EAA, leading to the recommendation of the London investment. The report also considers additional factors like geographical location and tourism potential of both locations to support the final decision. The report concludes that the London project is the better investment for Aura Investment.
Business Finance - BAFI3184
Investment Selection
Abstract
Employing a variety of capital investment evaluation techniques, including the Net Present Value
method, Internal Rate of Return, Payback Period method and Annualized Net Present Value
(Equivalent Annual Amount) to select the investment best suited for the company.
I. List sunk costs, side effects and opportunity costs for each capital investment
project and calculate the Net Cash Flows for each project.
Aura Investment is considering two projects in order to generate more profits for 20 to 25 years
from the time of the investment. New investment will replace firm’s current investment and is
expected to account for most of the firm’s profit.
Two investment projects are:
- 10-storey hotel apartment building in the heart of London, United Kingdom
- 15-storey hotel apartment building next to the beach in Da Nang, Vietnam.
Sunk costs: are unavoidable and unrecovered costs, which incurred in the past and have
no influence on any ongoing projects in the future. (Kenton, 2018)
10-storey building London 15-storey building Da Nang
Sunk costs $1,000,000 on market research
Side-effects of a capital investment project include ‘both positive (benefits) and negative
(costs) cash flows which result to other aspects of the business as a result of taking on current
business’
10-storey building London 15-storey building Da Nang
Paraphrase This Document
Need a fresh take? Get an instant paraphrase of this document with our AI Paraphraser
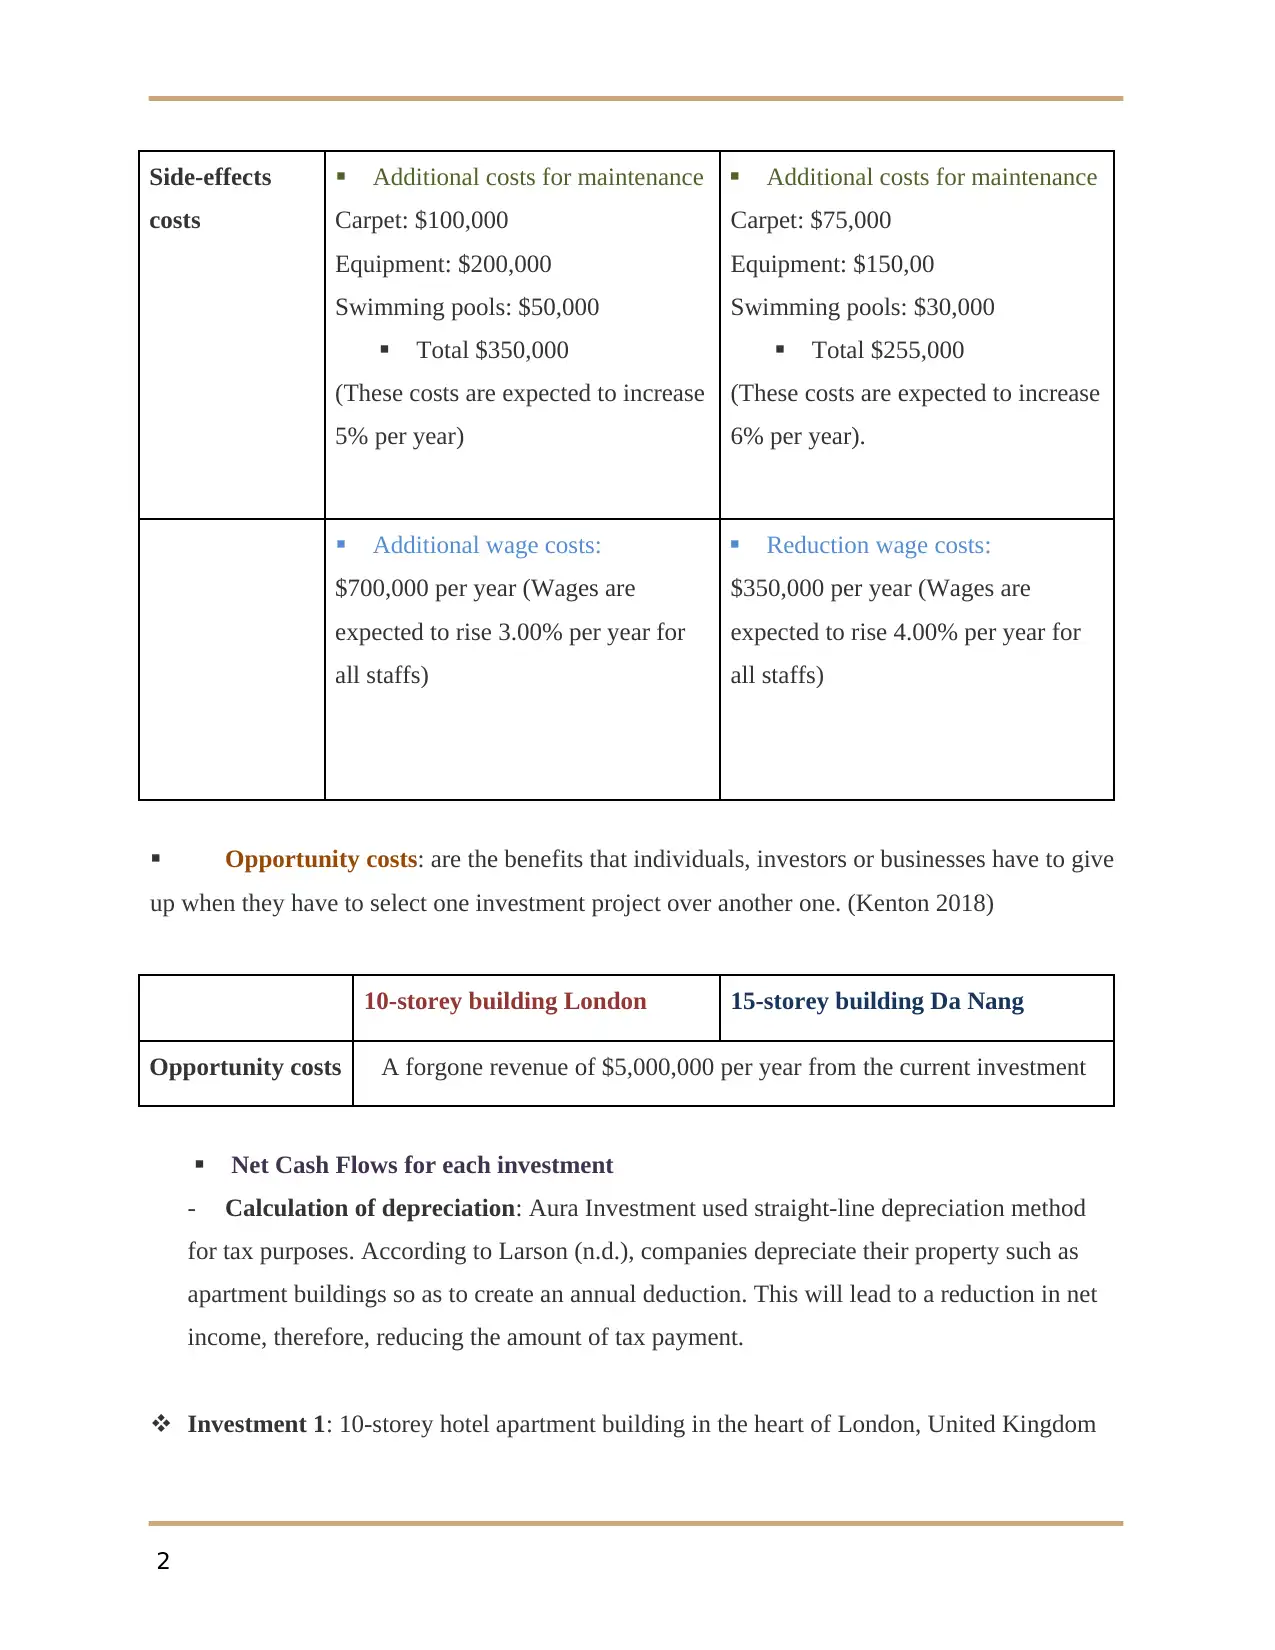
Side-effects
costs
Additional costs for maintenance
Carpet: $100,000
Equipment: $200,000
Swimming pools: $50,000
Total $350,000
(These costs are expected to increase
5% per year)
Additional costs for maintenance
Carpet: $75,000
Equipment: $150,00
Swimming pools: $30,000
Total $255,000
(These costs are expected to increase
6% per year).
Additional wage costs:
$700,000 per year (Wages are
expected to rise 3.00% per year for
all staffs)
Reduction wage costs:
$350,000 per year (Wages are
expected to rise 4.00% per year for
all staffs)
Opportunity costs: are the benefits that individuals, investors or businesses have to give
up when they have to select one investment project over another one. (Kenton 2018)
10-storey building London 15-storey building Da Nang
Opportunity costs A forgone revenue of $5,000,000 per year from the current investment
Net Cash Flows for each investment
- Calculation of depreciation: Aura Investment used straight-line depreciation method
for tax purposes. According to Larson (n.d.), companies depreciate their property such as
apartment buildings so as to create an annual deduction. This will lead to a reduction in net
income, therefore, reducing the amount of tax payment.
Investment 1: 10-storey hotel apartment building in the heart of London, United Kingdom
2
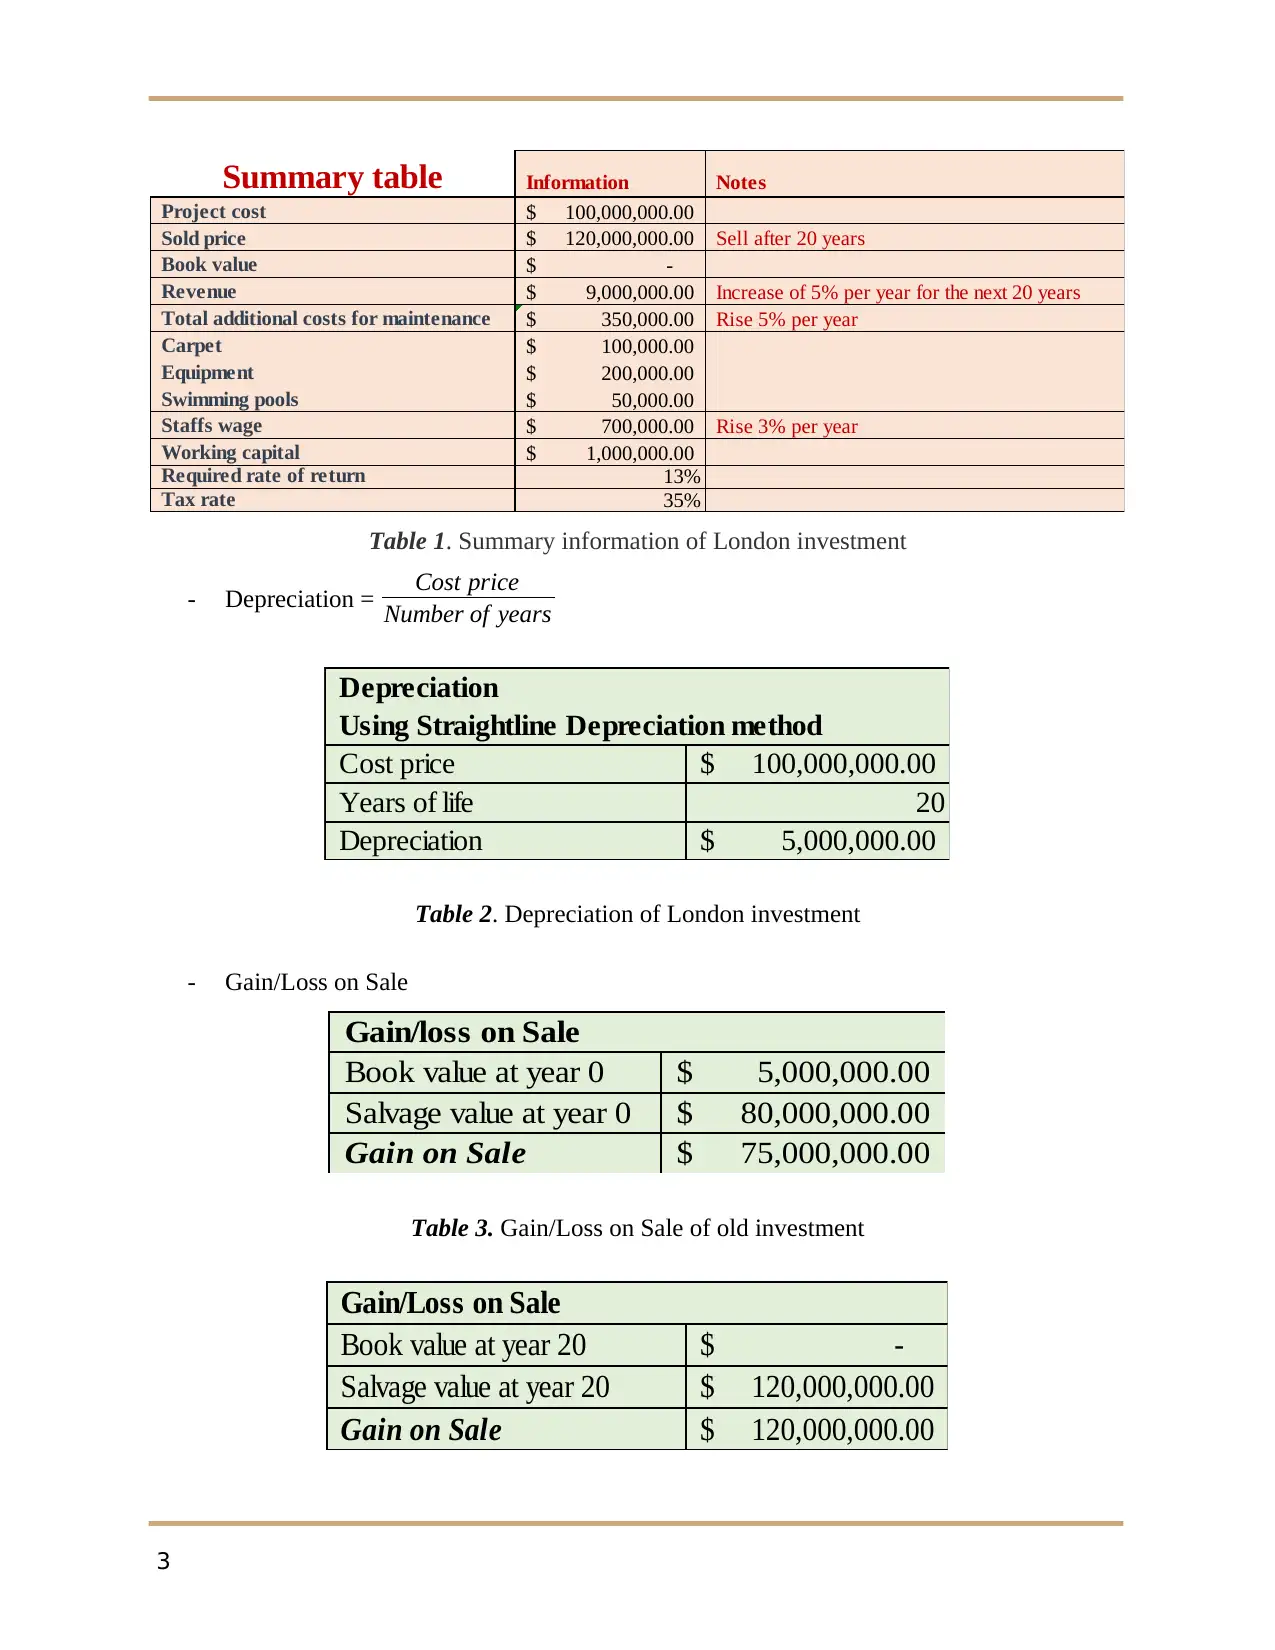
Summary table Information Notes
Project cost 100,000,000.00$
Sold price 120,000,000.00$ Sell after 20 years
Book value -$
Revenue 9,000,000.00$ Increase of 5% per year for the next 20 years
Total additional costs for maintenance 350,000.00$ Rise 5% per year
Carpet 100,000.00$
Equipment 200,000.00$
Swimming pools 50,000.00$
Staffs wage 700,000.00$ Rise 3% per year
Working capital 1,000,000.00$
Required rate of return 13%
Tax rate 35%
Table 1. Summary information of London investment
- Depreciation = Cost price
Number of years
Depreciation
Using Straightline Depreciation method
Cost price 100,000,000.00$
Years of life 20
Depreciation 5,000,000.00$
Table 2. Depreciation of London investment
- Gain/Loss on Sale
Gain/loss on Sale
Book value at year 0 5,000,000.00$
Salvage value at year 0 80,000,000.00$
Gain on Sale 75,000,000.00$
Table 3. Gain/Loss on Sale of old investment
Gain/Loss on Sale
Book value at year 20 -$
Salvage value at year 20 120,000,000.00$
Gain on Sale 120,000,000.00$
3
⊘ This is a preview!⊘
Do you want full access?
Subscribe today to unlock all pages.
Trusted by 1+ million students worldwide
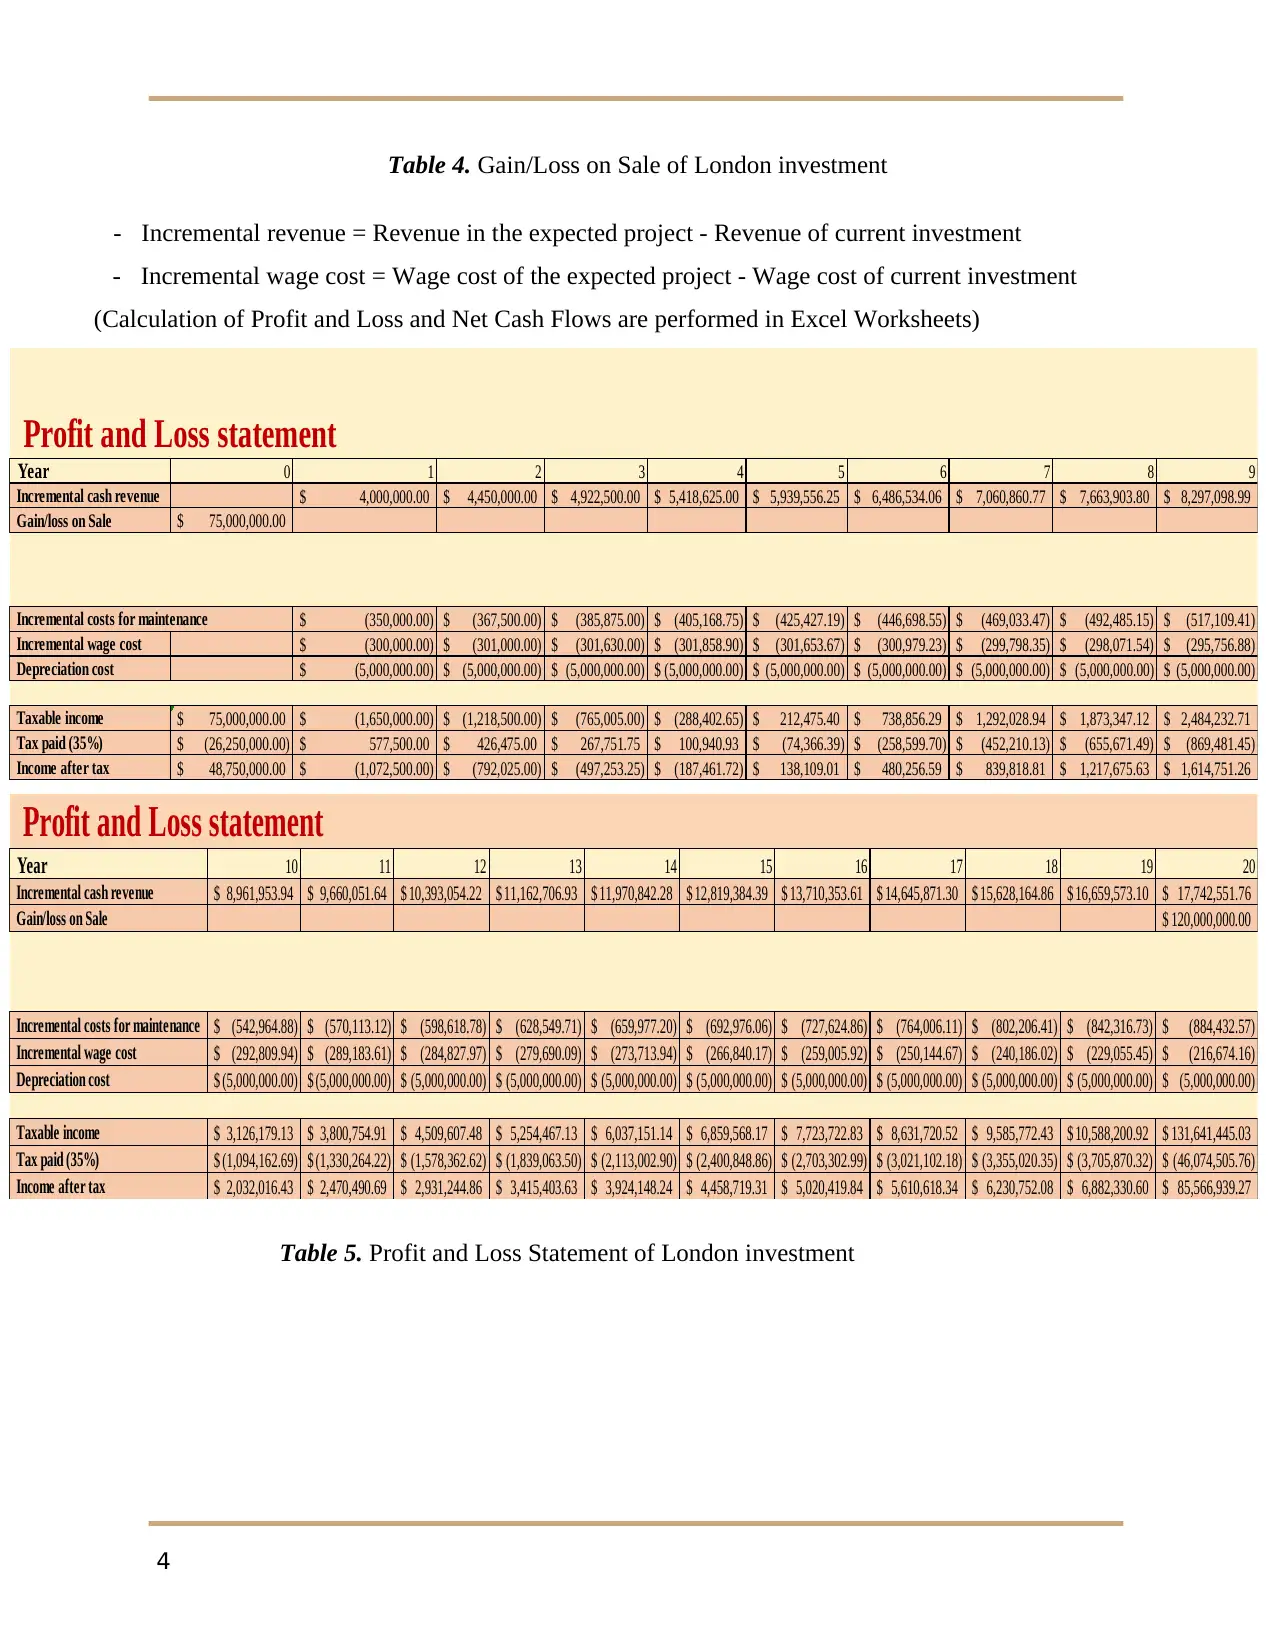
Table 4. Gain/Loss on Sale of London investment
- Incremental revenue = Revenue in the expected project - Revenue of current investment
- Incremental wage cost = Wage cost of the expected project - Wage cost of current investment
(Calculation of Profit and Loss and Net Cash Flows are performed in Excel Worksheets)
Profit and Loss statement
Year 0 1 2 3 4 5 6 7 8 9
Incremental cash revenue 4,000,000.00$ 4,450,000.00$ 4,922,500.00$ 5,418,625.00$ 5,939,556.25$ 6,486,534.06$ 7,060,860.77$ 7,663,903.80$ 8,297,098.99$
Gain/loss on Sale 75,000,000.00$
Incremental costs for maintenance (350,000.00)$ (367,500.00)$ (385,875.00)$ (405,168.75)$ (425,427.19)$ (446,698.55)$ (469,033.47)$ (492,485.15)$ (517,109.41)$
Incremental wage cost (300,000.00)$ (301,000.00)$ (301,630.00)$ (301,858.90)$ (301,653.67)$ (300,979.23)$ (299,798.35)$ (298,071.54)$ (295,756.88)$
Depreciation cost (5,000,000.00)$ (5,000,000.00)$ (5,000,000.00)$ (5,000,000.00)$ (5,000,000.00)$ (5,000,000.00)$ (5,000,000.00)$ (5,000,000.00)$ (5,000,000.00)$
Taxable income 75,000,000.00$ (1,650,000.00)$ (1,218,500.00)$ (765,005.00)$ (288,402.65)$ 212,475.40$ 738,856.29$ 1,292,028.94$ 1,873,347.12$ 2,484,232.71$
Tax paid (35%) (26,250,000.00)$ 577,500.00$ 426,475.00$ 267,751.75$ 100,940.93$ (74,366.39)$ (258,599.70)$ (452,210.13)$ (655,671.49)$ (869,481.45)$
Income after tax 48,750,000.00$ (1,072,500.00)$ (792,025.00)$ (497,253.25)$ (187,461.72)$ 138,109.01$ 480,256.59$ 839,818.81$ 1,217,675.63$ 1,614,751.26$
Profit and Loss statement
Year 10 11 12 13 14 15 16 17 18 19 20
Incremental cash revenue 8,961,953.94$ 9,660,051.64$ 10,393,054.22$ 11,162,706.93$ 11,970,842.28$ 12,819,384.39$ 13,710,353.61$ 14,645,871.30$ 15,628,164.86$ 16,659,573.10$ 17,742,551.76$
Gain/loss on Sale 120,000,000.00$
Incremental costs for maintenance (542,964.88)$ (570,113.12)$ (598,618.78)$ (628,549.71)$ (659,977.20)$ (692,976.06)$ (727,624.86)$ (764,006.11)$ (802,206.41)$ (842,316.73)$ (884,432.57)$
Incremental wage cost (292,809.94)$ (289,183.61)$ (284,827.97)$ (279,690.09)$ (273,713.94)$ (266,840.17)$ (259,005.92)$ (250,144.67)$ (240,186.02)$ (229,055.45)$ (216,674.16)$
Depreciation cost (5,000,000.00)$ (5,000,000.00)$ (5,000,000.00)$ (5,000,000.00)$ (5,000,000.00)$ (5,000,000.00)$ (5,000,000.00)$ (5,000,000.00)$ (5,000,000.00)$ (5,000,000.00)$ (5,000,000.00)$
Taxable income 3,126,179.13$ 3,800,754.91$ 4,509,607.48$ 5,254,467.13$ 6,037,151.14$ 6,859,568.17$ 7,723,722.83$ 8,631,720.52$ 9,585,772.43$ 10,588,200.92$ 131,641,445.03$
Tax paid (35%) (1,094,162.69)$ (1,330,264.22)$ (1,578,362.62)$ (1,839,063.50)$ (2,113,002.90)$ (2,400,848.86)$ (2,703,302.99)$ (3,021,102.18)$ (3,355,020.35)$ (3,705,870.32)$ (46,074,505.76)$
Income after tax 2,032,016.43$ 2,470,490.69$ 2,931,244.86$ 3,415,403.63$ 3,924,148.24$ 4,458,719.31$ 5,020,419.84$ 5,610,618.34$ 6,230,752.08$ 6,882,330.60$ 85,566,939.27$
Table 5. Profit and Loss Statement of London investment
4
Paraphrase This Document
Need a fresh take? Get an instant paraphrase of this document with our AI Paraphraser
Cash flow statement
Year 0 1 2 3 4 5 6 7 8 9
Tax paid (35%) (26,250,000.00)$ 577,500.00$ 426,475.00$ 267,751.75$ 100,940.93$ (74,366.39)$ (258,599.70)$ (452,210.13)$ (655,671.49)$ (869,481.45)$
Incremental cash revenue 4,000,000.00$ 4,450,000.00$ 4,922,500.00$ 5,418,625.00$ 5,939,556.25$ 6,486,534.06$ 7,060,860.77$ 7,663,903.80$ 8,297,098.99$
Incremental costs for maintenance (350,000.00)$ (367,500.00)$ (385,875.00)$ (405,168.75)$ (425,427.19)$ (446,698.55)$ (469,033.47)$ (492,485.15)$ (517,109.41)$
Incremental wage cost (300,000.00)$ (301,000.00)$ (301,630.00)$ (301,858.90)$ (301,653.67)$ (300,979.23)$ (299,798.35)$ (298,071.54)$ (295,756.88)$
Salvage value 80,000,000.00$
Initial Outlay (100,000,000.00)$
Working capital (1,000,000.00)$
Net cash flows (47,250,000.00)$ 3,927,500.00$ 4,207,975.00$ 4,502,746.75$ 4,812,538.28$ 5,138,109.01$ 5,480,256.59$ 5,839,818.81$ 6,217,675.63$ 6,614,751.26$
Cash flow statement
Year 10 11 12 13 14 15 16 17 18 19 20
Tax paid (35%) (1,094,162.69)$ (1,330,264.22)$ (1,578,362.62)$ (1,839,063.50)$ (2,113,002.90)$ (2,400,848.86)$ (2,703,302.99)$ (3,021,102.18)$ (3,355,020.35)$ (3,705,870.32)$ (46,074,505.76)$
Incremental cash revenue 8,961,953.94$ 9,660,051.64$ 10,393,054.22$ 11,162,706.93$ 11,970,842.28$ 12,819,384.39$ 13,710,353.61$ 14,645,871.30$ 15,628,164.86$ 16,659,573.10$ 17,742,551.76$
Incremental costs for maintenance (542,964.88)$ (570,113.12)$ (598,618.78)$ (628,549.71)$ (659,977.20)$ (692,976.06)$ (727,624.86)$ (764,006.11)$ (802,206.41)$ (842,316.73)$ (884,432.57)$
Incremental wage cost (292,809.94)$ (289,183.61)$ (284,827.97)$ (279,690.09)$ (273,713.94)$ (266,840.17)$ (259,005.92)$ (250,144.67)$ (240,186.02)$ (229,055.45)$ (216,674.16)$
Salvage value 120,000,000.00$
Initial Outlay
Working capital 1,000,000.00$
Net cash flows 7,032,016.43$ 7,470,490.69$ 7,931,244.86$ 8,415,403.63$ 8,924,148.24$ 9,458,719.31$ 10,020,419.84$ 10,610,618.34$ 11,230,752.08$ 11,882,330.60$ 91,566,939.27$
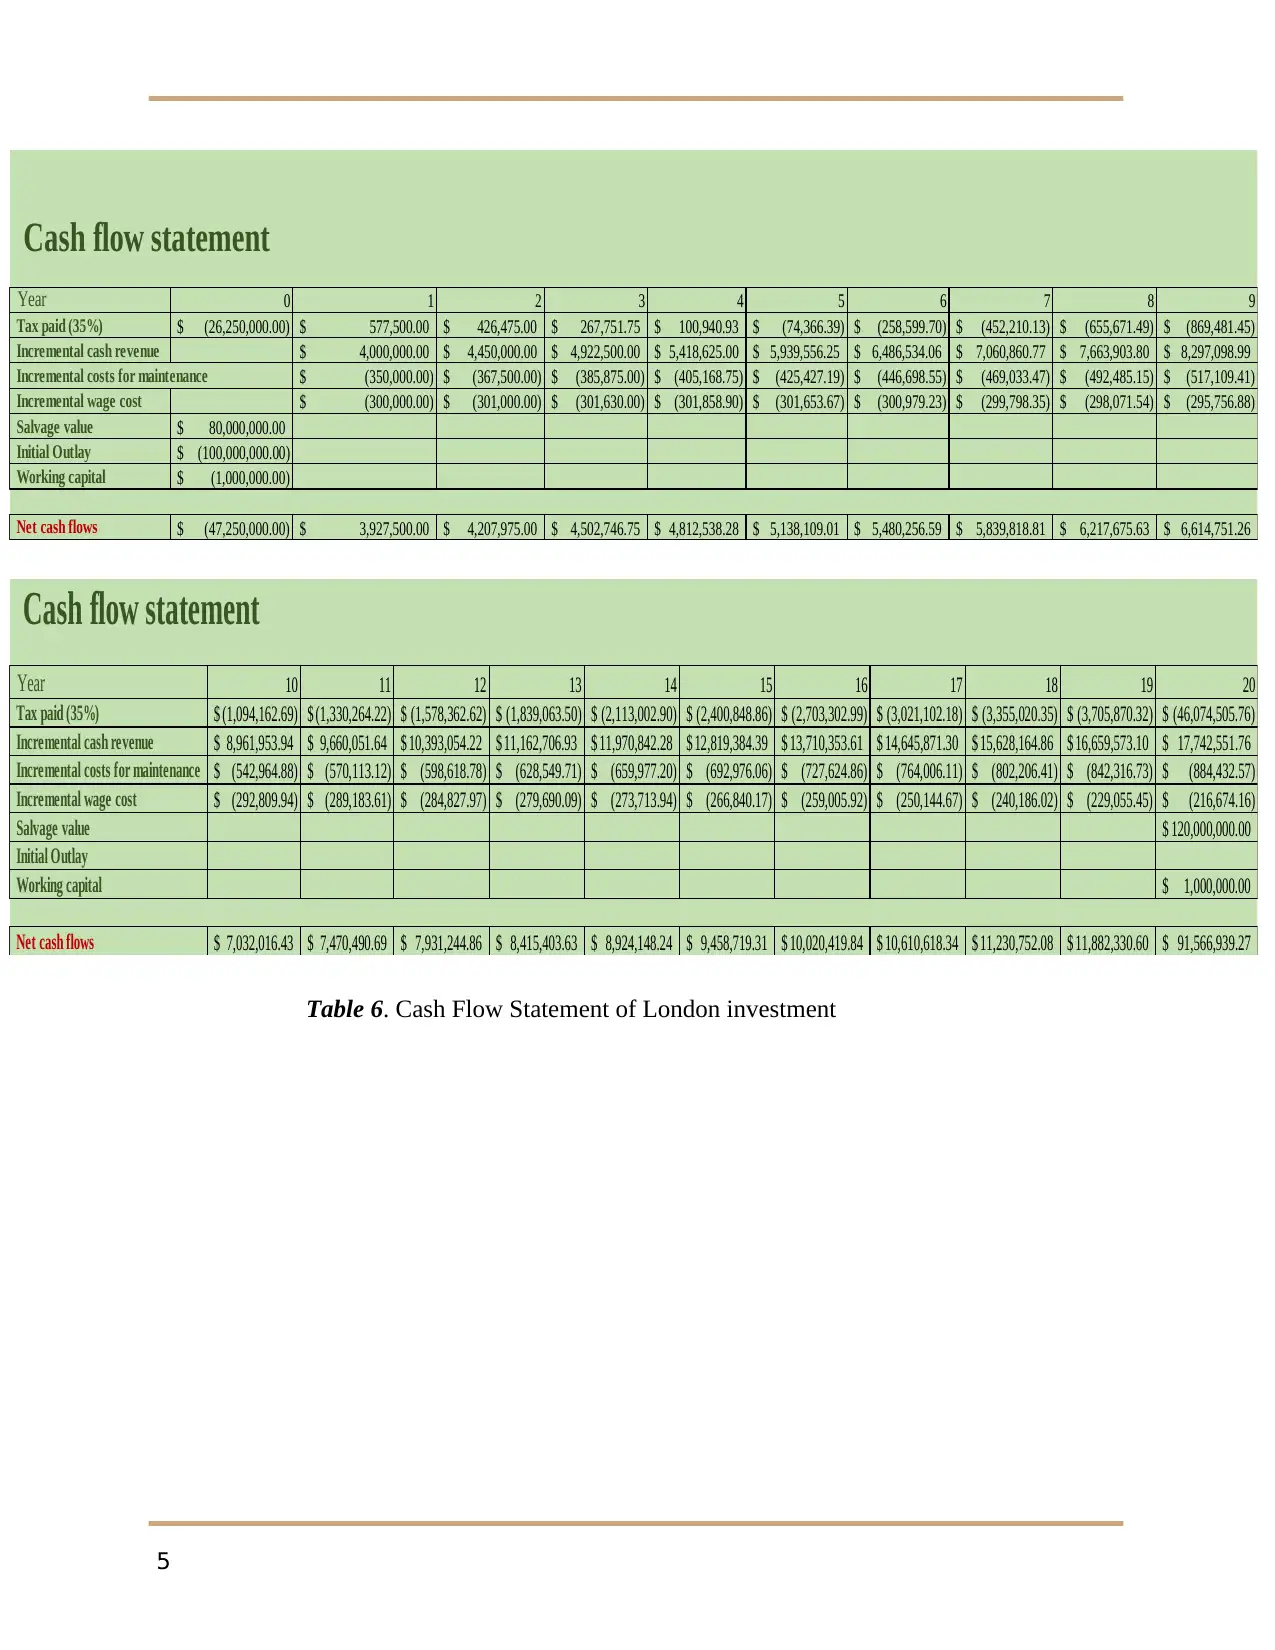
Table 6. Cash Flow Statement of London investment
5
Year 0 1 2 3 4 5 6 7 8 9
Tax paid (35%) (26,250,000.00)$ 577,500.00$ 426,475.00$ 267,751.75$ 100,940.93$ (74,366.39)$ (258,599.70)$ (452,210.13)$ (655,671.49)$ (869,481.45)$
Incremental cash revenue 4,000,000.00$ 4,450,000.00$ 4,922,500.00$ 5,418,625.00$ 5,939,556.25$ 6,486,534.06$ 7,060,860.77$ 7,663,903.80$ 8,297,098.99$
Incremental costs for maintenance (350,000.00)$ (367,500.00)$ (385,875.00)$ (405,168.75)$ (425,427.19)$ (446,698.55)$ (469,033.47)$ (492,485.15)$ (517,109.41)$
Incremental wage cost (300,000.00)$ (301,000.00)$ (301,630.00)$ (301,858.90)$ (301,653.67)$ (300,979.23)$ (299,798.35)$ (298,071.54)$ (295,756.88)$
Salvage value 80,000,000.00$
Initial Outlay (100,000,000.00)$
Working capital (1,000,000.00)$
Net cash flows (47,250,000.00)$ 3,927,500.00$ 4,207,975.00$ 4,502,746.75$ 4,812,538.28$ 5,138,109.01$ 5,480,256.59$ 5,839,818.81$ 6,217,675.63$ 6,614,751.26$
Cash flow statement
Year 10 11 12 13 14 15 16 17 18 19 20
Tax paid (35%) (1,094,162.69)$ (1,330,264.22)$ (1,578,362.62)$ (1,839,063.50)$ (2,113,002.90)$ (2,400,848.86)$ (2,703,302.99)$ (3,021,102.18)$ (3,355,020.35)$ (3,705,870.32)$ (46,074,505.76)$
Incremental cash revenue 8,961,953.94$ 9,660,051.64$ 10,393,054.22$ 11,162,706.93$ 11,970,842.28$ 12,819,384.39$ 13,710,353.61$ 14,645,871.30$ 15,628,164.86$ 16,659,573.10$ 17,742,551.76$
Incremental costs for maintenance (542,964.88)$ (570,113.12)$ (598,618.78)$ (628,549.71)$ (659,977.20)$ (692,976.06)$ (727,624.86)$ (764,006.11)$ (802,206.41)$ (842,316.73)$ (884,432.57)$
Incremental wage cost (292,809.94)$ (289,183.61)$ (284,827.97)$ (279,690.09)$ (273,713.94)$ (266,840.17)$ (259,005.92)$ (250,144.67)$ (240,186.02)$ (229,055.45)$ (216,674.16)$
Salvage value 120,000,000.00$
Initial Outlay
Working capital 1,000,000.00$
Net cash flows 7,032,016.43$ 7,470,490.69$ 7,931,244.86$ 8,415,403.63$ 8,924,148.24$ 9,458,719.31$ 10,020,419.84$ 10,610,618.34$ 11,230,752.08$ 11,882,330.60$ 91,566,939.27$
Table 6. Cash Flow Statement of London investment
5
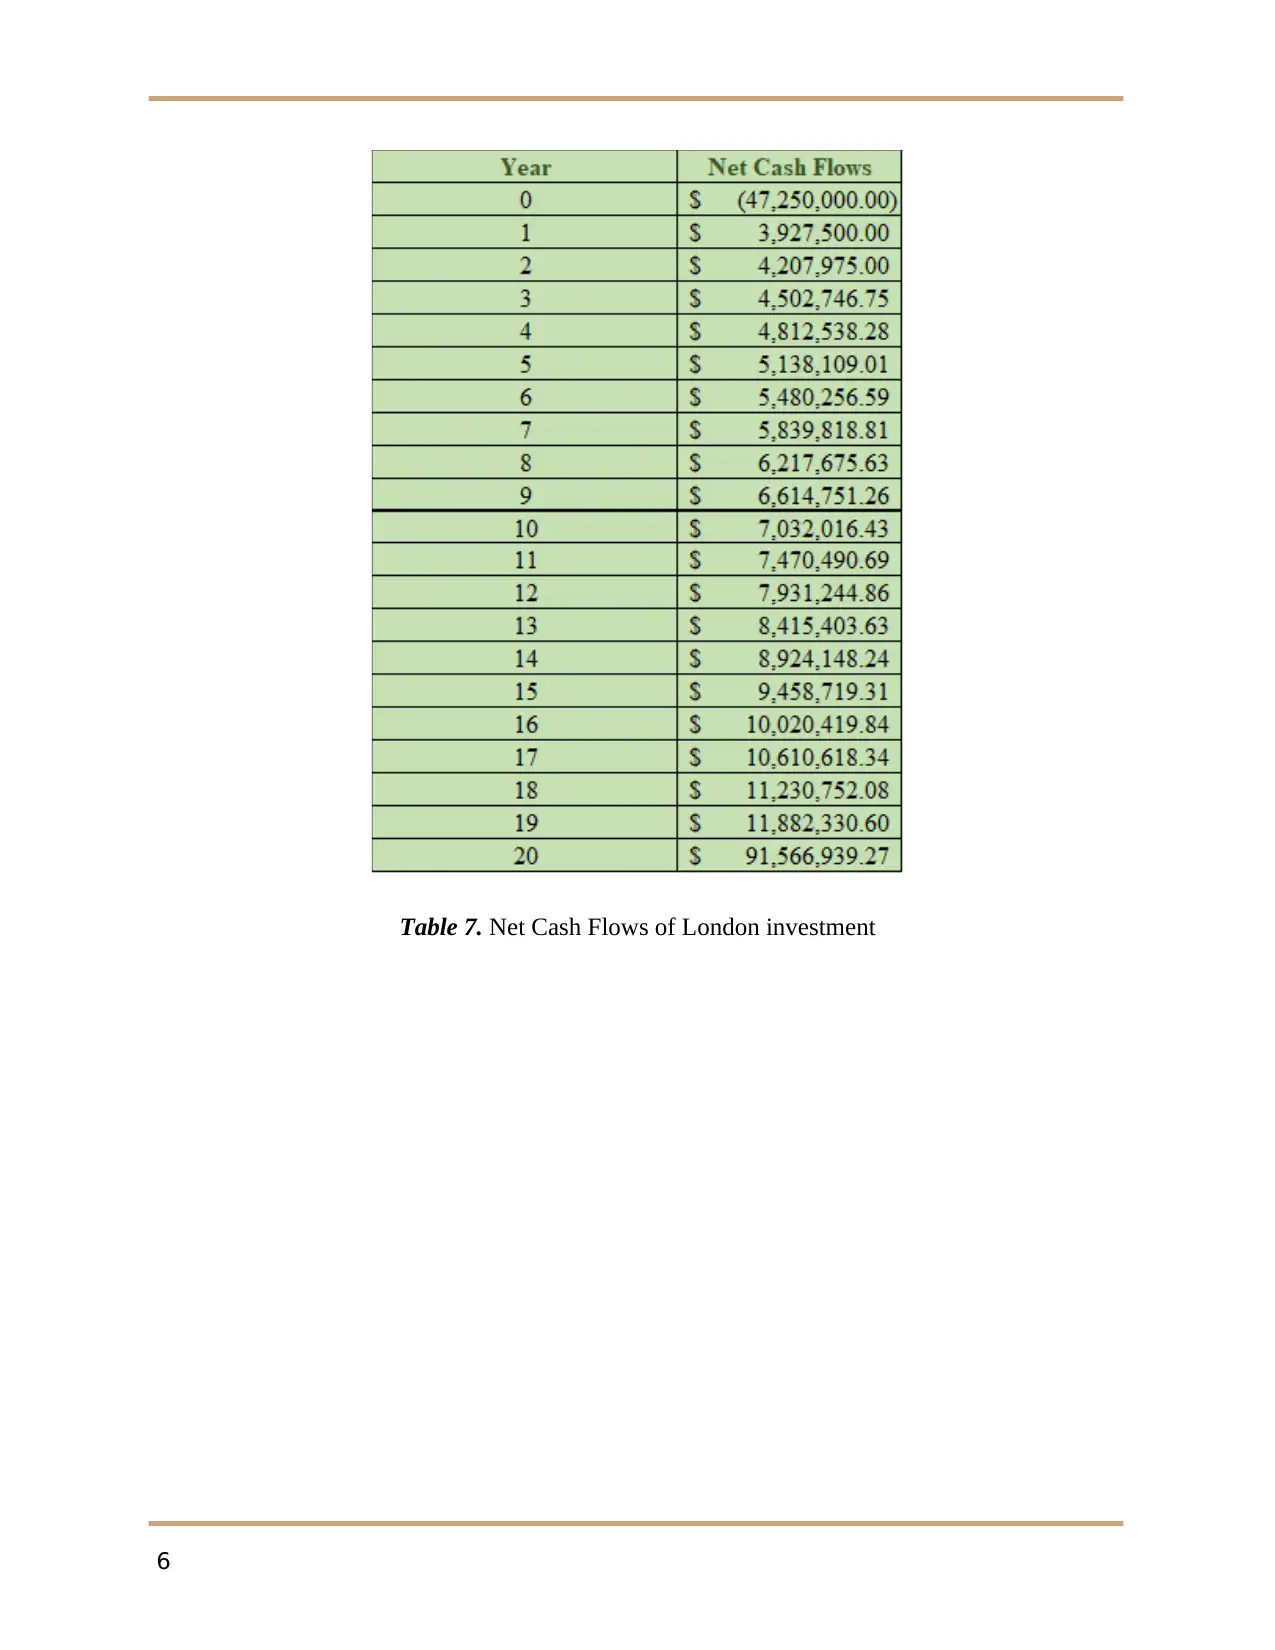
Table 7. Net Cash Flows of London investment
6
6
⊘ This is a preview!⊘
Do you want full access?
Subscribe today to unlock all pages.
Trusted by 1+ million students worldwide
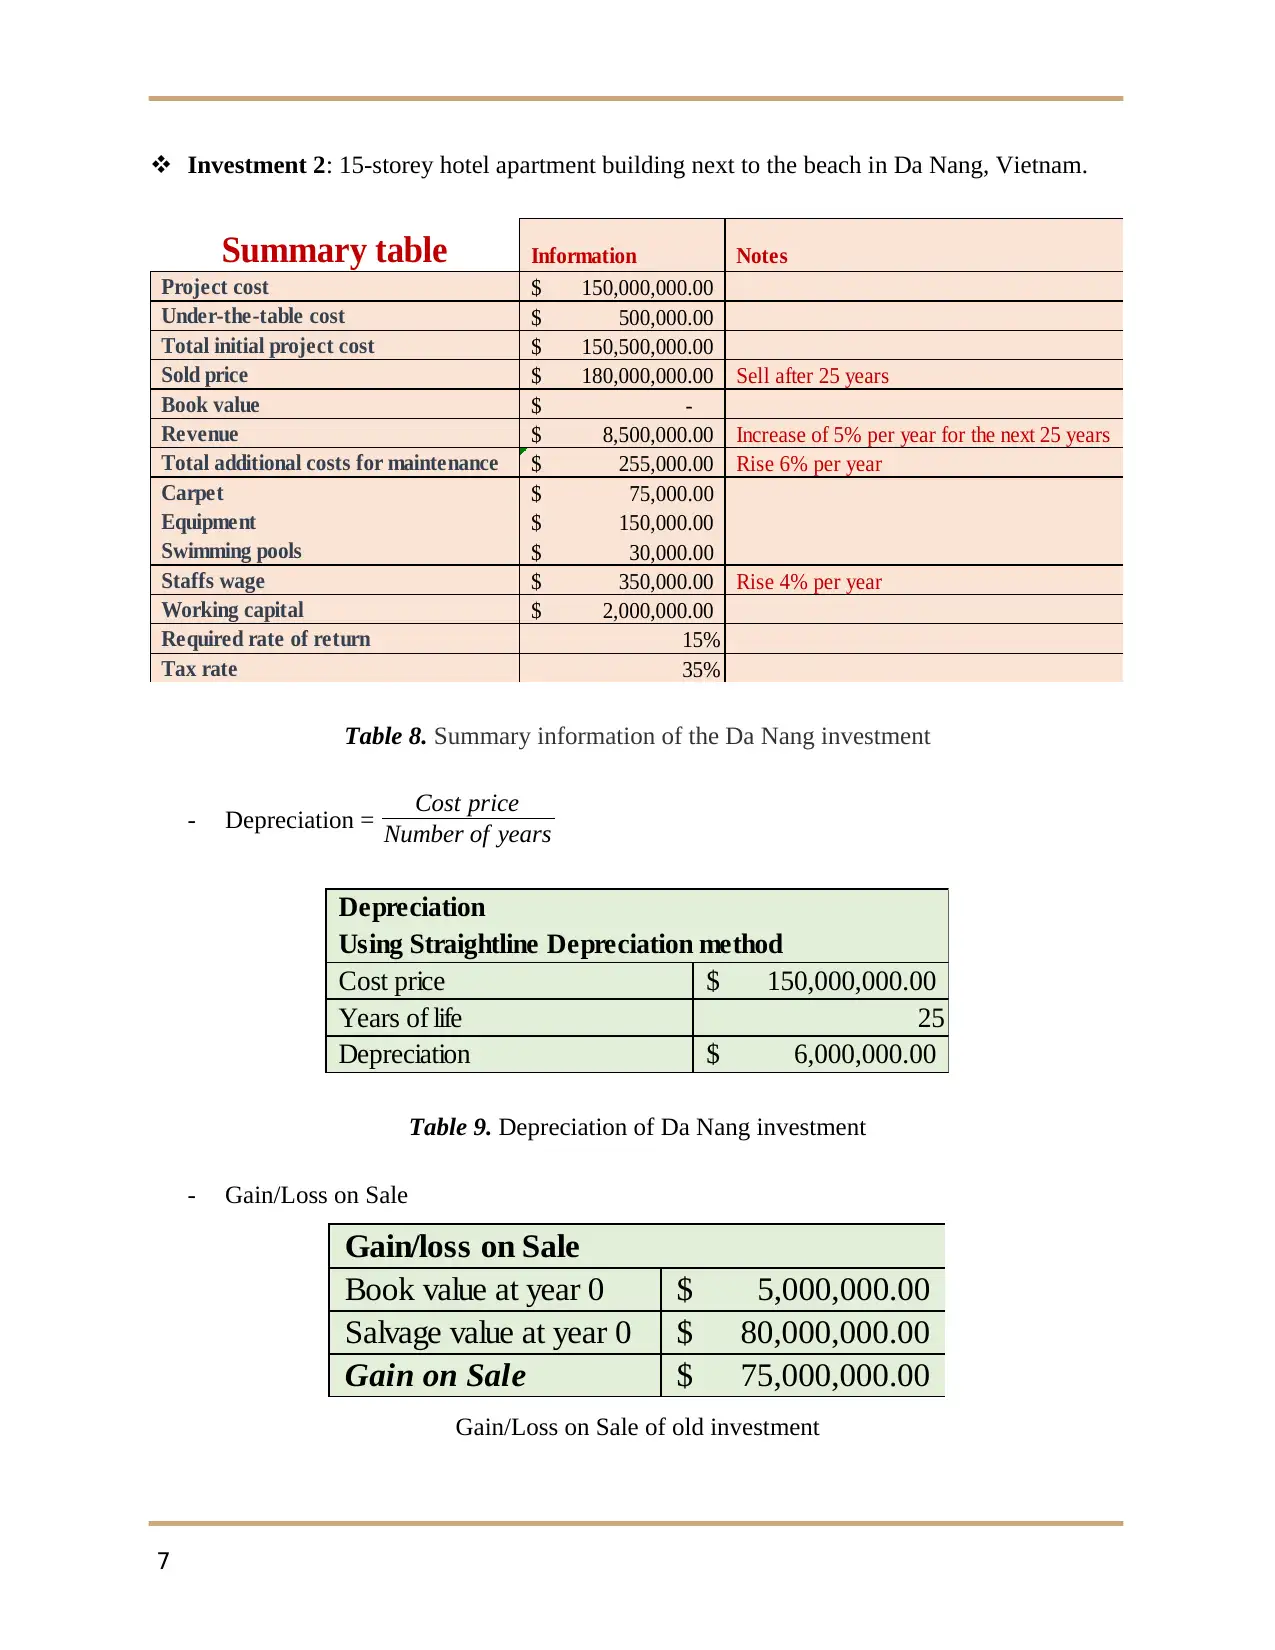
Investment 2: 15-storey hotel apartment building next to the beach in Da Nang, Vietnam.
Summary table Information Notes
Project cost 150,000,000.00$
Under-the-table cost 500,000.00$
Total initial project cost 150,500,000.00$
Sold price 180,000,000.00$ Sell after 25 years
Book value -$
Revenue 8,500,000.00$ Increase of 5% per year for the next 25 years
Total additional costs for maintenance 255,000.00$ Rise 6% per year
Carpet 75,000.00$
Equipment 150,000.00$
Swimming pools 30,000.00$
Staffs wage 350,000.00$ Rise 4% per year
Working capital 2,000,000.00$
Required rate of return 15%
Tax rate 35%
Table 8. Summary information of the Da Nang investment
- Depreciation = Cost price
Number of years
Depreciation
Using Straightline Depreciation method
Cost price 150,000,000.00$
Years of life 25
Depreciation 6,000,000.00$
Table 9. Depreciation of Da Nang investment
- Gain/Loss on Sale
Gain/loss on Sale
Book value at year 0 5,000,000.00$
Salvage value at year 0 80,000,000.00$
Gain on Sale 75,000,000.00$
Gain/Loss on Sale of old investment
7
Paraphrase This Document
Need a fresh take? Get an instant paraphrase of this document with our AI Paraphraser
Gain/Loss on Sale
Book value at year 25 -$
Salvage value at year 25 180,000,000.00$
Gain on Sale 180,000,000.00$
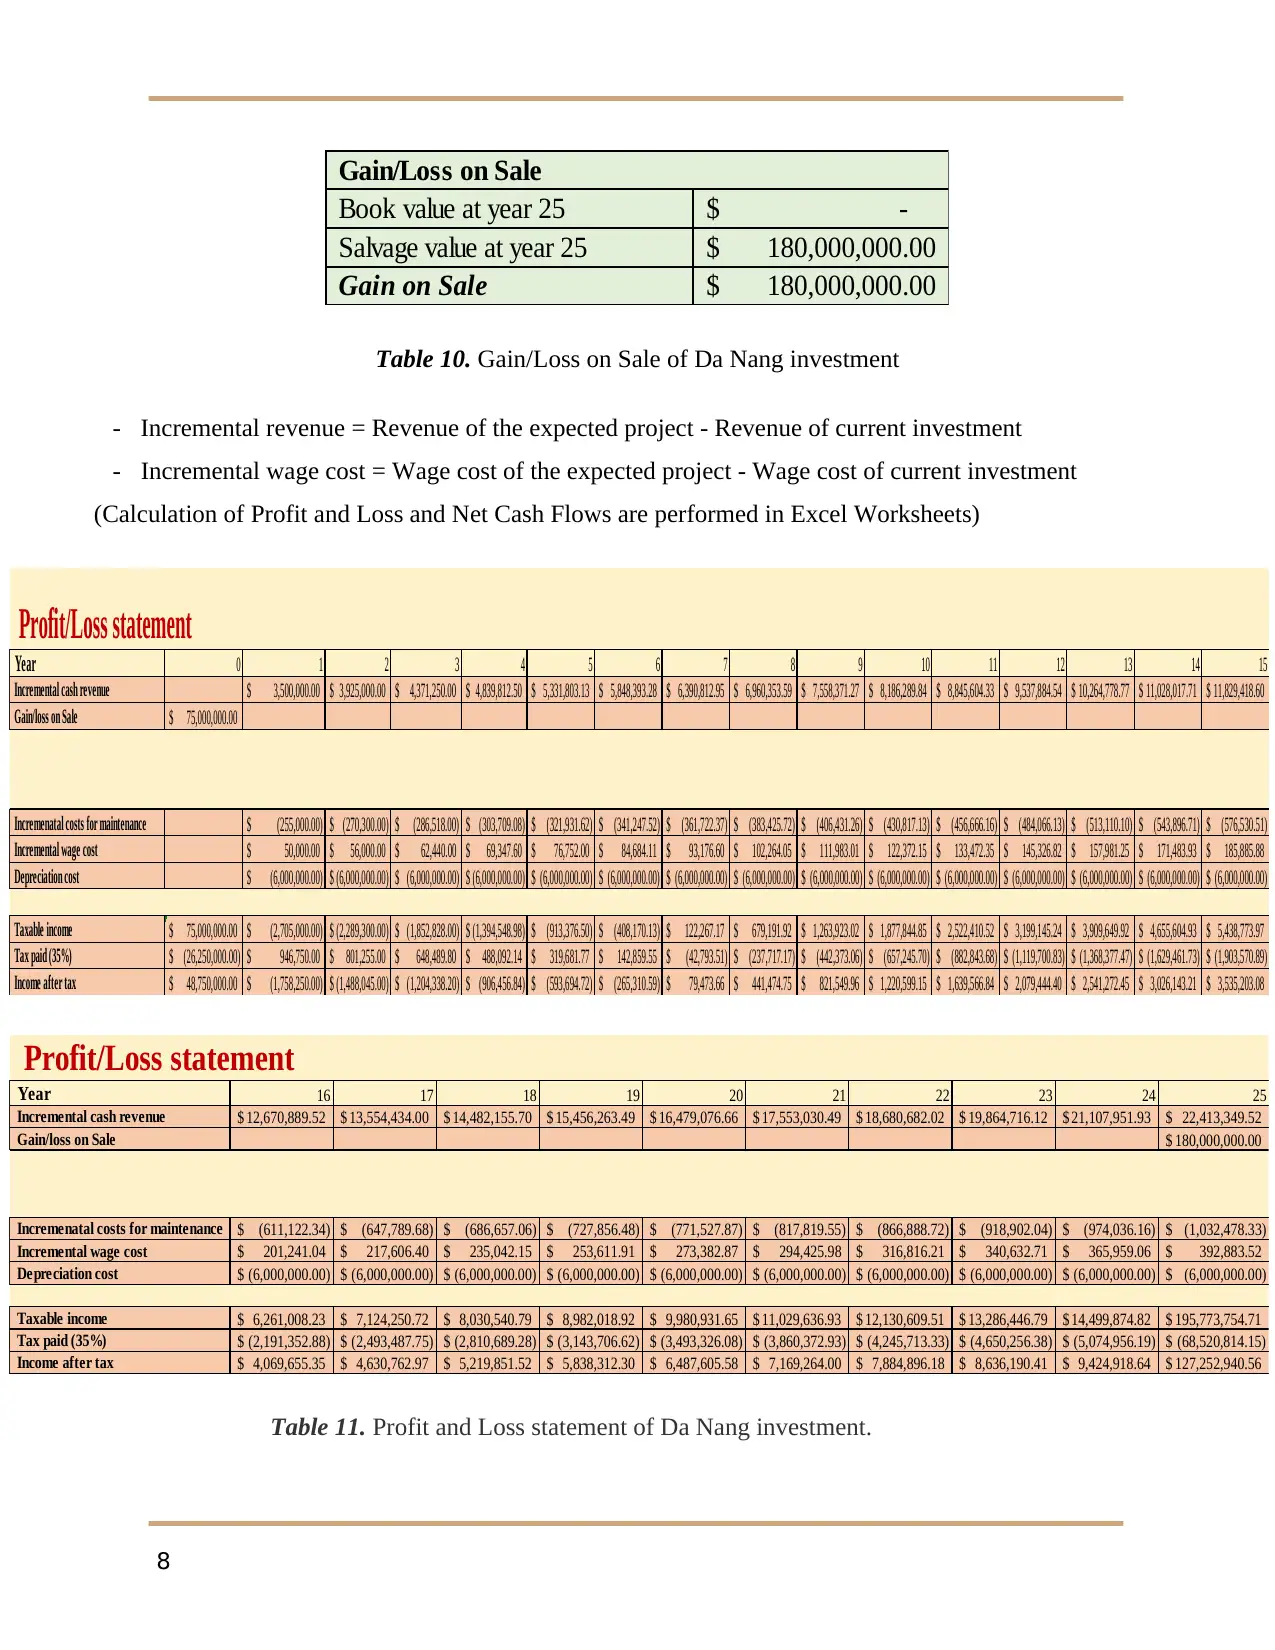
Table 10. Gain/Loss on Sale of Da Nang investment
- Incremental revenue = Revenue of the expected project - Revenue of current investment
- Incremental wage cost = Wage cost of the expected project - Wage cost of current investment
(Calculation of Profit and Loss and Net Cash Flows are performed in Excel Worksheets)
Profit/Loss statement
Year 0 1 2 3 4 5 6 7 8 9 10 11 12 13 14 15
Incremental cash revenue 3,500,000.00$ 3,925,000.00$ 4,371,250.00$ 4,839,812.50$ 5,331,803.13$ 5,848,393.28$ 6,390,812.95$ 6,960,353.59$ 7,558,371.27$ 8,186,289.84$ 8,845,604.33$ 9,537,884.54$ 10,264,778.77$ 11,028,017.71$ 11,829,418.60$
Gain/loss on Sale 75,000,000.00$
Incremenatal costs for maintenance (255,000.00)$ (270,300.00)$ (286,518.00)$ (303,709.08)$ (321,931.62)$ (341,247.52)$ (361,722.37)$ (383,425.72)$ (406,431.26)$ (430,817.13)$ (456,666.16)$ (484,066.13)$ (513,110.10)$ (543,896.71)$ (576,530.51)$
Incremental wage cost 50,000.00$ 56,000.00$ 62,440.00$ 69,347.60$ 76,752.00$ 84,684.11$ 93,176.60$ 102,264.05$ 111,983.01$ 122,372.15$ 133,472.35$ 145,326.82$ 157,981.25$ 171,483.93$ 185,885.88$
Depreciation cost (6,000,000.00)$ (6,000,000.00)$ (6,000,000.00)$ (6,000,000.00)$ (6,000,000.00)$ (6,000,000.00)$ (6,000,000.00)$ (6,000,000.00)$ (6,000,000.00)$ (6,000,000.00)$ (6,000,000.00)$ (6,000,000.00)$ (6,000,000.00)$ (6,000,000.00)$ (6,000,000.00)$
Taxable income 75,000,000.00$ (2,705,000.00)$ (2,289,300.00)$ (1,852,828.00)$ (1,394,548.98)$ (913,376.50)$ (408,170.13)$ 122,267.17$ 679,191.92$ 1,263,923.02$ 1,877,844.85$ 2,522,410.52$ 3,199,145.24$ 3,909,649.92$ 4,655,604.93$ 5,438,773.97$
Tax paid (35%) (26,250,000.00)$ 946,750.00$ 801,255.00$ 648,489.80$ 488,092.14$ 319,681.77$ 142,859.55$ (42,793.51)$ (237,717.17)$ (442,373.06)$ (657,245.70)$ (882,843.68)$ (1,119,700.83)$ (1,368,377.47)$ (1,629,461.73)$ (1,903,570.89)$
Income after tax 48,750,000.00$ (1,758,250.00)$ (1,488,045.00)$ (1,204,338.20)$ (906,456.84)$ (593,694.72)$ (265,310.59)$ 79,473.66$ 441,474.75$ 821,549.96$ 1,220,599.15$ 1,639,566.84$ 2,079,444.40$ 2,541,272.45$ 3,026,143.21$ 3,535,203.08$
Profit/Loss statement
Year 16 17 18 19 20 21 22 23 24 25
Incremental cash revenue 12,670,889.52$ 13,554,434.00$ 14,482,155.70$ 15,456,263.49$ 16,479,076.66$ 17,553,030.49$ 18,680,682.02$ 19,864,716.12$ 21,107,951.93$ 22,413,349.52$
Gain/loss on Sale 180,000,000.00$
Incremenatal costs for maintenance (611,122.34)$ (647,789.68)$ (686,657.06)$ (727,856.48)$ (771,527.87)$ (817,819.55)$ (866,888.72)$ (918,902.04)$ (974,036.16)$ (1,032,478.33)$
Incremental wage cost 201,241.04$ 217,606.40$ 235,042.15$ 253,611.91$ 273,382.87$ 294,425.98$ 316,816.21$ 340,632.71$ 365,959.06$ 392,883.52$
Depreciation cost (6,000,000.00)$ (6,000,000.00)$ (6,000,000.00)$ (6,000,000.00)$ (6,000,000.00)$ (6,000,000.00)$ (6,000,000.00)$ (6,000,000.00)$ (6,000,000.00)$ (6,000,000.00)$
Taxable income 6,261,008.23$ 7,124,250.72$ 8,030,540.79$ 8,982,018.92$ 9,980,931.65$ 11,029,636.93$ 12,130,609.51$ 13,286,446.79$ 14,499,874.82$ 195,773,754.71$
Tax paid (35%) (2,191,352.88)$ (2,493,487.75)$ (2,810,689.28)$ (3,143,706.62)$ (3,493,326.08)$ (3,860,372.93)$ (4,245,713.33)$ (4,650,256.38)$ (5,074,956.19)$ (68,520,814.15)$
Income after tax 4,069,655.35$ 4,630,762.97$ 5,219,851.52$ 5,838,312.30$ 6,487,605.58$ 7,169,264.00$ 7,884,896.18$ 8,636,190.41$ 9,424,918.64$ 127,252,940.56$
Table 11. Profit and Loss statement of Da Nang investment.
8
Book value at year 25 -$
Salvage value at year 25 180,000,000.00$
Gain on Sale 180,000,000.00$
Table 10. Gain/Loss on Sale of Da Nang investment
- Incremental revenue = Revenue of the expected project - Revenue of current investment
- Incremental wage cost = Wage cost of the expected project - Wage cost of current investment
(Calculation of Profit and Loss and Net Cash Flows are performed in Excel Worksheets)
Profit/Loss statement
Year 0 1 2 3 4 5 6 7 8 9 10 11 12 13 14 15
Incremental cash revenue 3,500,000.00$ 3,925,000.00$ 4,371,250.00$ 4,839,812.50$ 5,331,803.13$ 5,848,393.28$ 6,390,812.95$ 6,960,353.59$ 7,558,371.27$ 8,186,289.84$ 8,845,604.33$ 9,537,884.54$ 10,264,778.77$ 11,028,017.71$ 11,829,418.60$
Gain/loss on Sale 75,000,000.00$
Incremenatal costs for maintenance (255,000.00)$ (270,300.00)$ (286,518.00)$ (303,709.08)$ (321,931.62)$ (341,247.52)$ (361,722.37)$ (383,425.72)$ (406,431.26)$ (430,817.13)$ (456,666.16)$ (484,066.13)$ (513,110.10)$ (543,896.71)$ (576,530.51)$
Incremental wage cost 50,000.00$ 56,000.00$ 62,440.00$ 69,347.60$ 76,752.00$ 84,684.11$ 93,176.60$ 102,264.05$ 111,983.01$ 122,372.15$ 133,472.35$ 145,326.82$ 157,981.25$ 171,483.93$ 185,885.88$
Depreciation cost (6,000,000.00)$ (6,000,000.00)$ (6,000,000.00)$ (6,000,000.00)$ (6,000,000.00)$ (6,000,000.00)$ (6,000,000.00)$ (6,000,000.00)$ (6,000,000.00)$ (6,000,000.00)$ (6,000,000.00)$ (6,000,000.00)$ (6,000,000.00)$ (6,000,000.00)$ (6,000,000.00)$
Taxable income 75,000,000.00$ (2,705,000.00)$ (2,289,300.00)$ (1,852,828.00)$ (1,394,548.98)$ (913,376.50)$ (408,170.13)$ 122,267.17$ 679,191.92$ 1,263,923.02$ 1,877,844.85$ 2,522,410.52$ 3,199,145.24$ 3,909,649.92$ 4,655,604.93$ 5,438,773.97$
Tax paid (35%) (26,250,000.00)$ 946,750.00$ 801,255.00$ 648,489.80$ 488,092.14$ 319,681.77$ 142,859.55$ (42,793.51)$ (237,717.17)$ (442,373.06)$ (657,245.70)$ (882,843.68)$ (1,119,700.83)$ (1,368,377.47)$ (1,629,461.73)$ (1,903,570.89)$
Income after tax 48,750,000.00$ (1,758,250.00)$ (1,488,045.00)$ (1,204,338.20)$ (906,456.84)$ (593,694.72)$ (265,310.59)$ 79,473.66$ 441,474.75$ 821,549.96$ 1,220,599.15$ 1,639,566.84$ 2,079,444.40$ 2,541,272.45$ 3,026,143.21$ 3,535,203.08$
Profit/Loss statement
Year 16 17 18 19 20 21 22 23 24 25
Incremental cash revenue 12,670,889.52$ 13,554,434.00$ 14,482,155.70$ 15,456,263.49$ 16,479,076.66$ 17,553,030.49$ 18,680,682.02$ 19,864,716.12$ 21,107,951.93$ 22,413,349.52$
Gain/loss on Sale 180,000,000.00$
Incremenatal costs for maintenance (611,122.34)$ (647,789.68)$ (686,657.06)$ (727,856.48)$ (771,527.87)$ (817,819.55)$ (866,888.72)$ (918,902.04)$ (974,036.16)$ (1,032,478.33)$
Incremental wage cost 201,241.04$ 217,606.40$ 235,042.15$ 253,611.91$ 273,382.87$ 294,425.98$ 316,816.21$ 340,632.71$ 365,959.06$ 392,883.52$
Depreciation cost (6,000,000.00)$ (6,000,000.00)$ (6,000,000.00)$ (6,000,000.00)$ (6,000,000.00)$ (6,000,000.00)$ (6,000,000.00)$ (6,000,000.00)$ (6,000,000.00)$ (6,000,000.00)$
Taxable income 6,261,008.23$ 7,124,250.72$ 8,030,540.79$ 8,982,018.92$ 9,980,931.65$ 11,029,636.93$ 12,130,609.51$ 13,286,446.79$ 14,499,874.82$ 195,773,754.71$
Tax paid (35%) (2,191,352.88)$ (2,493,487.75)$ (2,810,689.28)$ (3,143,706.62)$ (3,493,326.08)$ (3,860,372.93)$ (4,245,713.33)$ (4,650,256.38)$ (5,074,956.19)$ (68,520,814.15)$
Income after tax 4,069,655.35$ 4,630,762.97$ 5,219,851.52$ 5,838,312.30$ 6,487,605.58$ 7,169,264.00$ 7,884,896.18$ 8,636,190.41$ 9,424,918.64$ 127,252,940.56$
Table 11. Profit and Loss statement of Da Nang investment.
8
Cash flow statement
Year 0 1 2 3 4 5 6 7 8 9 10 11 12 13 14
Tax paid (35%) (26,250,000.00)$ 946,750.00$ 801,255.00$ 648,489.80$ 488,092.14$ 319,681.77$ 142,859.55$ (42,793.51)$ (237,717.17)$ (442,373.06)$ (657,245.70)$ (882,843.68)$ (1,119,700.83)$ (1,368,377.47)$ (1,629,461.73)$
Incremental cash revenue 3,500,000.00$ 3,925,000.00$ 4,371,250.00$ 4,839,812.50$ 5,331,803.13$ 5,848,393.28$ 6,390,812.95$ 6,960,353.59$ 7,558,371.27$ 8,186,289.84$ 8,845,604.33$ 9,537,884.54$ 10,264,778.77$ 11,028,017.71$
Incremental costs for maintenance (255,000.00)$ (270,300.00)$ (286,518.00)$ (303,709.08)$ (321,931.62)$ (341,247.52)$ (361,722.37)$ (383,425.72)$ (406,431.26)$ (430,817.13)$ (456,666.16)$ (484,066.13)$ (513,110.10)$ (543,896.71)$
Incremental wage cost 50,000.00$ 56,000.00$ 62,440.00$ 69,347.60$ 76,752.00$ 84,684.11$ 93,176.60$ 102,264.05$ 111,983.01$ 122,372.15$ 133,472.35$ 145,326.82$ 157,981.25$ 171,483.93$
Salvage value 80,000,000.00$
Initial Outlay (150,500,000.00)$
Working capital (2,000,000.00)$
Net cash flows (98,750,000.00)$ 4,241,750.00$ 4,511,955.00$ 4,795,661.80$ 5,093,543.16$ 5,406,305.28$ 5,734,689.41$ 6,079,473.66$ 6,441,474.75$ 6,821,549.96$ 7,220,599.15$ 7,639,566.84$ 8,079,444.40$ 8,541,272.45$ 9,026,143.21$
Cash flow statement
Year 15 16 17 18 19 20 21 22 23 24 25
Tax paid (35%) (1,903,570.89)$ (2,191,352.88)$ (2,493,487.75)$ (2,810,689.28)$ (3,143,706.62)$ (3,493,326.08)$ (3,860,372.93)$ (4,245,713.33)$ (4,650,256.38)$ (5,074,956.19)$ (68,520,814.15)$
Incremental cash revenue 11,829,418.60$ 12,670,889.52$ 13,554,434.00$ 14,482,155.70$ 15,456,263.49$ 16,479,076.66$ 17,553,030.49$ 18,680,682.02$ 19,864,716.12$ 21,107,951.93$ 22,413,349.52$
Incremental costs for maintenance (576,530.51)$ (611,122.34)$ (647,789.68)$ (686,657.06)$ (727,856.48)$ (771,527.87)$ (817,819.55)$ (866,888.72)$ (918,902.04)$ (974,036.16)$ (1,032,478.33)$
Incremental wage cost 185,885.88$ 201,241.04$ 217,606.40$ 235,042.15$ 253,611.91$ 273,382.87$ 294,425.98$ 316,816.21$ 340,632.71$ 365,959.06$ 392,883.52$
Salvage value 180,000,000.00$
Initial Outlay
Working capital 2,000,000.00$
Net cash flows 9,535,203.08$ 10,069,655.35$ 10,630,762.97$ 11,219,851.52$ 11,838,312.30$ 12,487,605.58$ 13,169,264.00$ 13,884,896.18$ 14,636,190.41$ 15,424,918.64$ 135,252,940.56$
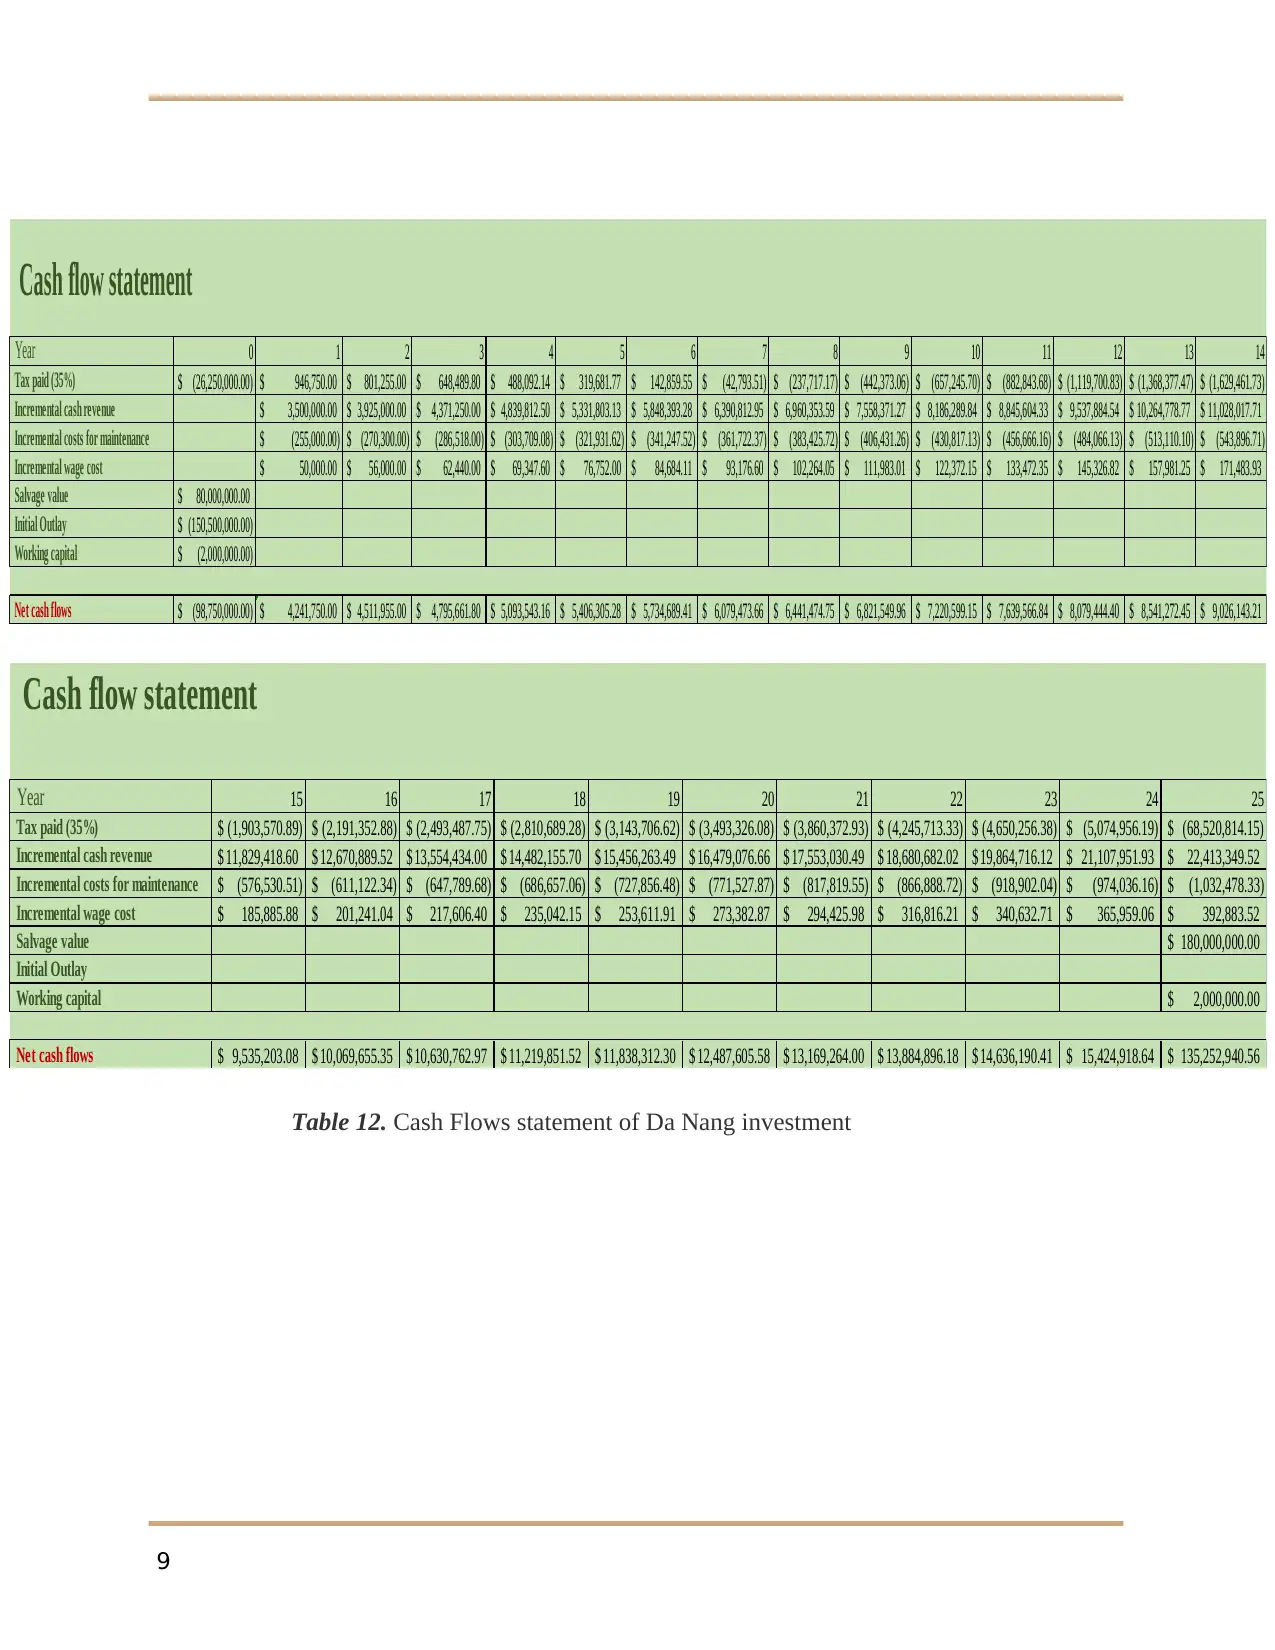
Table 12. Cash Flows statement of Da Nang investment
9
Year 0 1 2 3 4 5 6 7 8 9 10 11 12 13 14
Tax paid (35%) (26,250,000.00)$ 946,750.00$ 801,255.00$ 648,489.80$ 488,092.14$ 319,681.77$ 142,859.55$ (42,793.51)$ (237,717.17)$ (442,373.06)$ (657,245.70)$ (882,843.68)$ (1,119,700.83)$ (1,368,377.47)$ (1,629,461.73)$
Incremental cash revenue 3,500,000.00$ 3,925,000.00$ 4,371,250.00$ 4,839,812.50$ 5,331,803.13$ 5,848,393.28$ 6,390,812.95$ 6,960,353.59$ 7,558,371.27$ 8,186,289.84$ 8,845,604.33$ 9,537,884.54$ 10,264,778.77$ 11,028,017.71$
Incremental costs for maintenance (255,000.00)$ (270,300.00)$ (286,518.00)$ (303,709.08)$ (321,931.62)$ (341,247.52)$ (361,722.37)$ (383,425.72)$ (406,431.26)$ (430,817.13)$ (456,666.16)$ (484,066.13)$ (513,110.10)$ (543,896.71)$
Incremental wage cost 50,000.00$ 56,000.00$ 62,440.00$ 69,347.60$ 76,752.00$ 84,684.11$ 93,176.60$ 102,264.05$ 111,983.01$ 122,372.15$ 133,472.35$ 145,326.82$ 157,981.25$ 171,483.93$
Salvage value 80,000,000.00$
Initial Outlay (150,500,000.00)$
Working capital (2,000,000.00)$
Net cash flows (98,750,000.00)$ 4,241,750.00$ 4,511,955.00$ 4,795,661.80$ 5,093,543.16$ 5,406,305.28$ 5,734,689.41$ 6,079,473.66$ 6,441,474.75$ 6,821,549.96$ 7,220,599.15$ 7,639,566.84$ 8,079,444.40$ 8,541,272.45$ 9,026,143.21$
Cash flow statement
Year 15 16 17 18 19 20 21 22 23 24 25
Tax paid (35%) (1,903,570.89)$ (2,191,352.88)$ (2,493,487.75)$ (2,810,689.28)$ (3,143,706.62)$ (3,493,326.08)$ (3,860,372.93)$ (4,245,713.33)$ (4,650,256.38)$ (5,074,956.19)$ (68,520,814.15)$
Incremental cash revenue 11,829,418.60$ 12,670,889.52$ 13,554,434.00$ 14,482,155.70$ 15,456,263.49$ 16,479,076.66$ 17,553,030.49$ 18,680,682.02$ 19,864,716.12$ 21,107,951.93$ 22,413,349.52$
Incremental costs for maintenance (576,530.51)$ (611,122.34)$ (647,789.68)$ (686,657.06)$ (727,856.48)$ (771,527.87)$ (817,819.55)$ (866,888.72)$ (918,902.04)$ (974,036.16)$ (1,032,478.33)$
Incremental wage cost 185,885.88$ 201,241.04$ 217,606.40$ 235,042.15$ 253,611.91$ 273,382.87$ 294,425.98$ 316,816.21$ 340,632.71$ 365,959.06$ 392,883.52$
Salvage value 180,000,000.00$
Initial Outlay
Working capital 2,000,000.00$
Net cash flows 9,535,203.08$ 10,069,655.35$ 10,630,762.97$ 11,219,851.52$ 11,838,312.30$ 12,487,605.58$ 13,169,264.00$ 13,884,896.18$ 14,636,190.41$ 15,424,918.64$ 135,252,940.56$
Table 12. Cash Flows statement of Da Nang investment
9
⊘ This is a preview!⊘
Do you want full access?
Subscribe today to unlock all pages.
Trusted by 1+ million students worldwide
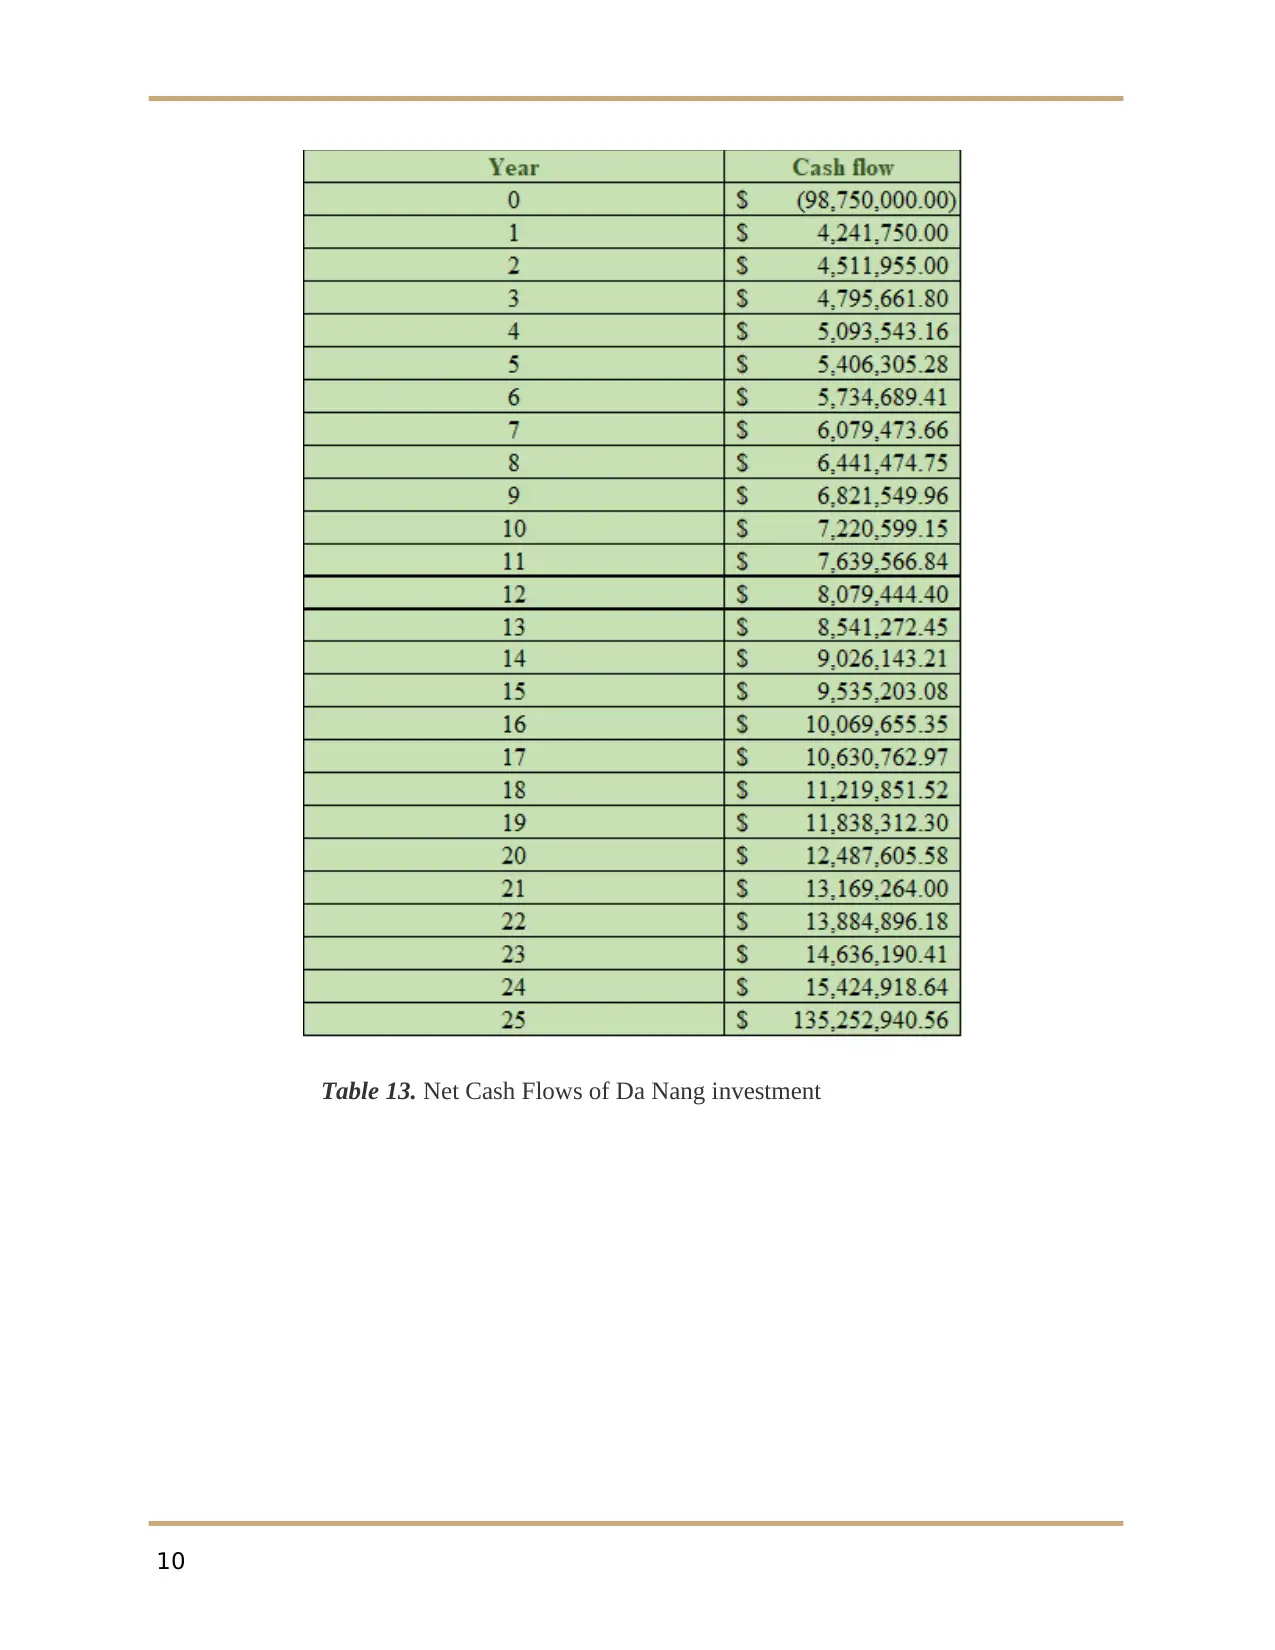
Table 13. Net Cash Flows of Da Nang investment
10
10
Paraphrase This Document
Need a fresh take? Get an instant paraphrase of this document with our AI Paraphraser
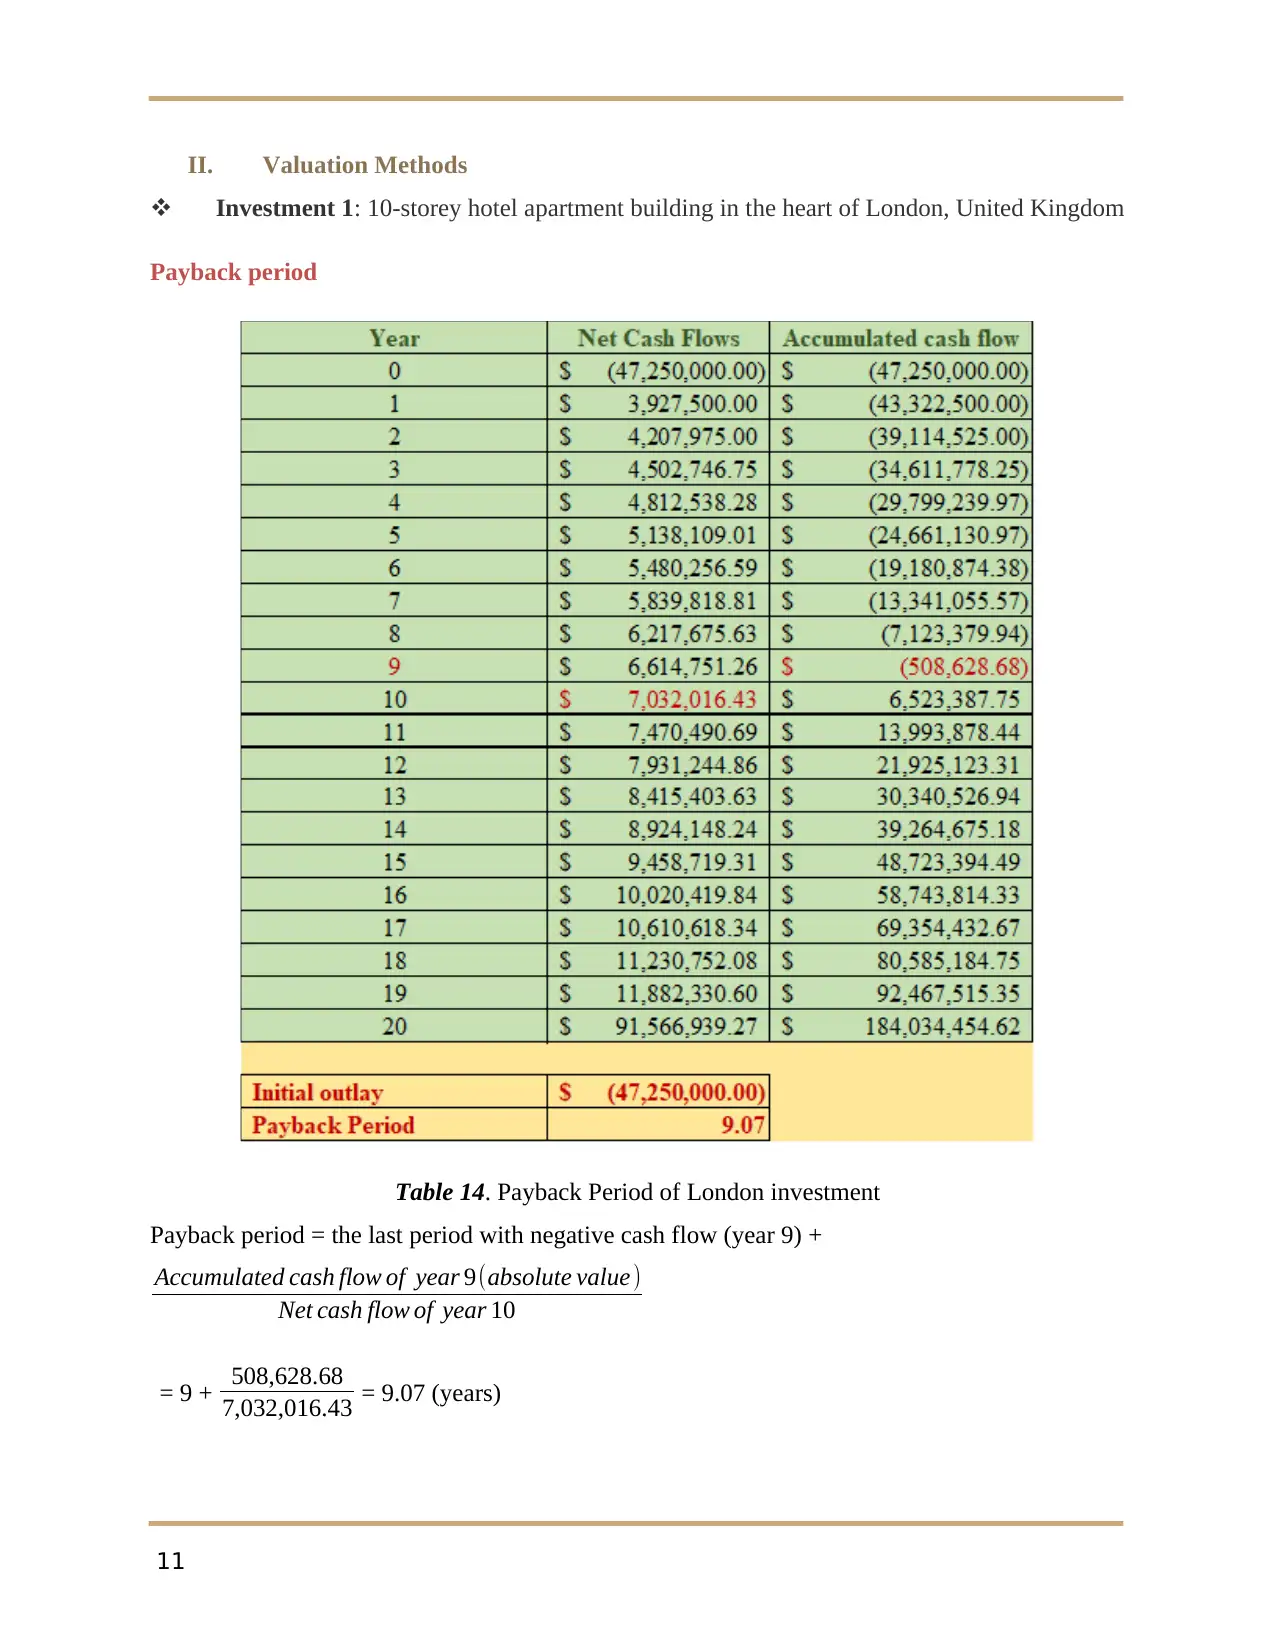
II. Valuation Methods
Investment 1: 10-storey hotel apartment building in the heart of London, United Kingdom
Payback period
Table 14. Payback Period of London investment
Payback period = the last period with negative cash flow (year 9) +
Accumulated cash flow of year 9(absolute value)
Net cash flow of year 10
= 9 + 508,628.68
7,032,016.43 = 9.07 (years)
11
Year Net Cash Flows Accumulated cash flow
0 (47,250,000.00)$ (47,250,000.00)$
1 3,927,500.00$ (43,322,500.00)$
2 4,207,975.00$ (39,114,525.00)$
3 4,502,746.75$ (34,611,778.25)$
4 4,812,538.28$ (29,799,239.97)$
5 5,138,109.01$ (24,661,130.97)$
6 5,480,256.59$ (19,180,874.38)$
7 5,839,818.81$ (13,341,055.57)$
8 6,217,675.63$ (7,123,379.94)$
9 6,614,751.26$ (508,628.68)$
10 7,032,016.43$ 6,523,387.75$
11 7,470,490.69$ 13,993,878.44$
12 7,931,244.86$ 21,925,123.31$
13 8,415,403.63$ 30,340,526.94$
14 8,924,148.24$ 39,264,675.18$
15 9,458,719.31$ 48,723,394.49$
16 10,020,419.84$ 58,743,814.33$
17 10,610,618.34$ 69,354,432.67$
18 11,230,752.08$ 80,585,184.75$
19 11,882,330.60$ 92,467,515.35$
20 91,566,939.27$ 184,034,454.62$
Initial outlay (47,250,000.00)$
Required rate of return 13%
Payback Period 9.07
Net Present Value 1,831,832.51$
Internal rate of return 13.4%
EAA 260,768.30$
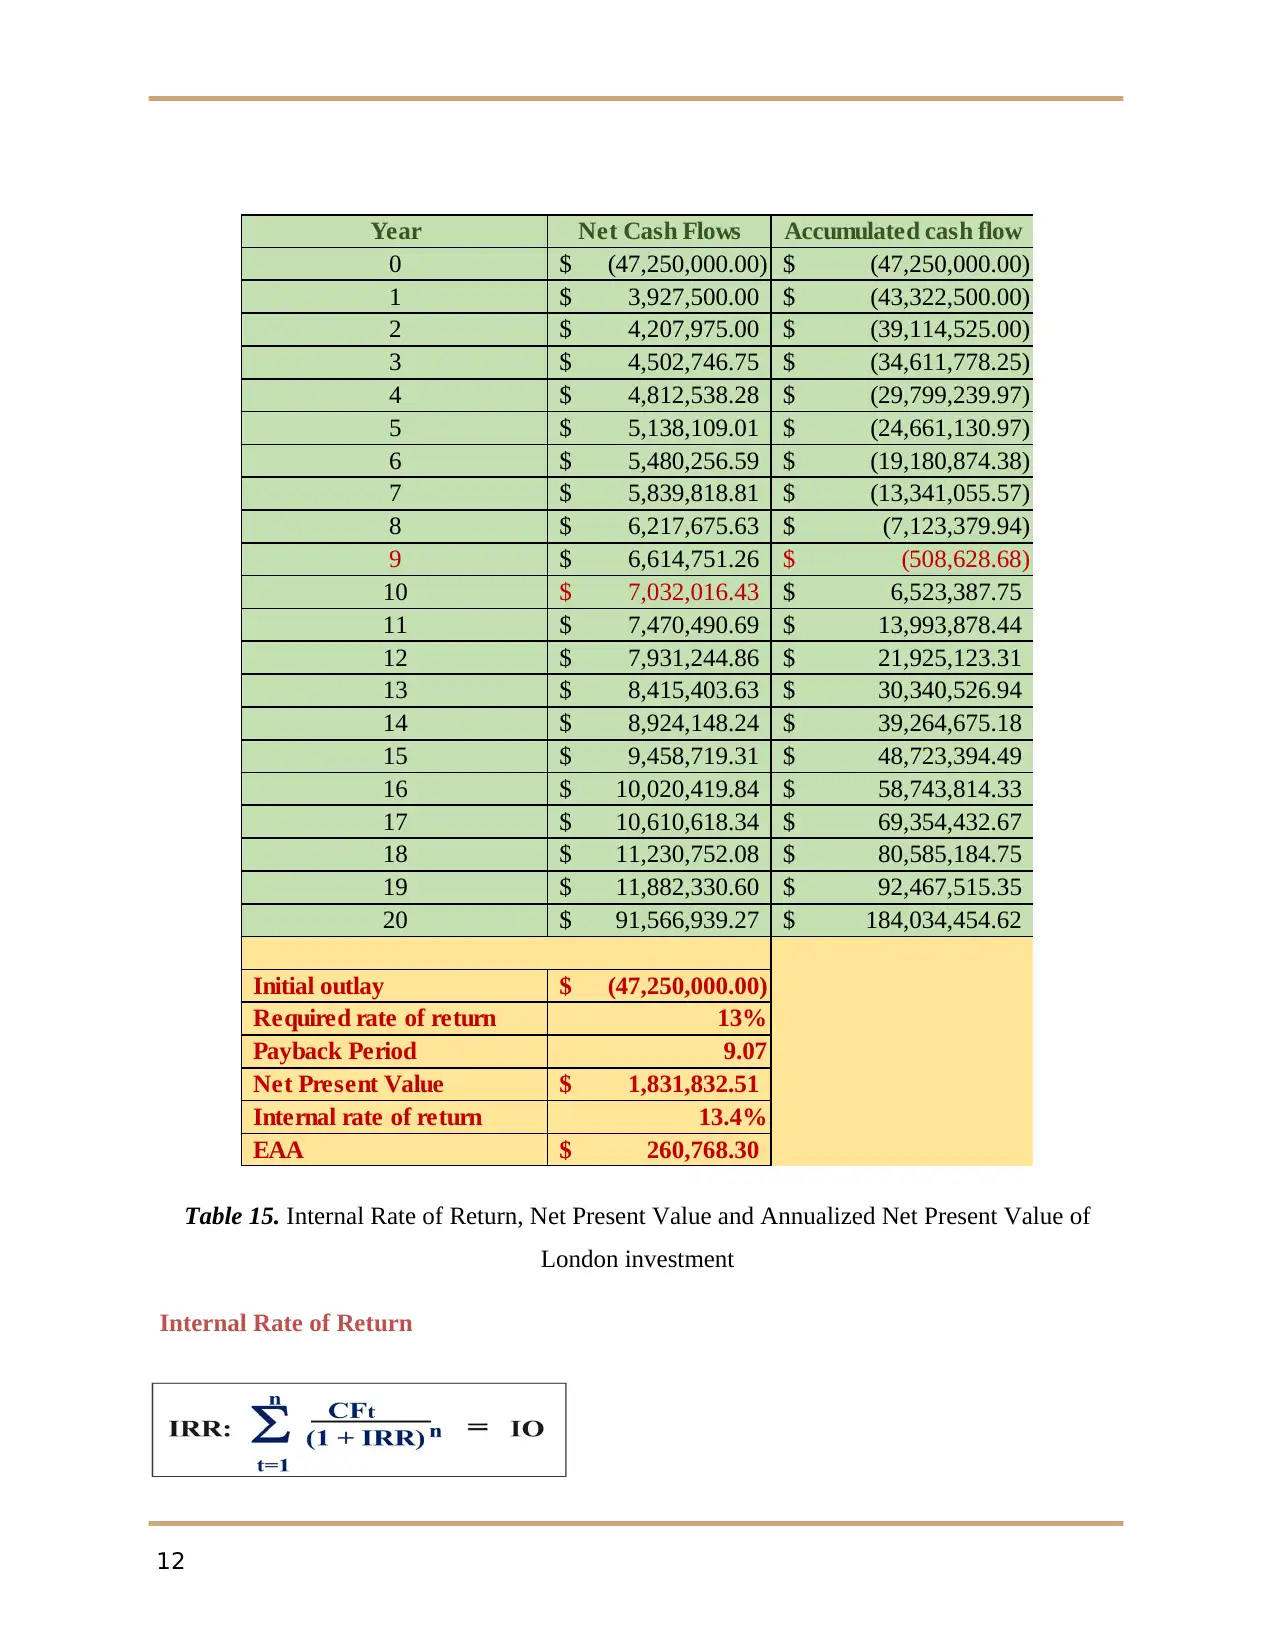
Table 15. Internal Rate of Return, Net Present Value and Annualized Net Present Value of
London investment
Internal Rate of Return
12
0 (47,250,000.00)$ (47,250,000.00)$
1 3,927,500.00$ (43,322,500.00)$
2 4,207,975.00$ (39,114,525.00)$
3 4,502,746.75$ (34,611,778.25)$
4 4,812,538.28$ (29,799,239.97)$
5 5,138,109.01$ (24,661,130.97)$
6 5,480,256.59$ (19,180,874.38)$
7 5,839,818.81$ (13,341,055.57)$
8 6,217,675.63$ (7,123,379.94)$
9 6,614,751.26$ (508,628.68)$
10 7,032,016.43$ 6,523,387.75$
11 7,470,490.69$ 13,993,878.44$
12 7,931,244.86$ 21,925,123.31$
13 8,415,403.63$ 30,340,526.94$
14 8,924,148.24$ 39,264,675.18$
15 9,458,719.31$ 48,723,394.49$
16 10,020,419.84$ 58,743,814.33$
17 10,610,618.34$ 69,354,432.67$
18 11,230,752.08$ 80,585,184.75$
19 11,882,330.60$ 92,467,515.35$
20 91,566,939.27$ 184,034,454.62$
Initial outlay (47,250,000.00)$
Required rate of return 13%
Payback Period 9.07
Net Present Value 1,831,832.51$
Internal rate of return 13.4%
EAA 260,768.30$
Table 15. Internal Rate of Return, Net Present Value and Annualized Net Present Value of
London investment
Internal Rate of Return
12
⊘ This is a preview!⊘
Do you want full access?
Subscribe today to unlock all pages.
Trusted by 1+ million students worldwide
1 out of 23
Related Documents


Your All-in-One AI-Powered Toolkit for Academic Success.
+13062052269
info@desklib.com
Available 24*7 on WhatsApp / Email
![[object Object]](/_next/static/media/star-bottom.7253800d.svg)
Unlock your academic potential
Copyright © 2020–2026 A2Z Services. All Rights Reserved. Developed and managed by ZUCOL.