Investment Decisions, Performance Indicators and Pricing Strategies

Verified

Added on  2023/06/18

|16
|2511
|203
Report
AI Summary
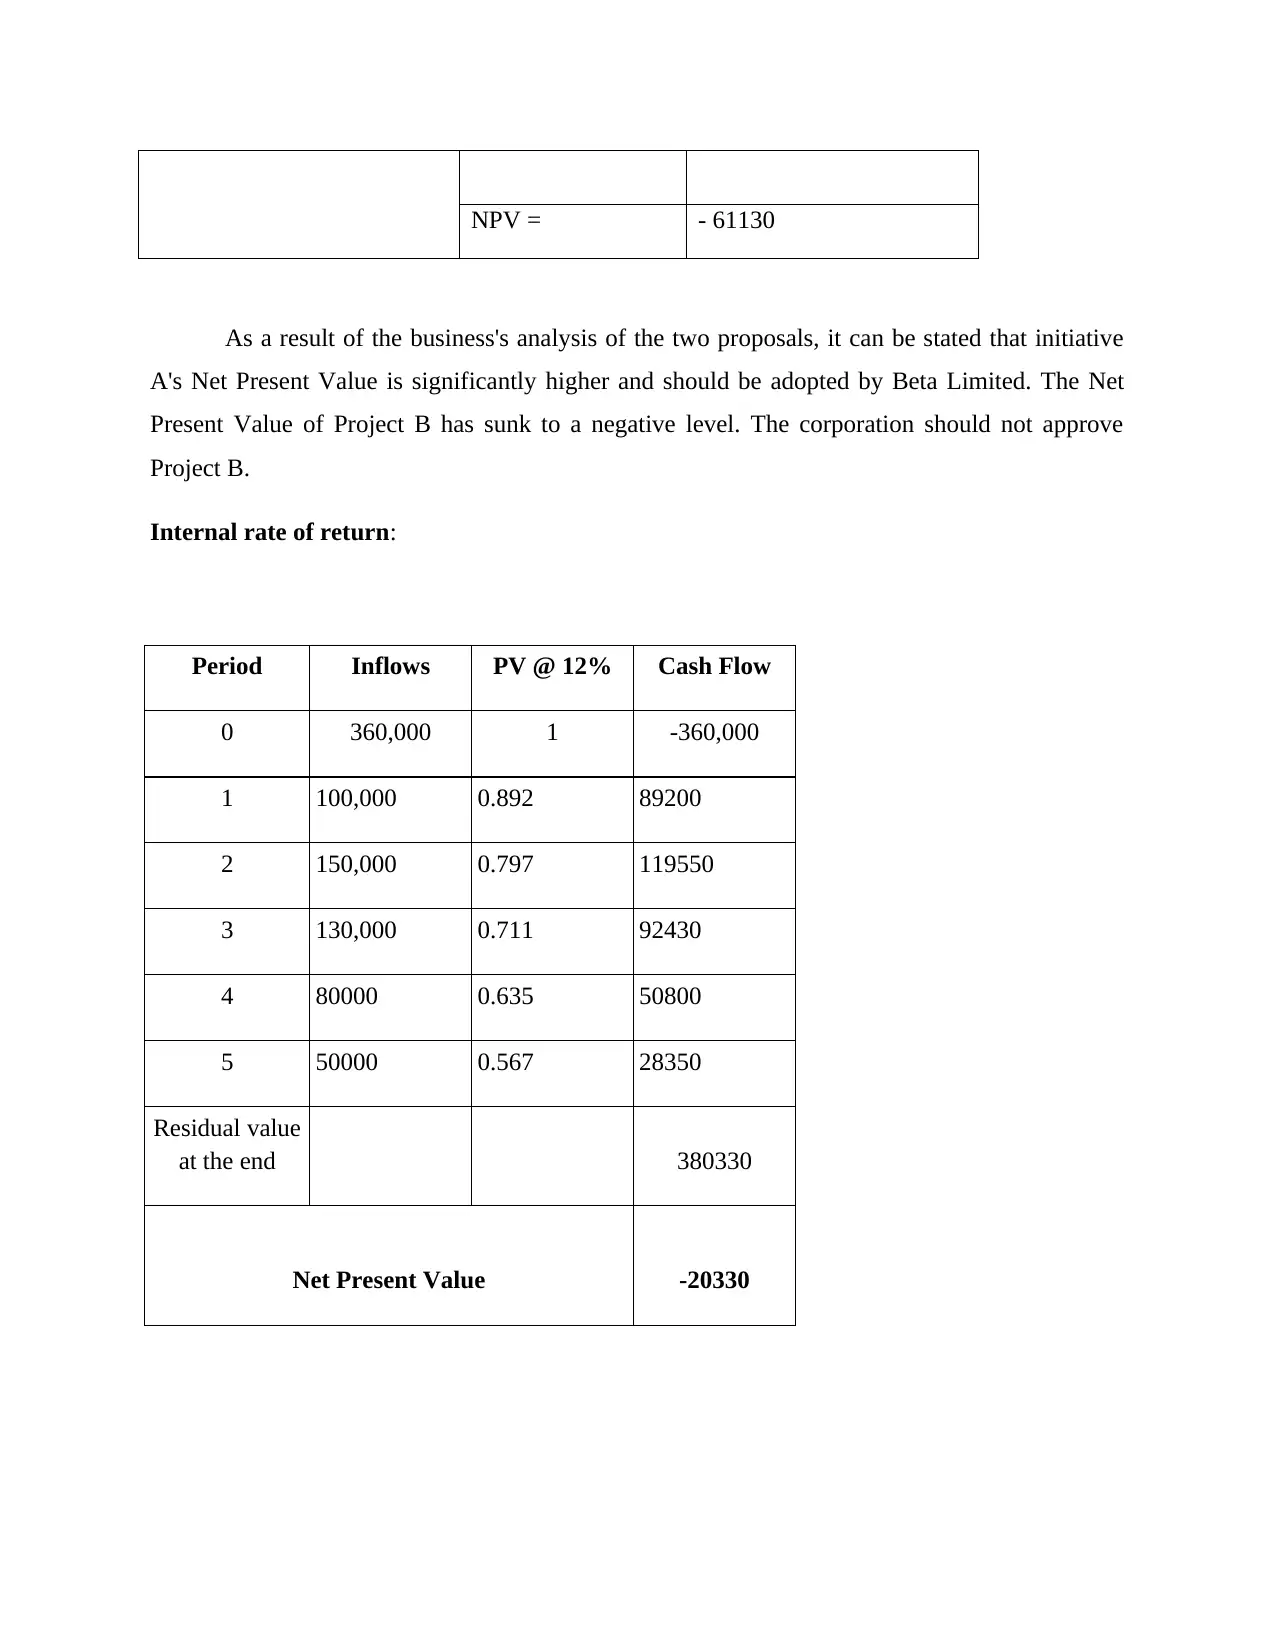
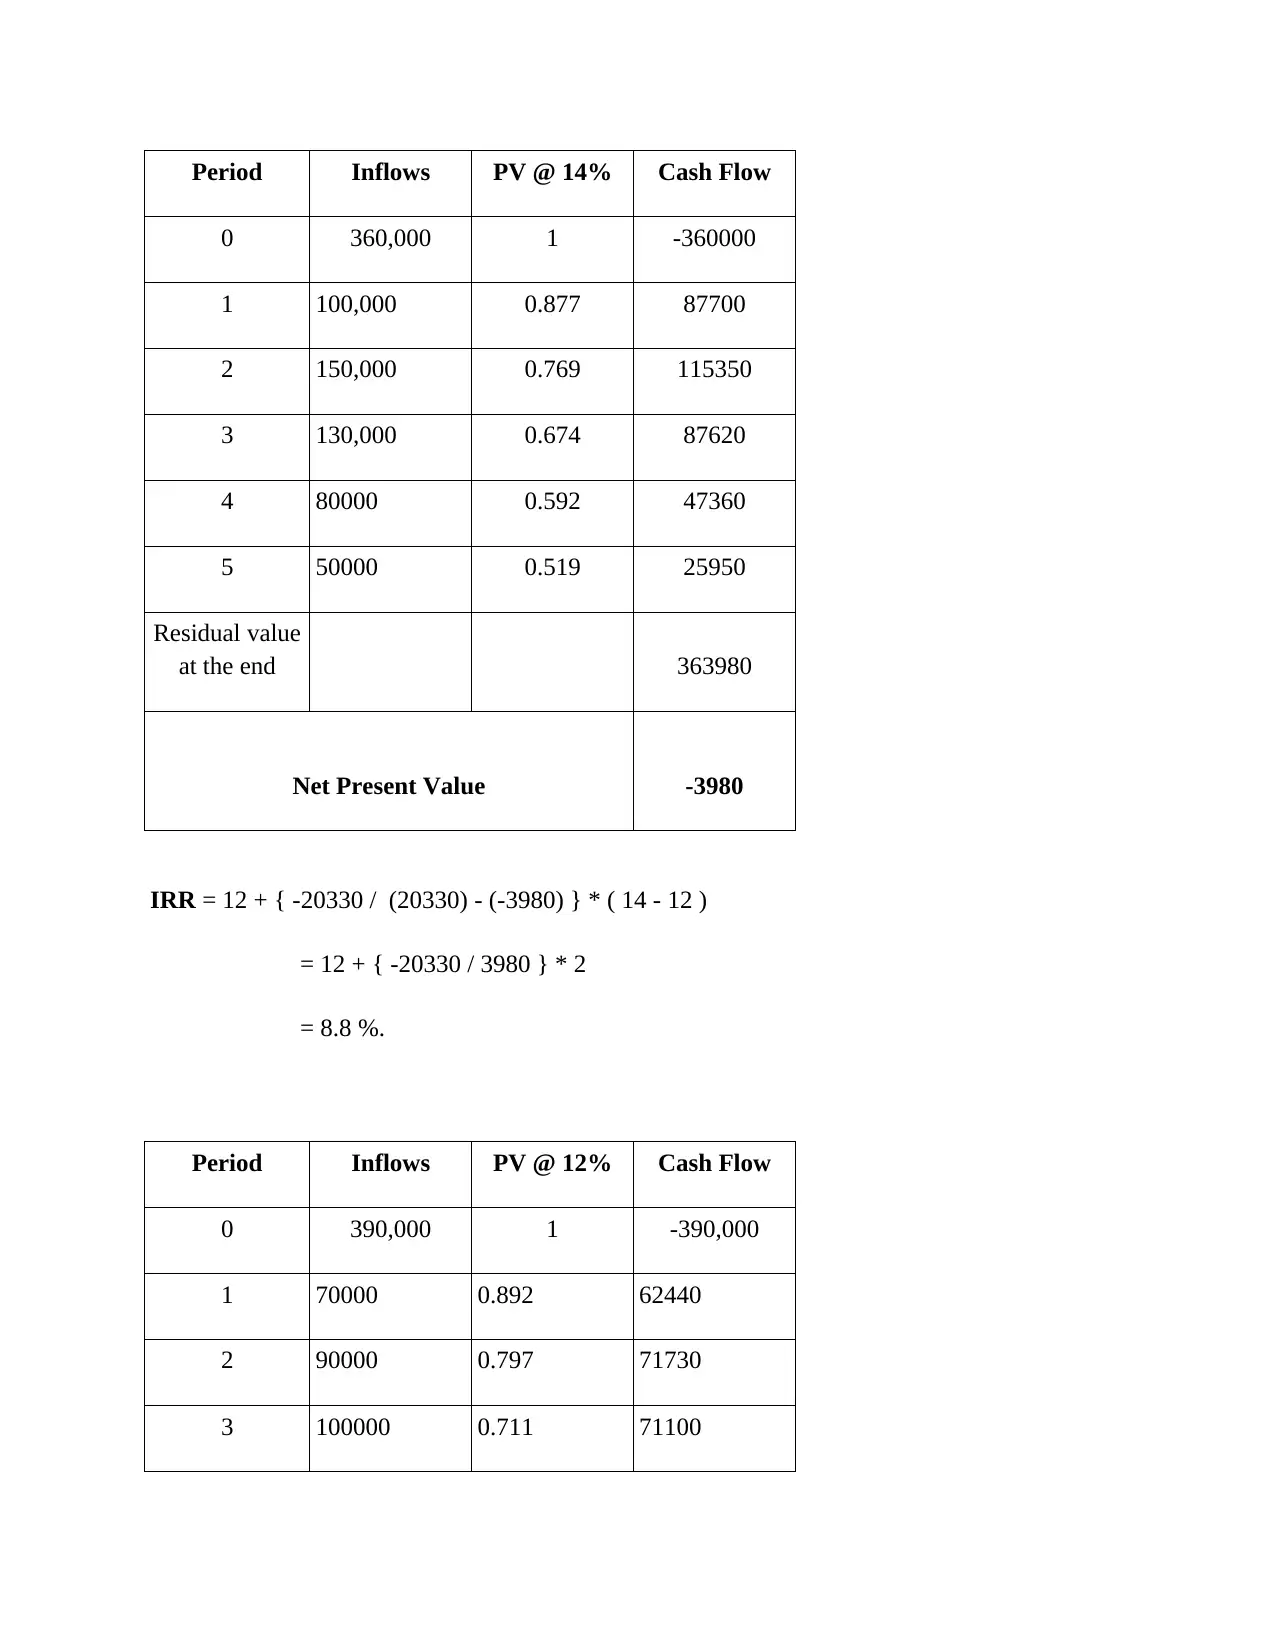
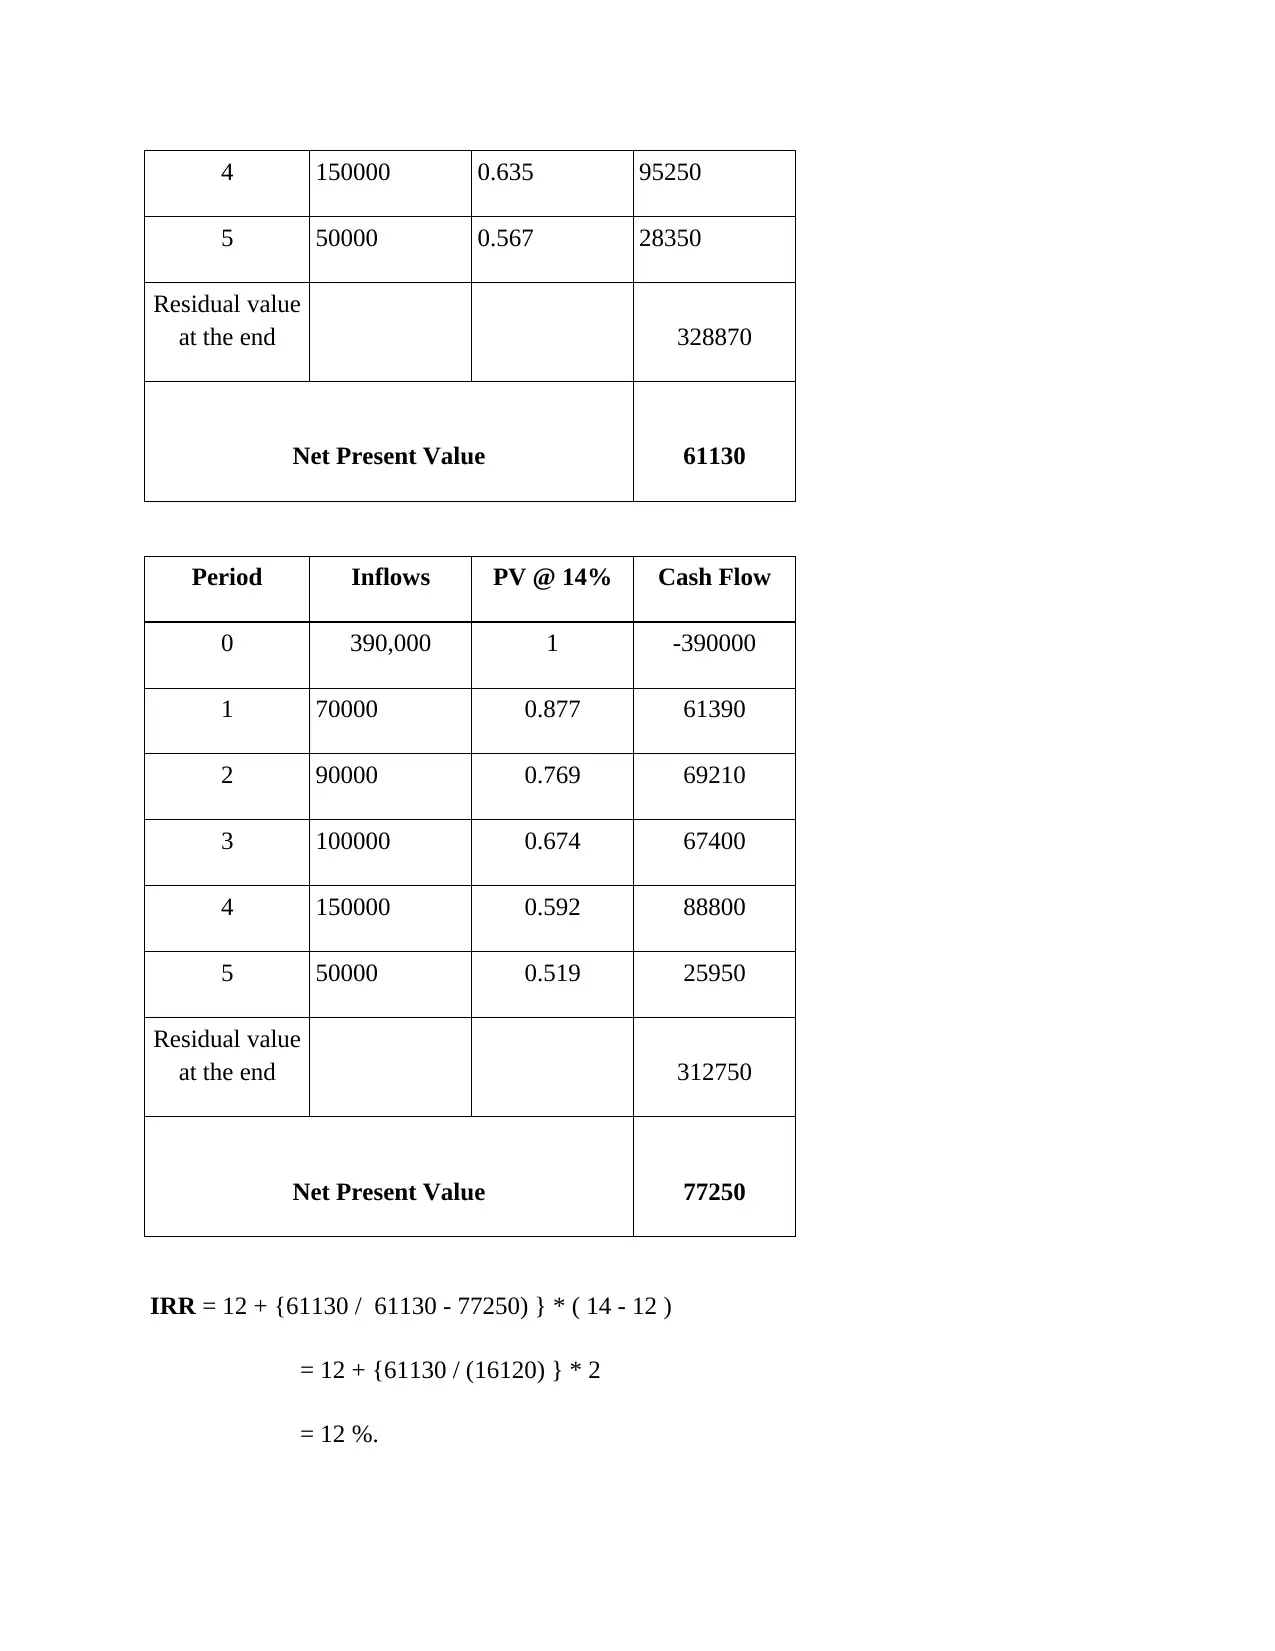
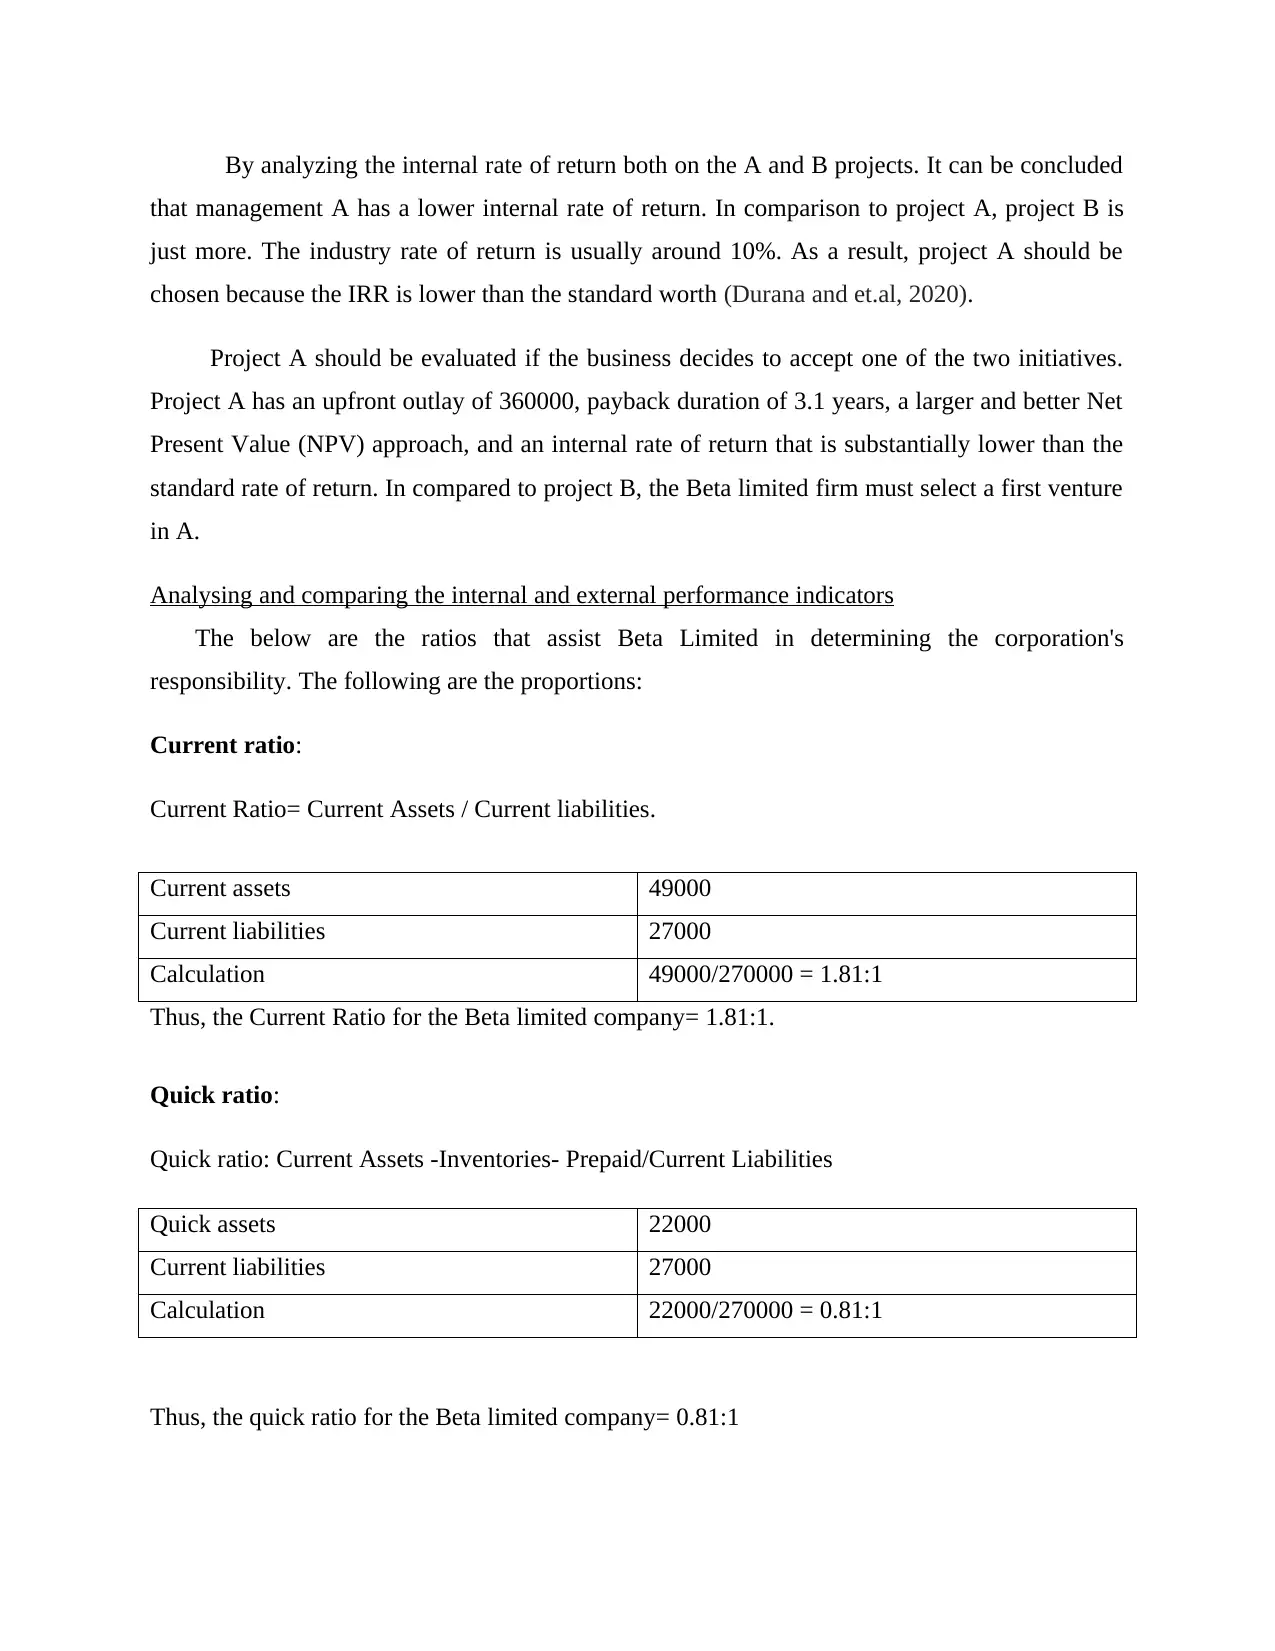
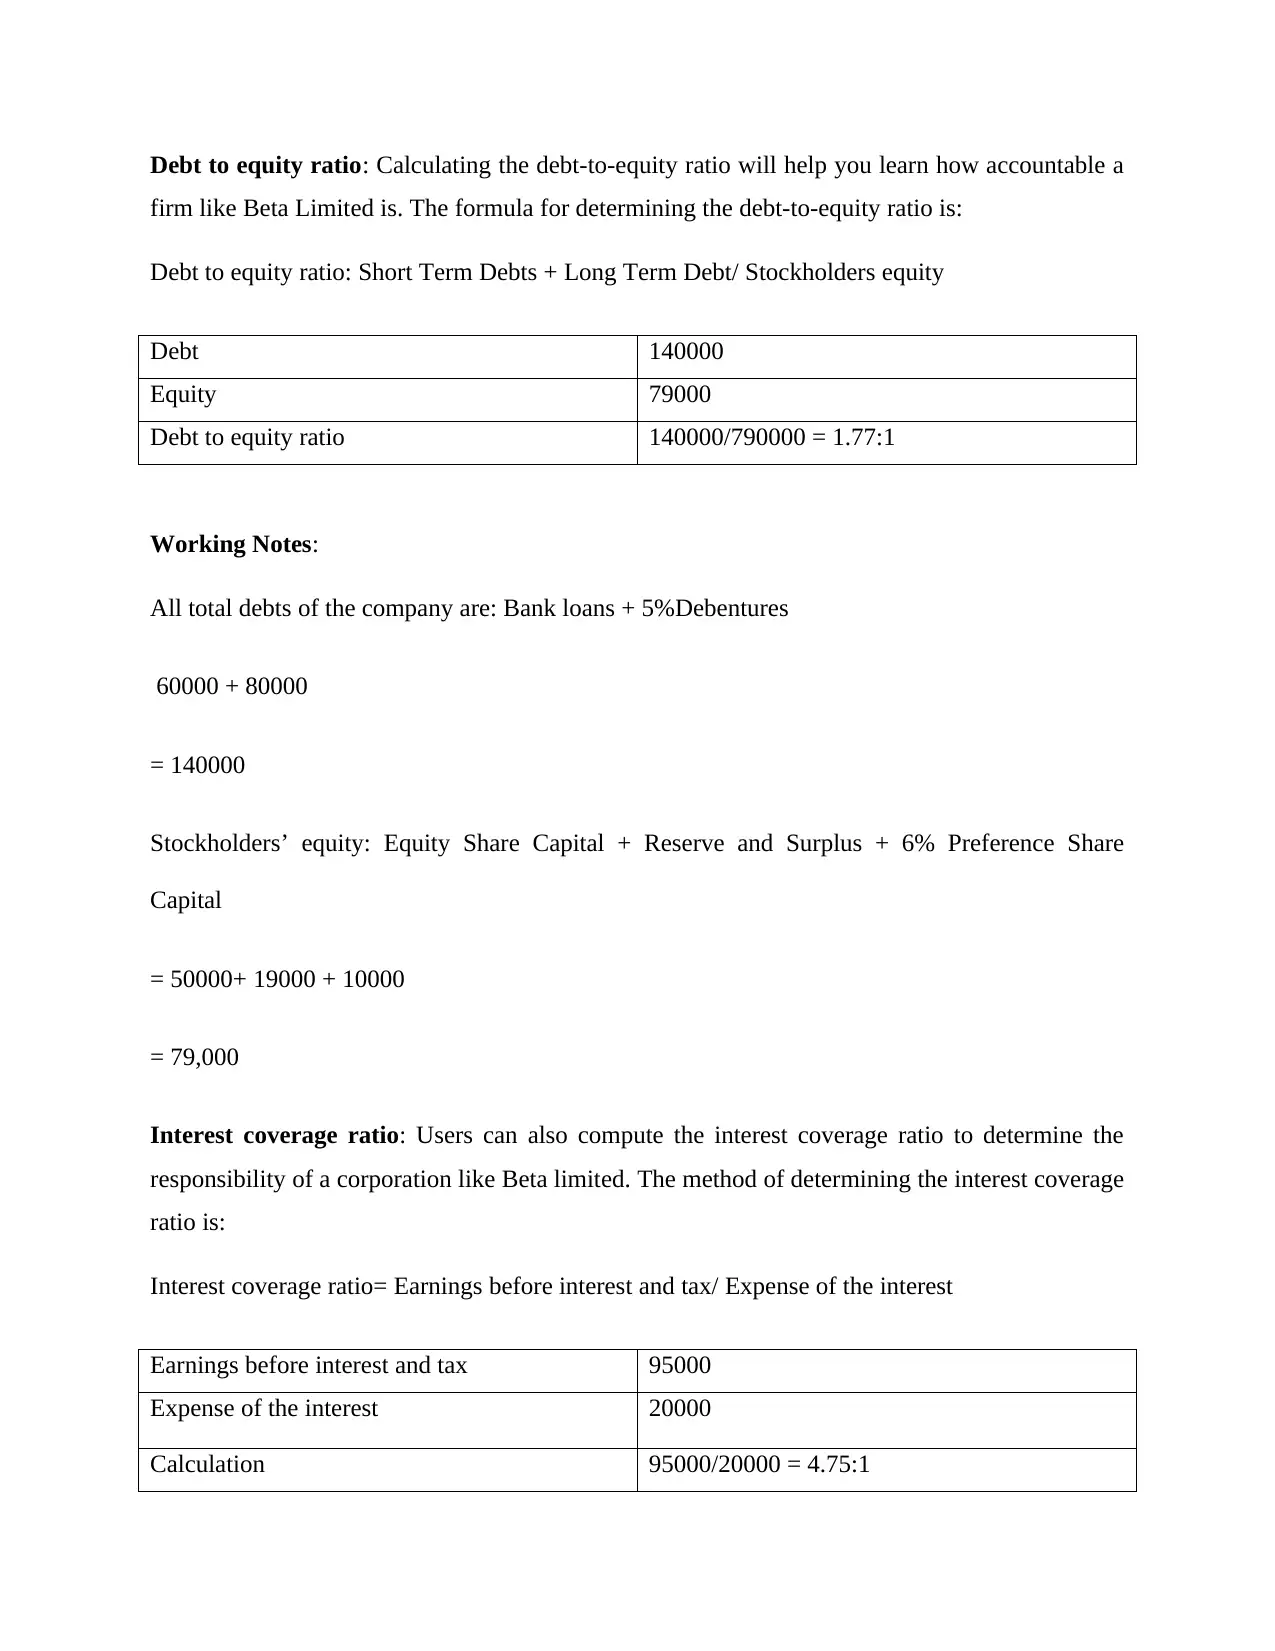
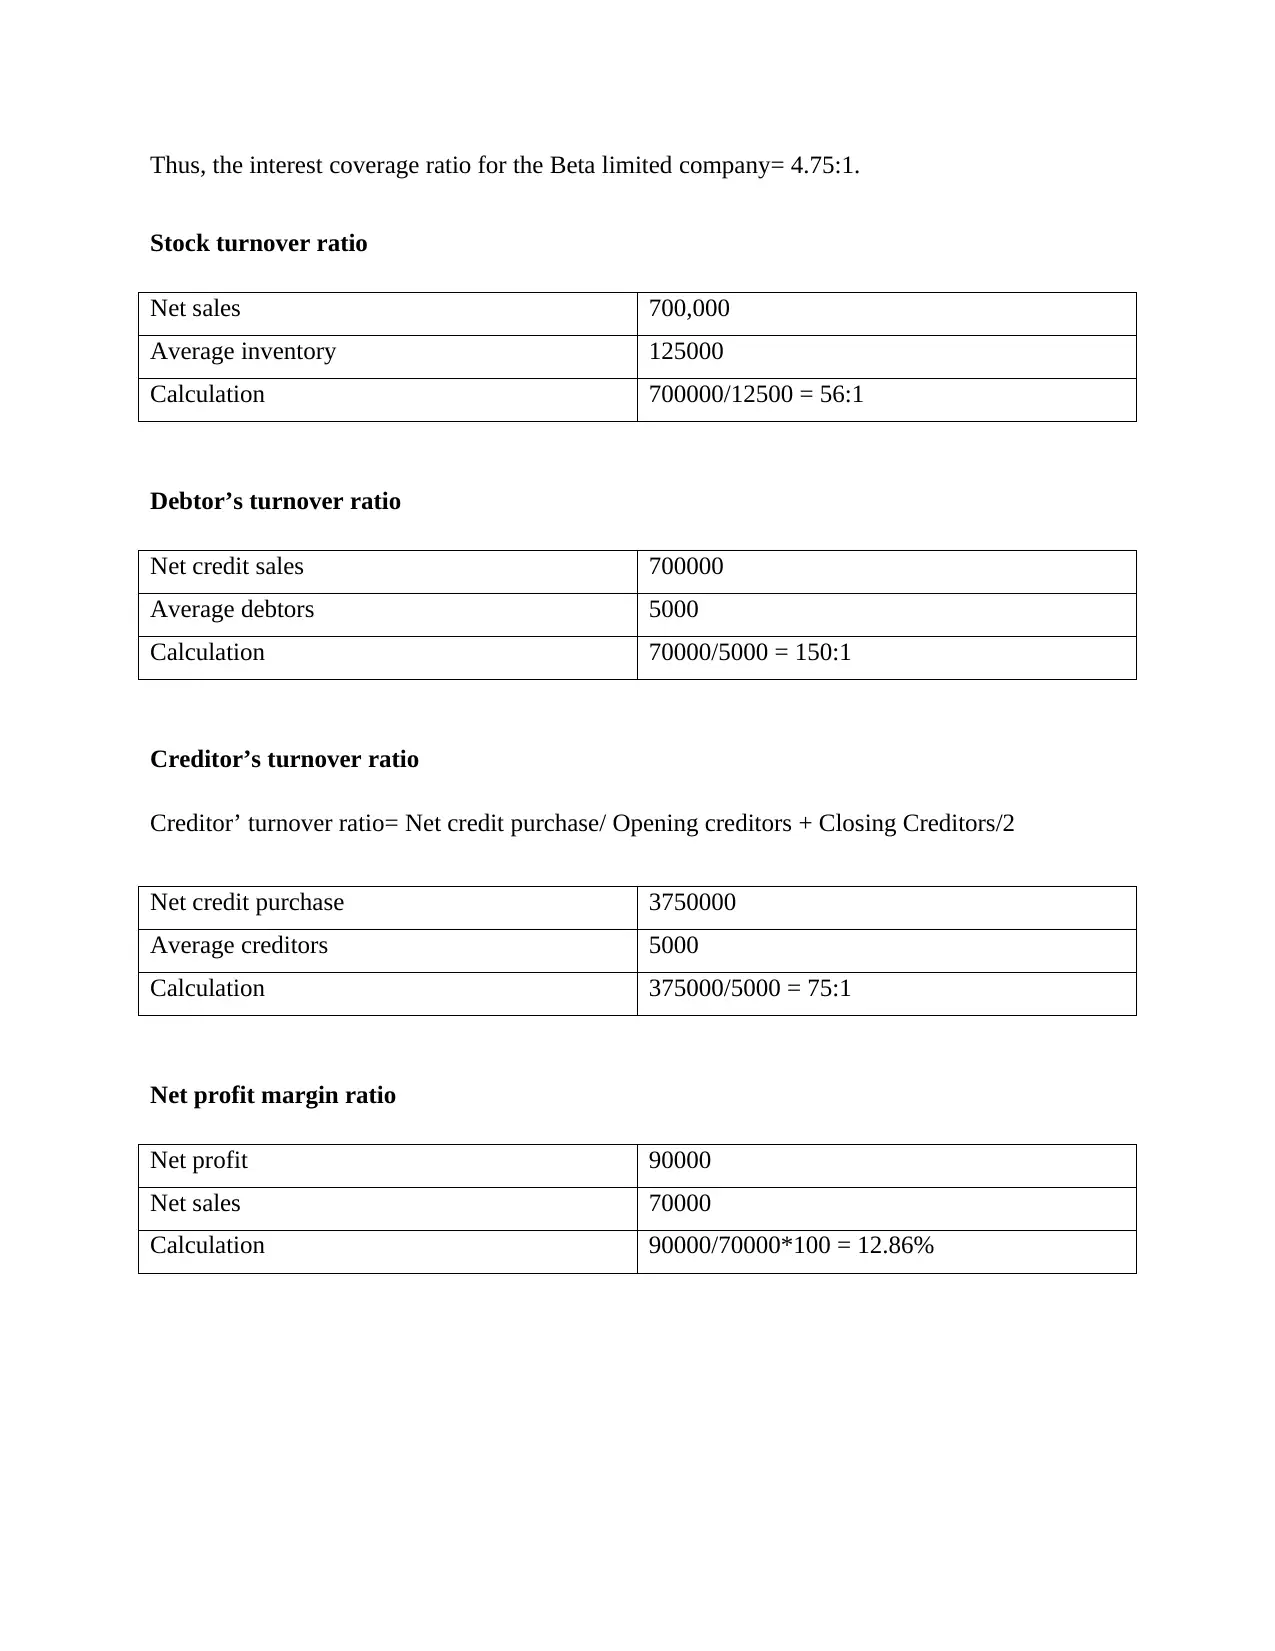
This report provides a comprehensive analysis of business finance, focusing on capital investment decisions and performance indicators. It begins by evaluating investment opportunities using methods such as the payback period, net present value (NPV), and internal rate of return (IRR) to determine the most profitable project for Beta Limited, recommending Project A based on its superior NPV and IRR. The report then delves into analyzing and comparing internal and external performance indicators through financial ratios like current ratio, quick ratio, debt-to-equity ratio, and interest coverage ratio, assessing Beta Limited's financial health and operational efficiency. External factors influencing Beta Limited's performance, such as credit facility and target audience, are also discussed alongside internal factors like resources and capabilities. Finally, the report explores different pricing strategies, including cost-plus pricing, value pricing, and penetration pricing, providing a holistic view of financial decision-making in a business context.
Document Page
BUSINESS FINANCE
(Assessment – 2)
tabler-icon-diamond-filled.svg

Paraphrase This Document

Need a fresh take? Get an instant paraphrase of this document with our AI Paraphraser
Document Page
Document Page
Contents
INTRODUCTION...........................................................................................................................................3
MAIN BODY.................................................................................................................................................3
Capital investment decision.....................................................................................................................3
Analysing and comparing the internal and external performance indicators..........................................9
CONCLUSION.............................................................................................................................................13
REFERENCES..............................................................................................................................................15
Document Page
INTRODUCTION
Business finance refers to the funds necessary to implement retail operations. Mostly every
company activity necessitates some form of funding. Business finance is a broad phrase that
refers to a variety of operations and specialties centered on the utilization of resources and other
tangible resources. It's a broad phrase that refers to a variety of operations and specializations
centered on the liquidity management and some other tangible assets. To start a firm, run it,
modernize it, increase it, or broaden it (Althnian, 2021). It is necessary for the purchase of a wide
range of assets, both visible and immaterial, such as technology, companies, structures, and
workplaces. In this report consist of investment techniques like Payback period, IRR and NPV to
analysis in which project invest for good return. Along with compare internal as well as external
performance indicators and discuss various types of pricing strategies.
MAIN BODY
Capital investment decision
The payback period:
Project 1
Year Net Cash flows Cumulative cash flows
1 100,000 100,000
2 150,000 250,000
3 130,000 380,000
4 80000 460,000
5 50000 510,000
Initial Investment 360,000
Payback period = 2 years + [(360000 - 250000) / 130000 * 12
months
2 Years + (110,000 / 130000) * 12 months
2 years + (0.846 * 12 months)
tabler-icon-diamond-filled.svg

Paraphrase This Document

Need a fresh take? Get an instant paraphrase of this document with our AI Paraphraser
Document Page
2 years + 10.15 months
Project 2
Year Net Cash flows Cumulative cash flows
1 70000 70000
2 90000 160000
3 100000 260000
4 150000 410000
5 50000 460000
Initial Investment 390000
Payback period = 3 years + [(390000 - 260000) / 150000 * 12
months
3 Years + (130000 / 150000) * 12 months
3 years + (0.867 * 12 months)
3 years + 10.40 months
As per the analysis of both projects it is suggested that invest into project 1 because it
provides return in 2 years 1 month and project 2 returns in 3 years 9 months.
Net present value: The DCF assessment' net present value (NPV) tool calculates the npv of a
suggested initial investment. The net present value (NPV) is calculated by summing all of the
financial outputs and arrivals for the management reserve at the return on capital. Cash
withdrawals are unfavorable, whereas cash inflows are favorable. The present values price is the
amount of the present values of all financing costs from the business. As a result, the NPV equals
the purchase price (PV) of all plan cash flow equal to the present value (PV) of all program
income statement (MALIK and et.al, 2021).
Document Page
For Project A:
Project A
Year Net Cash flows Discount Factor @
12%
Present value of net cash
flows
1 100,000 0.892 89200
2 150,000 0.797 119550
3 130,000 0.711 92430
4 80000 0.635 50800
5 50000 0.567 28350
Total Present value
=
380330
Initial Investment = 360,000
NPV = 20330
Project B
Year Net Cash flows Discount Factor @
12%
Present value of net cash
flows
1 70000 0.892 62440
2 90000 0.797 71730
3 100000 0.711 71100
4 150000 0.635 95250
5 50000 0.567 28350
Total Present value
=
328870
Initial Investment = 390000
Document Page
NPV = - 61130
As a result of the business's analysis of the two proposals, it can be stated that initiative
A's Net Present Value is significantly higher and should be adopted by Beta Limited. The Net
Present Value of Project B has sunk to a negative level. The corporation should not approve
Project B.
Internal rate of return:
Period Inflows PV @ 12% Cash Flow
0 360,000 1 -360,000
1 100,000 0.892 89200
2 150,000 0.797 119550
3 130,000 0.711 92430
4 80000 0.635 50800
5 50000 0.567 28350
Residual value
at the end 380330
Net Present Value -20330
tabler-icon-diamond-filled.svg

Paraphrase This Document

Need a fresh take? Get an instant paraphrase of this document with our AI Paraphraser
Document Page
Period Inflows PV @ 14% Cash Flow
0 360,000 1 -360000
1 100,000 0.877 87700
2 150,000 0.769 115350
3 130,000 0.674 87620
4 80000 0.592 47360
5 50000 0.519 25950
Residual value
at the end 363980
Net Present Value -3980
IRR = 12 + { -20330 / (20330) - (-3980) } * ( 14 - 12 )
= 12 + { -20330 / 3980 } * 2
= 8.8 %.
Period Inflows PV @ 12% Cash Flow
0 390,000 1 -390,000
1 70000 0.892 62440
2 90000 0.797 71730
3 100000 0.711 71100
Document Page
4 150000 0.635 95250
5 50000 0.567 28350
Residual value
at the end 328870
Net Present Value 61130
Period Inflows PV @ 14% Cash Flow
0 390,000 1 -390000
1 70000 0.877 61390
2 90000 0.769 69210
3 100000 0.674 67400
4 150000 0.592 88800
5 50000 0.519 25950
Residual value
at the end 312750
Net Present Value 77250
IRR = 12 + {61130 / 61130 - 77250) } * ( 14 - 12 )
= 12 + {61130 / (16120) } * 2
= 12 %.
Document Page
By analyzing the internal rate of return both on the A and B projects. It can be concluded
that management A has a lower internal rate of return. In comparison to project A, project B is
just more. The industry rate of return is usually around 10%. As a result, project A should be
chosen because the IRR is lower than the standard worth (Durana and et.al, 2020).
Project A should be evaluated if the business decides to accept one of the two initiatives.
Project A has an upfront outlay of 360000, payback duration of 3.1 years, a larger and better Net
Present Value (NPV) approach, and an internal rate of return that is substantially lower than the
standard rate of return. In compared to project B, the Beta limited firm must select a first venture
in A.
Analysing and comparing the internal and external performance indicators
The below are the ratios that assist Beta Limited in determining the corporation's
responsibility. The following are the proportions:
Current ratio:
Current Ratio= Current Assets / Current liabilities.
Current assets 49000
Current liabilities 27000
Calculation 49000/270000 = 1.81:1
Thus, the Current Ratio for the Beta limited company= 1.81:1.
Quick ratio:
Quick ratio: Current Assets -Inventories- Prepaid/Current Liabilities
Quick assets 22000
Current liabilities 27000
Calculation 22000/270000 = 0.81:1
Thus, the quick ratio for the Beta limited company= 0.81:1
tabler-icon-diamond-filled.svg

Paraphrase This Document

Need a fresh take? Get an instant paraphrase of this document with our AI Paraphraser
Document Page
Debt to equity ratio: Calculating the debt-to-equity ratio will help you learn how accountable a
firm like Beta Limited is. The formula for determining the debt-to-equity ratio is:
Debt to equity ratio: Short Term Debts + Long Term Debt/ Stockholders equity
Debt 140000
Equity 79000
Debt to equity ratio 140000/790000 = 1.77:1
Working Notes:
All total debts of the company are: Bank loans + 5%Debentures
60000 + 80000
= 140000
Stockholders’ equity: Equity Share Capital + Reserve and Surplus + 6% Preference Share
Capital
= 50000+ 19000 + 10000
= 79,000
Interest coverage ratio: Users can also compute the interest coverage ratio to determine the
responsibility of a corporation like Beta limited. The method of determining the interest coverage
ratio is:
Interest coverage ratio= Earnings before interest and tax/ Expense of the interest
Earnings before interest and tax 95000
Expense of the interest 20000
Calculation 95000/20000 = 4.75:1
Document Page
Thus, the interest coverage ratio for the Beta limited company= 4.75:1.
Stock turnover ratio
Net sales 700,000
Average inventory 125000
Calculation 700000/12500 = 56:1
Debtor’s turnover ratio
Net credit sales 700000
Average debtors 5000
Calculation 70000/5000 = 150:1
Creditor’s turnover ratio
Creditor’ turnover ratio= Net credit purchase/ Opening creditors + Closing Creditors/2
Net credit purchase 3750000
Average creditors 5000
Calculation 375000/5000 = 75:1
Net profit margin ratio
Net profit 90000
Net sales 70000
Calculation 90000/70000*100 = 12.86%
chevron_up_icon
1 out of 16
circle_padding
hide_on_mobile
zoom_out_icon
[object Object]