Business Finance Individual Assignment: Tesla Deal Financial Analysis
VerifiedAdded on 2022/11/24
|10
|1590
|229
Report
AI Summary
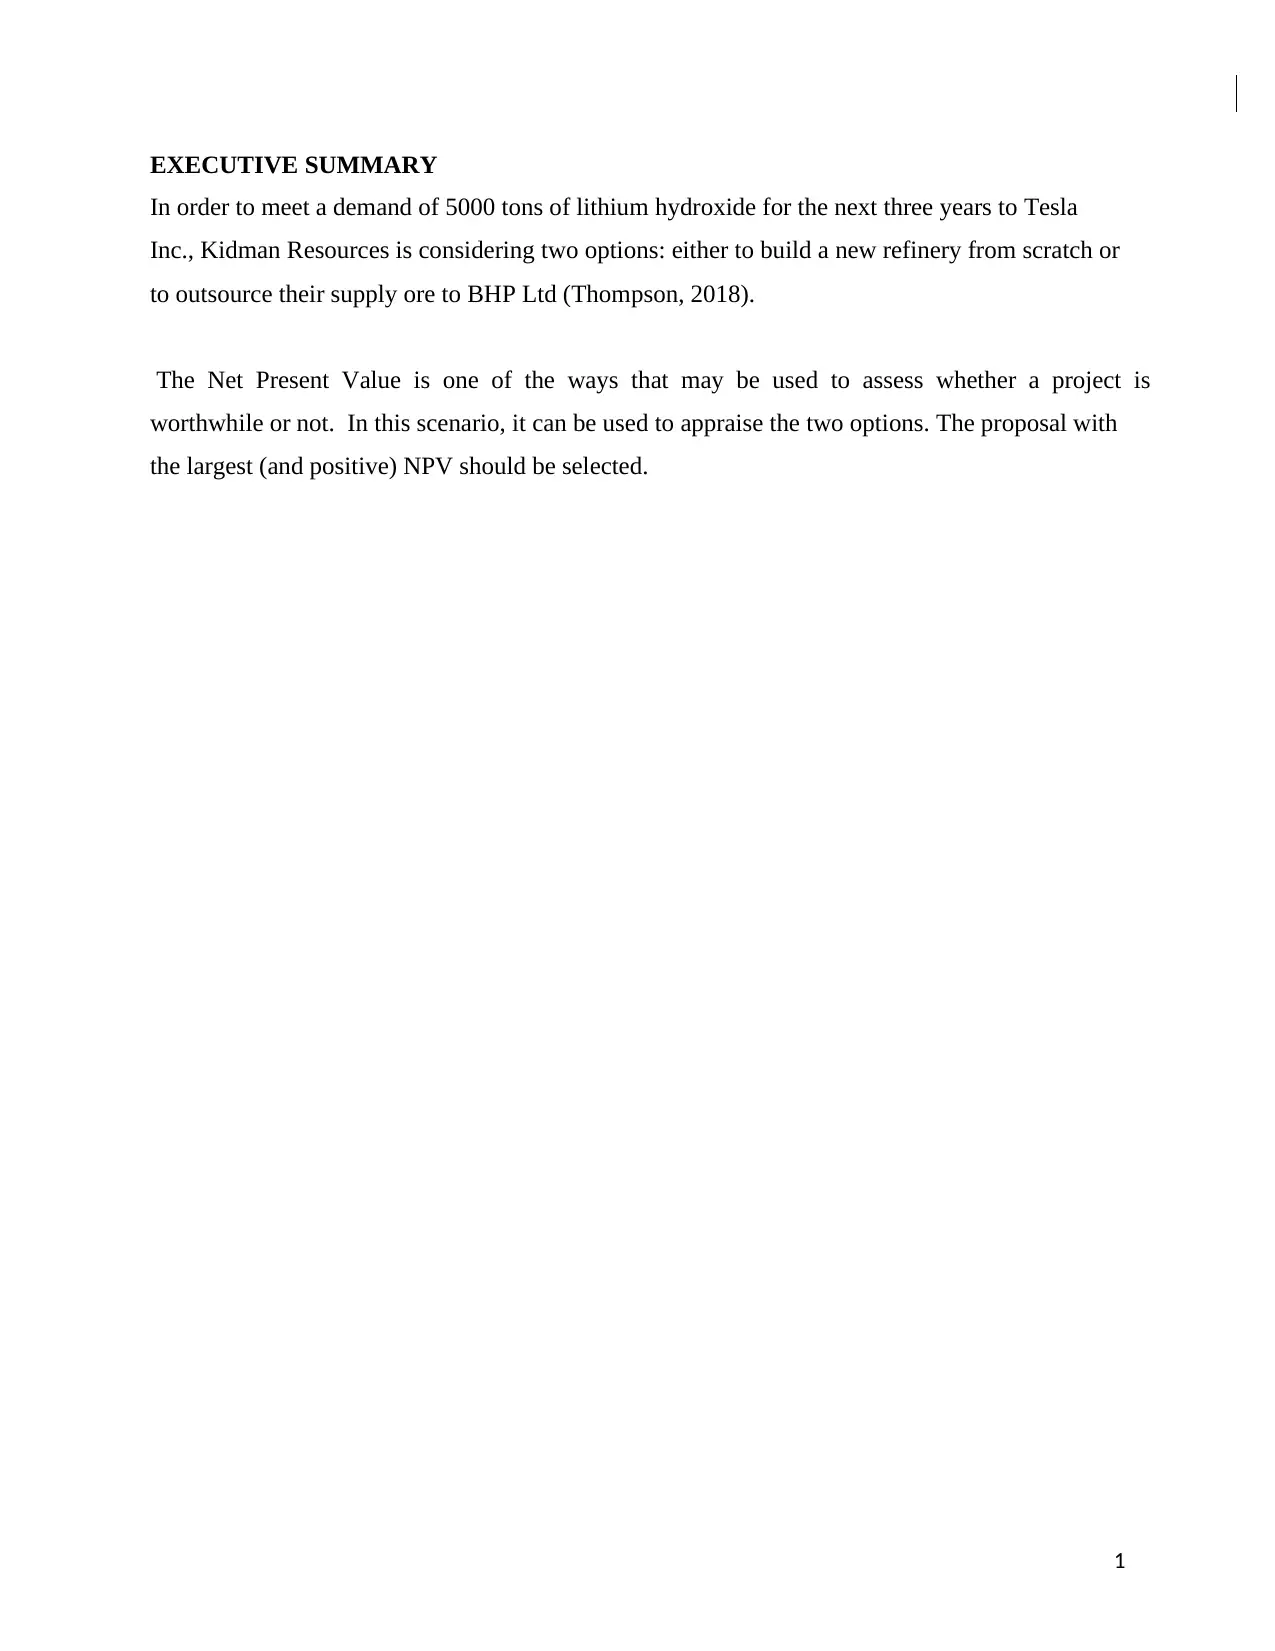
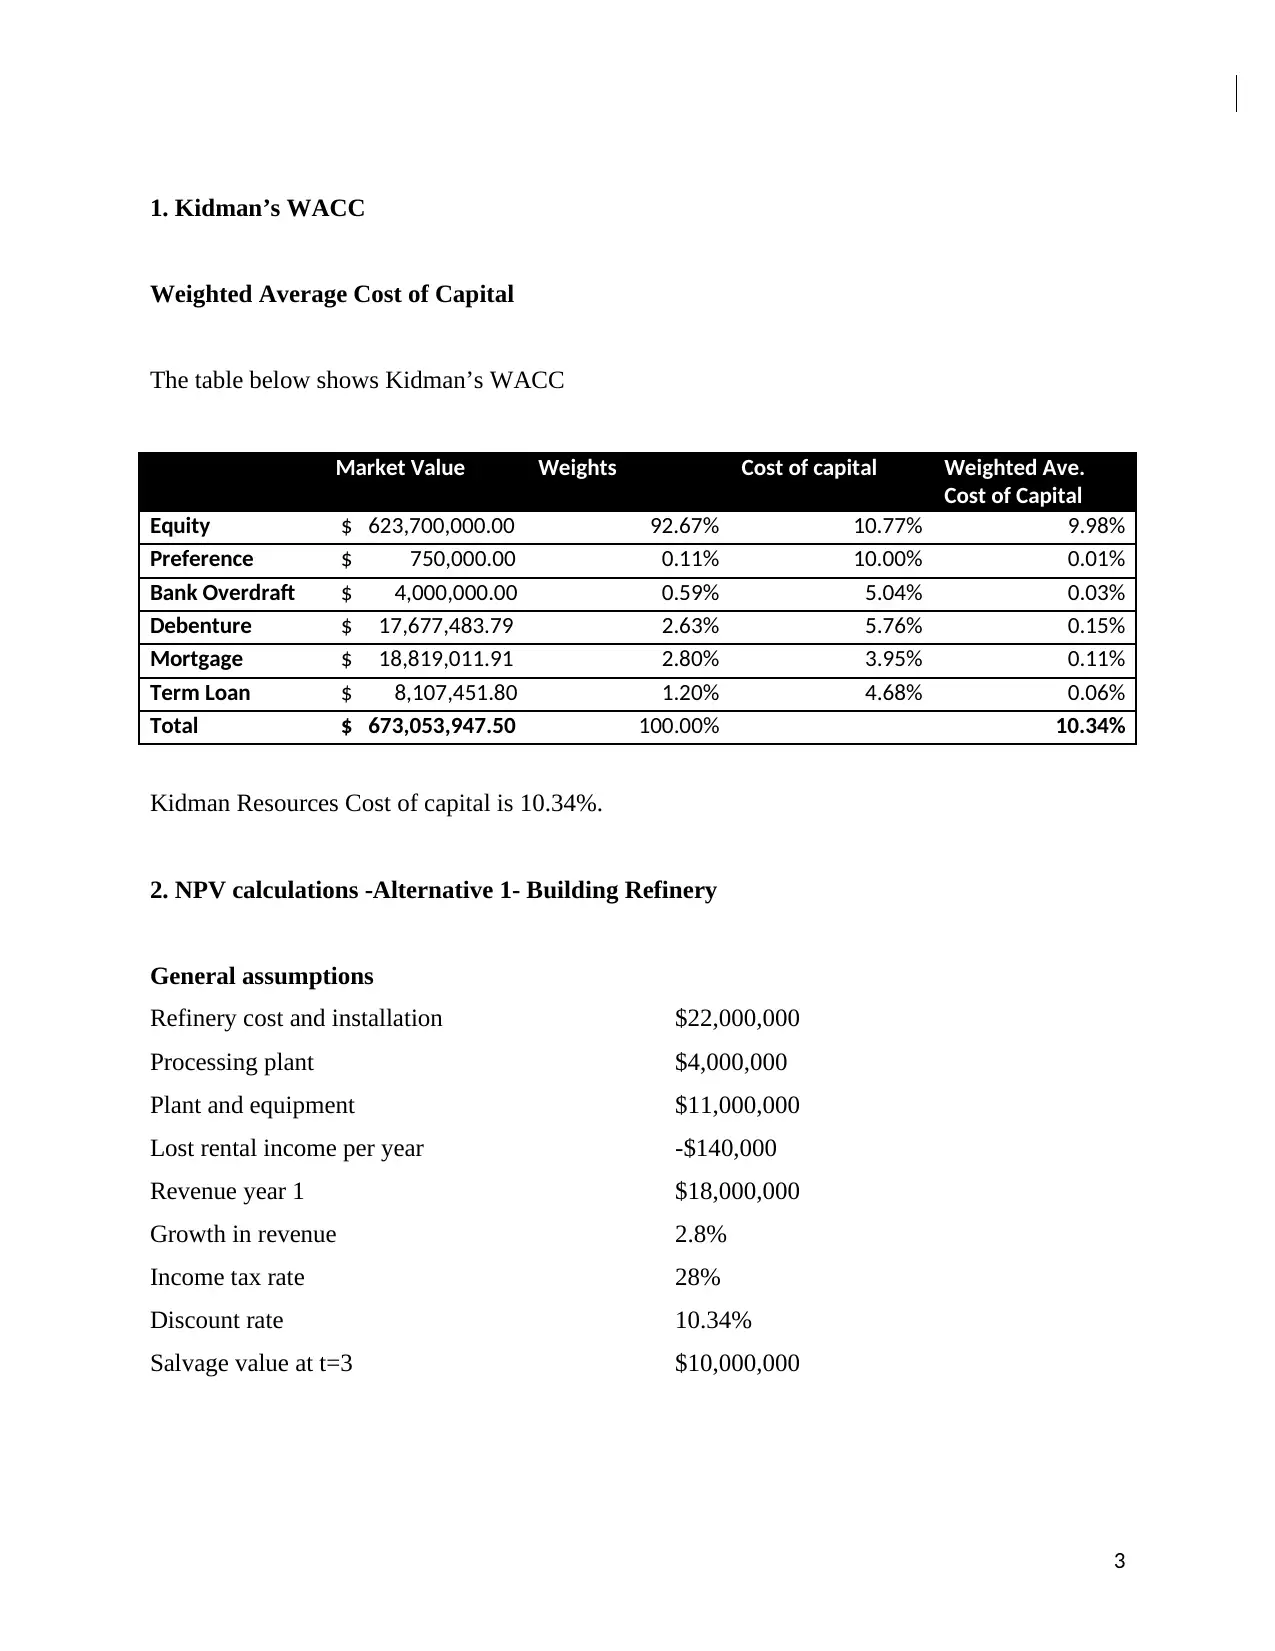
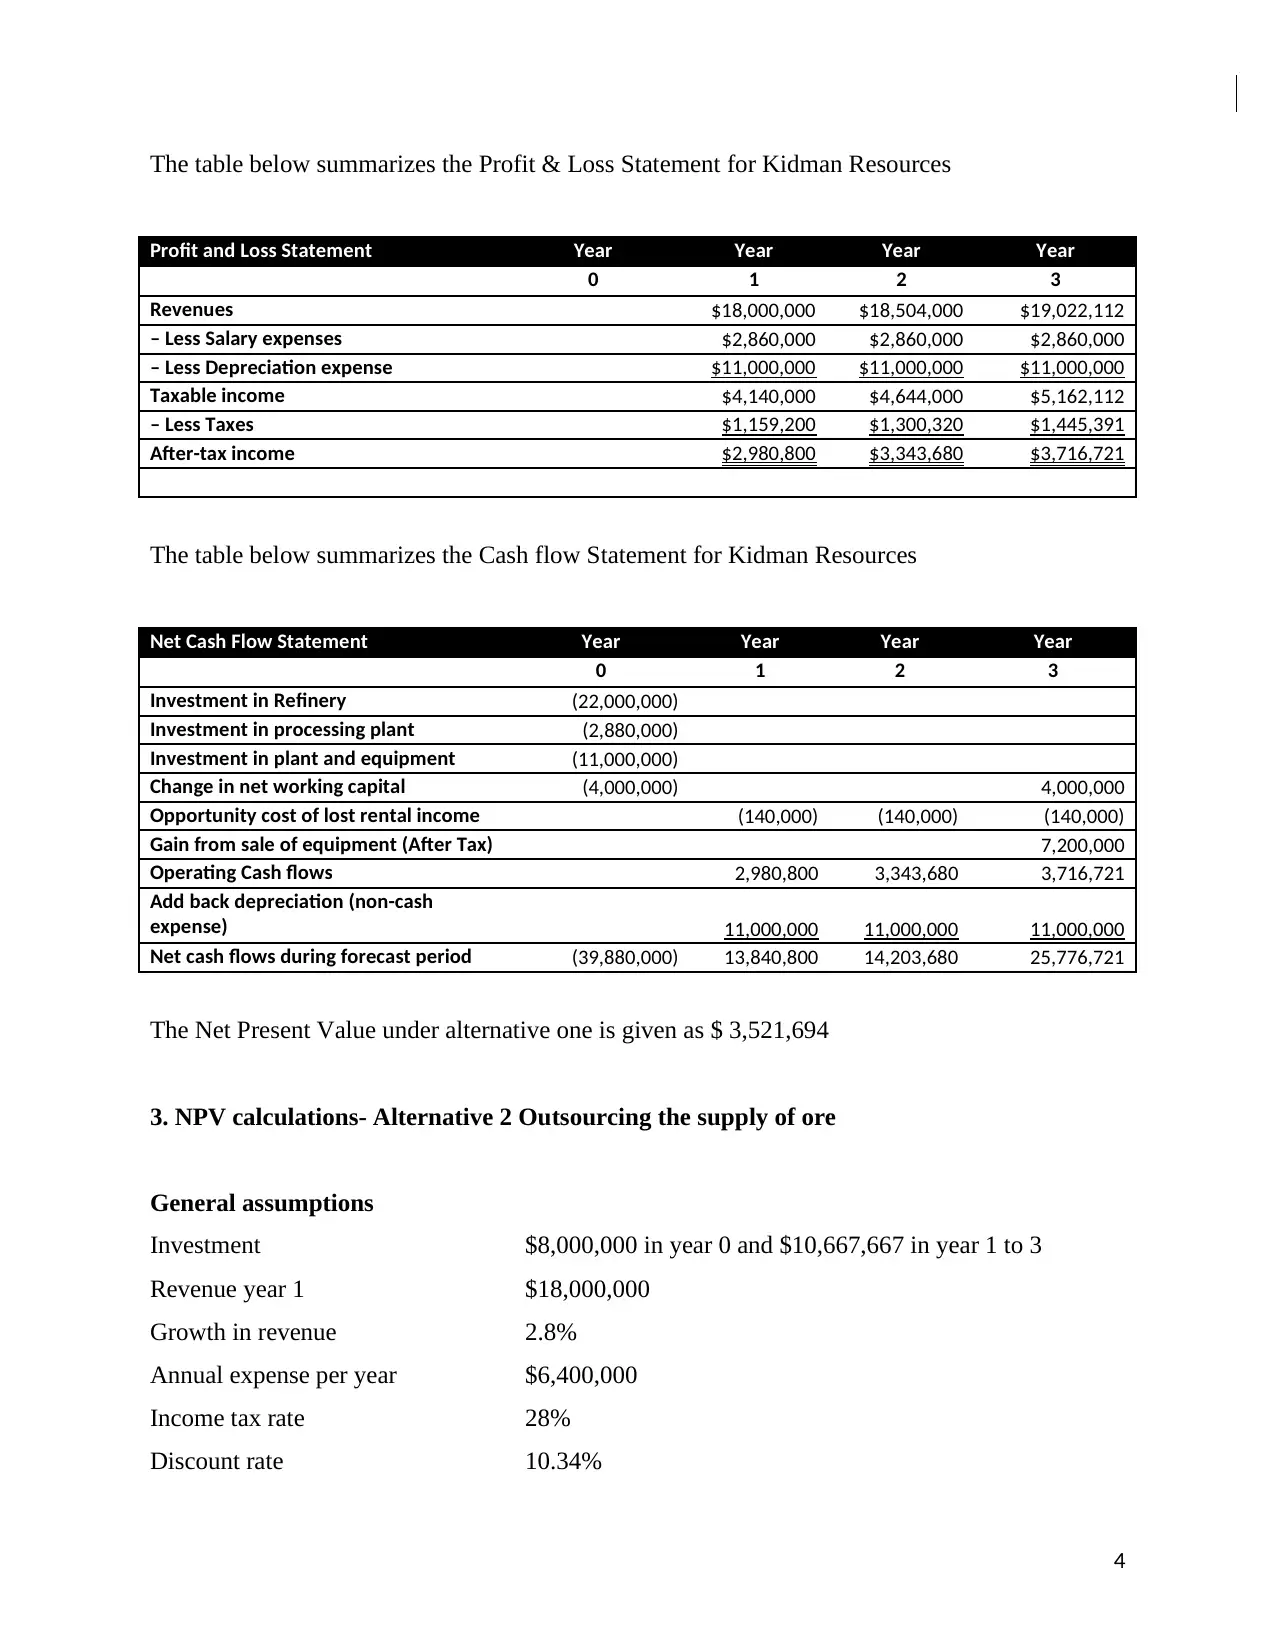
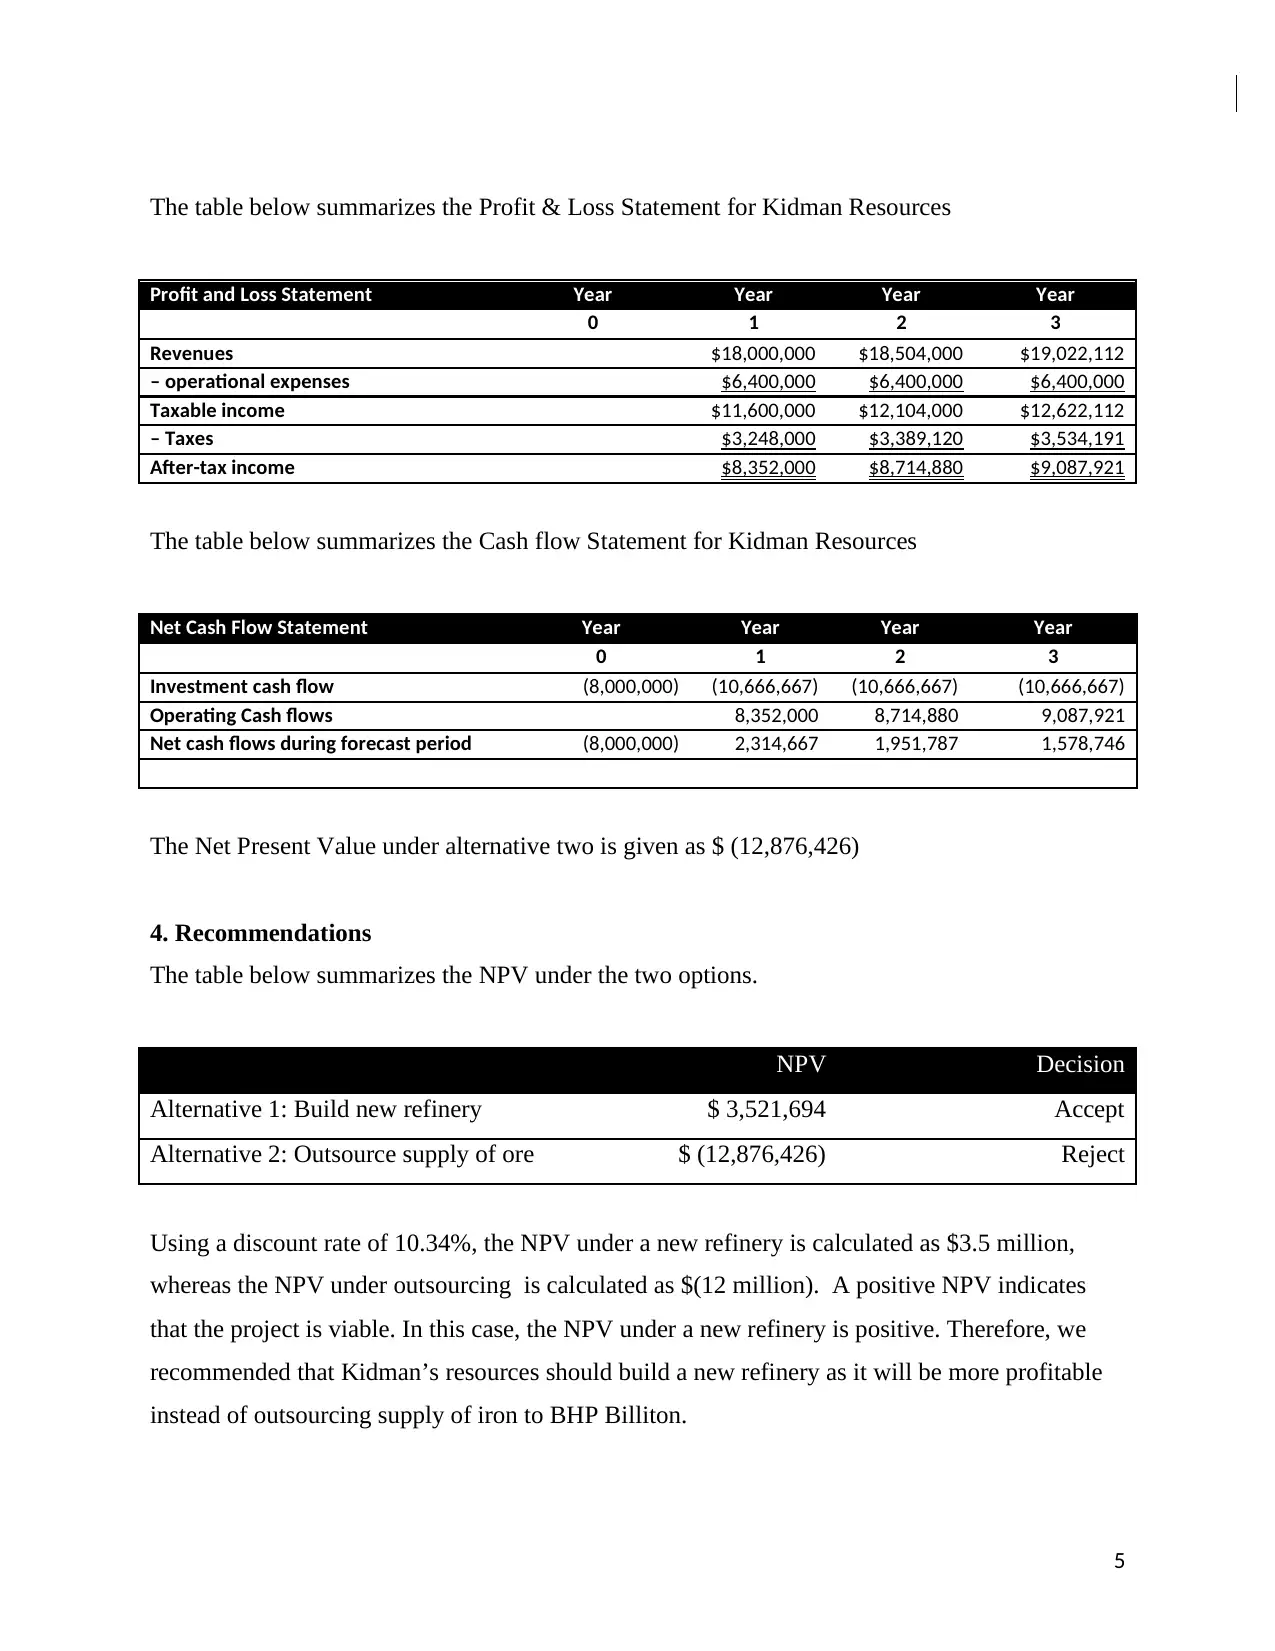
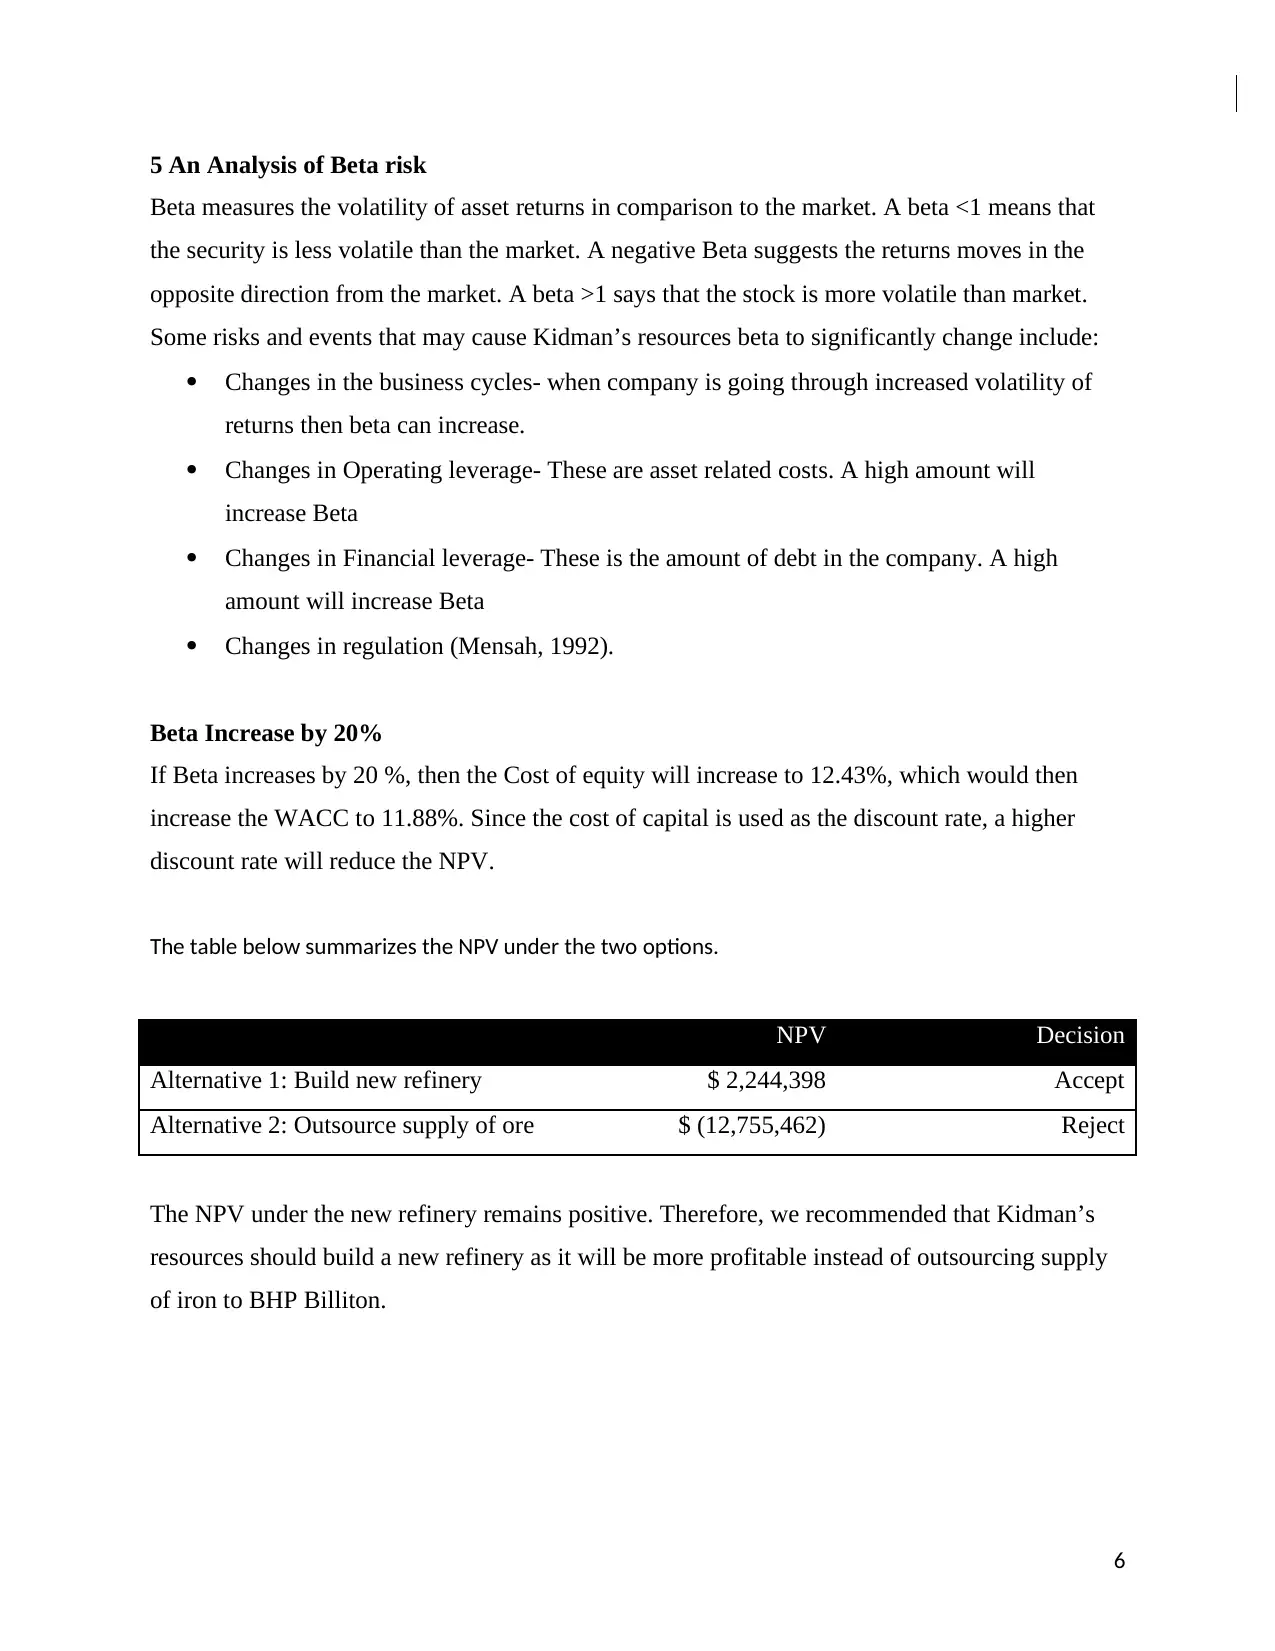
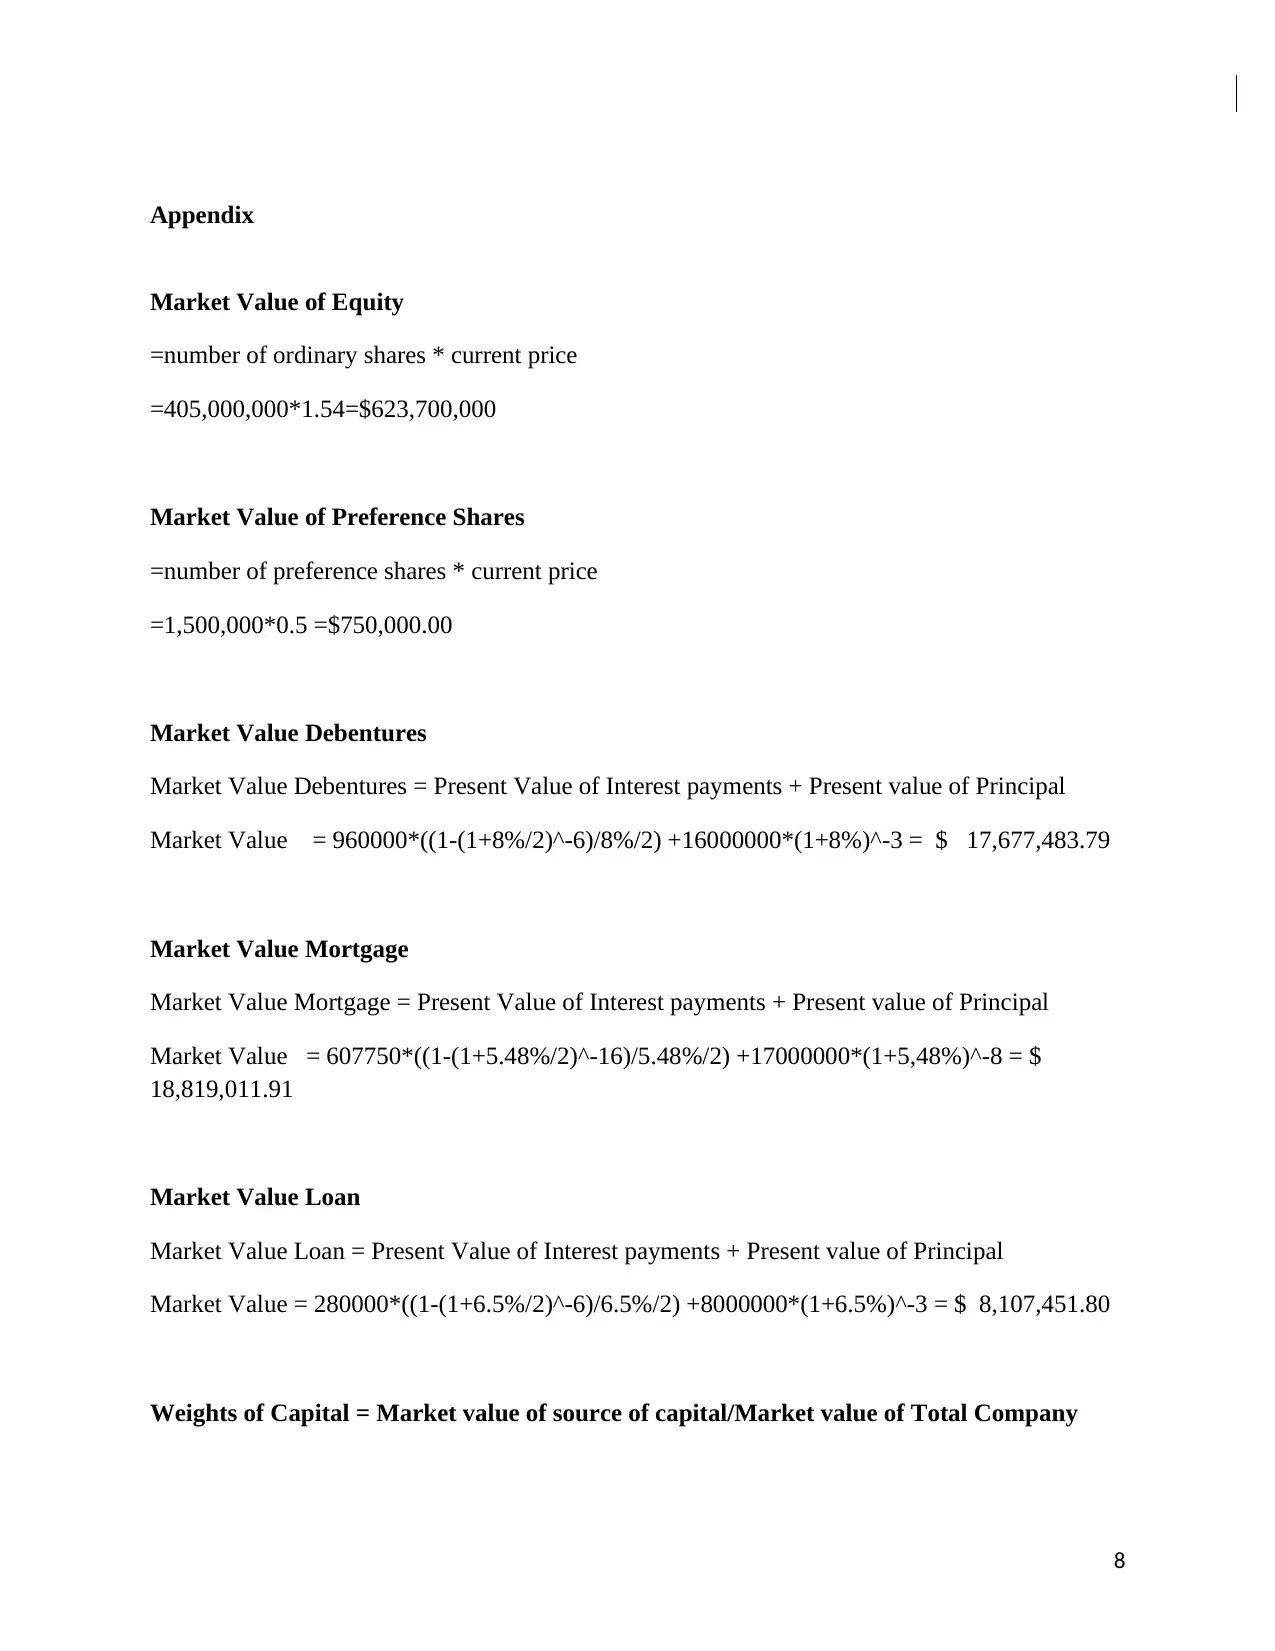
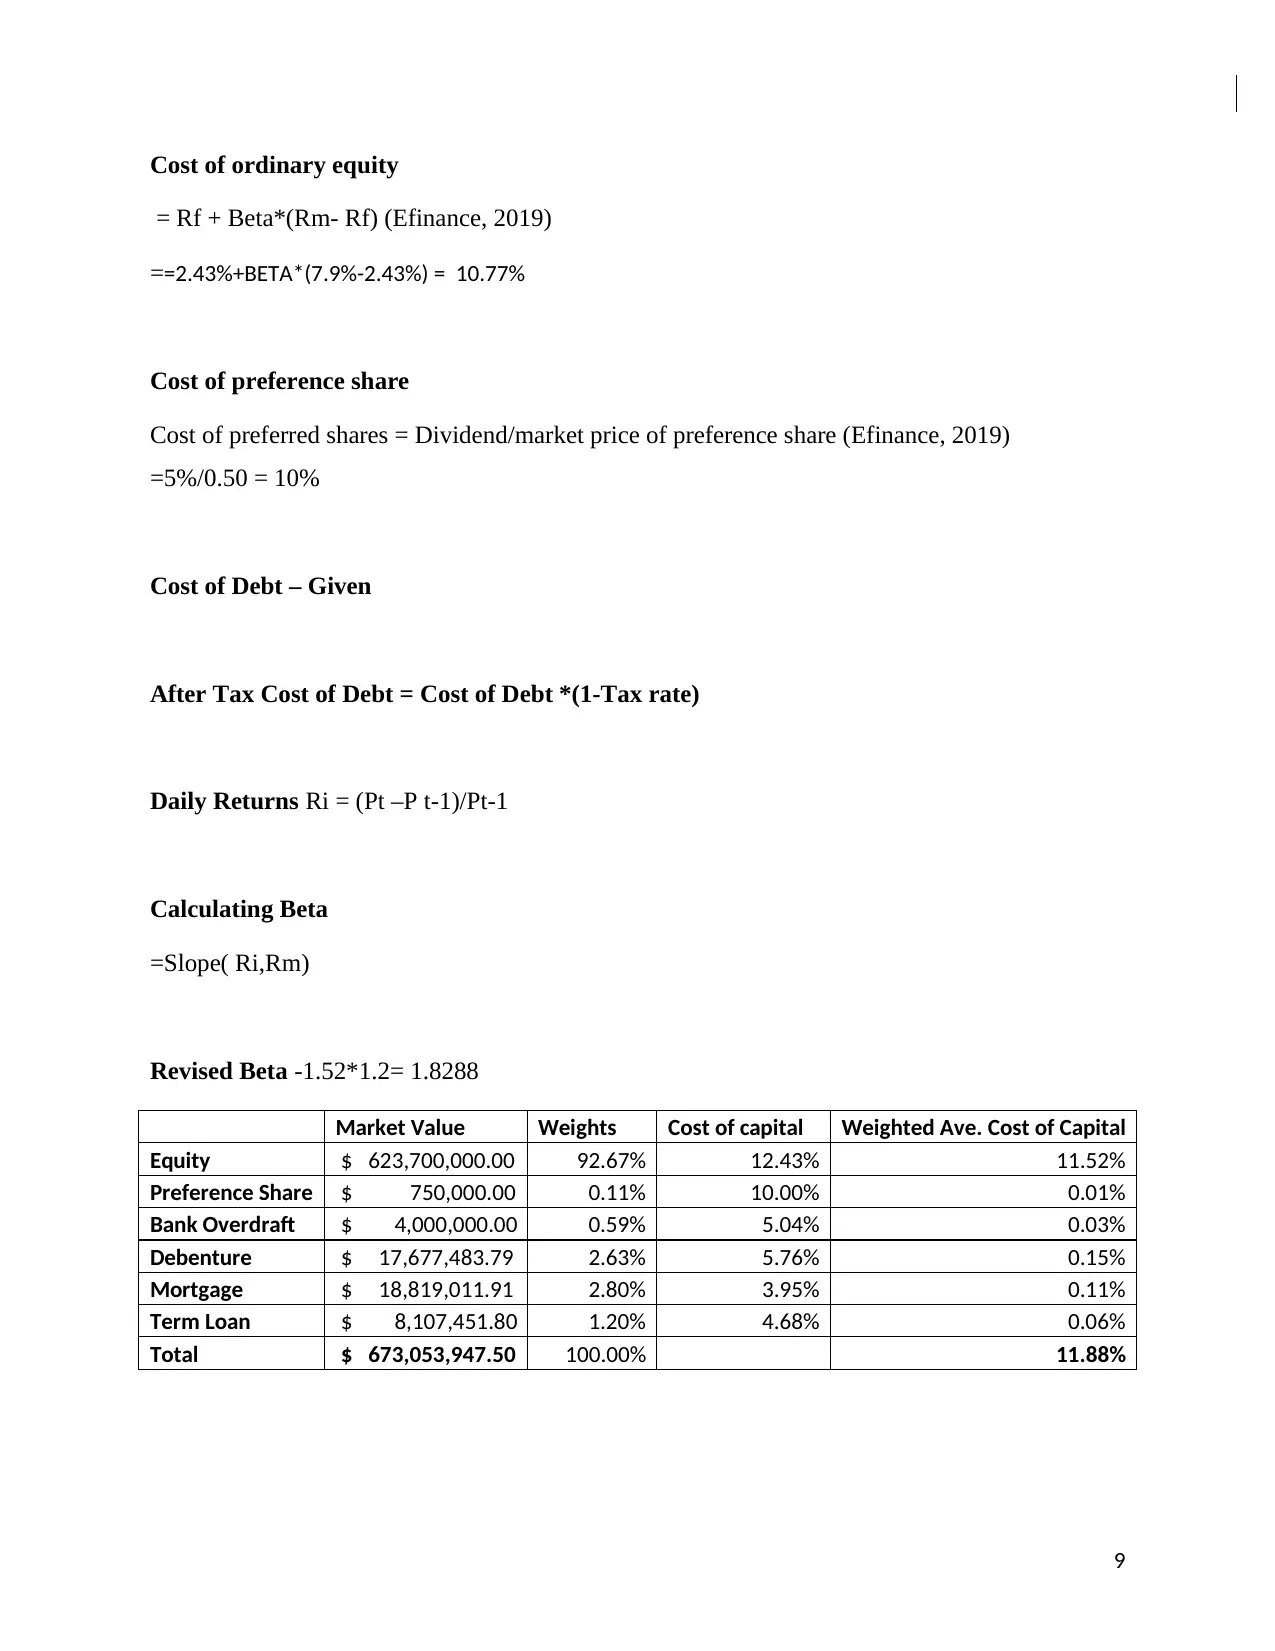
This assignment analyzes the financial decisions facing Kidman Resources regarding a deal to supply Tesla with lithium hydroxide. The core of the analysis involves evaluating two options: building a new refinery or outsourcing the supply of ore. The report calculates the Weighted Average Cost of Capital (WACC) for Kidman Resources and uses Net Present Value (NPV) to assess the profitability of each option. The analysis includes detailed financial statements, including profit and loss and cash flow statements, for both scenarios. Recommendations are made based on the NPV calculations, considering the potential impact of beta risk on the project's viability. The assignment demonstrates the application of financial principles to real-world business decisions, offering insights into investment appraisal and risk management.
Contribute Materials
Your contribution can guide someone’s learning journey. Share your
documents today.

BUSINESS FINANCE
INDIVIDUAL ASSIGNMENT
Secure Best Marks with AI Grader
Need help grading? Try our AI Grader for instant feedback on your assignments.

1
EXECUTIVE SUMMARY
In order to meet a demand of 5000 tons of lithium hydroxide for the next three years to Tesla
Inc., Kidman Resources is considering two options: either to build a new refinery from scratch or
to outsource their supply ore to BHP Ltd (Thompson, 2018).
The Net Present Value is one of the ways that may be used to assess whether a project is
worthwhile or not. In this scenario, it can be used to appraise the two options. The proposal with
the largest (and positive) NPV should be selected.

2
TABLE OF CONTENTS
EXECUTIVE SUMMARY .................................................................................................................................. 1
TABLE OF CONTENTS ..................................................................................................................................... 2
1. Kidman’s WACC .................................................................................................................................. 3
2. NPV calculations -Alternative 1- Building Refinery ............................................................................ 3
3. NPV calculations- Alternative 2 Outsourcing the supply of ore ........................................................... 4
4. Recommendations ................................................................................................................................. 5
5 An Analysis of Beta risk ........................................................................................................................ 6
References .................................................................................................................................................... 7
Appendix ....................................................................................................................................................... 8

3
1. Kidman’s WACC
Weighted Average Cost of Capital
The table below shows Kidman’s WACC
Market Value Weights Cost of capital Weighted Ave.
Cost of Capital
Equity $ 623,700,000.00 92.67% 10.77% 9.98%
Preference $ 750,000.00 0.11% 10.00% 0.01%
Bank Overdraft $ 4,000,000.00 0.59% 5.04% 0.03%
Debenture $ 17,677,483.79 2.63% 5.76% 0.15%
Mortgage $ 18,819,011.91 2.80% 3.95% 0.11%
Term Loan $ 8,107,451.80 1.20% 4.68% 0.06%
Total $ 673,053,947.50 100.00% 10.34%
Kidman Resources Cost of capital is 10.34%.
2. NPV calculations -Alternative 1- Building Refinery
General assumptions
Refinery cost and installation $22,000,000
Processing plant $4,000,000
Plant and equipment $11,000,000
Lost rental income per year -$140,000
Revenue year 1 $18,000,000
Growth in revenue 2.8%
Income tax rate 28%
Discount rate 10.34%
Salvage value at t=3 $10,000,000
Secure Best Marks with AI Grader
Need help grading? Try our AI Grader for instant feedback on your assignments.

4
The table below summarizes the Profit & Loss Statement for Kidman Resources
Profit and Loss Statement Year Year Year Year
0 1 2 3
Revenues $18,000,000 $18,504,000 $19,022,112
– Less Salary expenses $2,860,000 $2,860,000 $2,860,000
– Less Depreciation expense $11,000,000 $11,000,000 $11,000,000
Taxable income $4,140,000 $4,644,000 $5,162,112
– Less Taxes $1,159,200 $1,300,320 $1,445,391
After-tax income $2,980,800 $3,343,680 $3,716,721
The table below summarizes the Cash flow Statement for Kidman Resources
Net Cash Flow Statement Year Year Year Year
0 1 2 3
Investment in Refinery (22,000,000)
Investment in processing plant (2,880,000)
Investment in plant and equipment (11,000,000)
Change in net working capital (4,000,000) 4,000,000
Opportunity cost of lost rental income (140,000) (140,000) (140,000)
Gain from sale of equipment (After Tax) 7,200,000
Operating Cash flows 2,980,800 3,343,680 3,716,721
Add back depreciation (non-cash
expense) 11,000,000 11,000,000 11,000,000
Net cash flows during forecast period (39,880,000) 13,840,800 14,203,680 25,776,721
The Net Present Value under alternative one is given as $ 3,521,694
3. NPV calculations- Alternative 2 Outsourcing the supply of ore
General assumptions
Investment $8,000,000 in year 0 and $10,667,667 in year 1 to 3
Revenue year 1 $18,000,000
Growth in revenue 2.8%
Annual expense per year $6,400,000
Income tax rate 28%
Discount rate 10.34%

5
The table below summarizes the Profit & Loss Statement for Kidman Resources
Profit and Loss Statement Year Year Year Year
0 1 2 3
Revenues $18,000,000 $18,504,000 $19,022,112
– operational expenses $6,400,000 $6,400,000 $6,400,000
Taxable income $11,600,000 $12,104,000 $12,622,112
– Taxes $3,248,000 $3,389,120 $3,534,191
After-tax income $8,352,000 $8,714,880 $9,087,921
The table below summarizes the Cash flow Statement for Kidman Resources
Net Cash Flow Statement Year Year Year Year
0 1 2 3
Investment cash flow (8,000,000) (10,666,667) (10,666,667) (10,666,667)
Operating Cash flows 8,352,000 8,714,880 9,087,921
Net cash flows during forecast period (8,000,000) 2,314,667 1,951,787 1,578,746
The Net Present Value under alternative two is given as $ (12,876,426)
4. Recommendations
The table below summarizes the NPV under the two options.
NPV Decision
Alternative 1: Build new refinery $ 3,521,694 Accept
Alternative 2: Outsource supply of ore $ (12,876,426) Reject
Using a discount rate of 10.34%, the NPV under a new refinery is calculated as $3.5 million,
whereas the NPV under outsourcing is calculated as $(12 million). A positive NPV indicates
that the project is viable. In this case, the NPV under a new refinery is positive. Therefore, we
recommended that Kidman’s resources should build a new refinery as it will be more profitable
instead of outsourcing supply of iron to BHP Billiton.

6
5 An Analysis of Beta risk
Beta measures the volatility of asset returns in comparison to the market. A beta <1 means that
the security is less volatile than the market. A negative Beta suggests the returns moves in the
opposite direction from the market. A beta >1 says that the stock is more volatile than market.
Some risks and events that may cause Kidman’s resources beta to significantly change include:
Changes in the business cycles- when company is going through increased volatility of
returns then beta can increase.
Changes in Operating leverage- These are asset related costs. A high amount will
increase Beta
Changes in Financial leverage- These is the amount of debt in the company. A high
amount will increase Beta
Changes in regulation (Mensah, 1992).
Beta Increase by 20%
If Beta increases by 20 %, then the Cost of equity will increase to 12.43%, which would then
increase the WACC to 11.88%. Since the cost of capital is used as the discount rate, a higher
discount rate will reduce the NPV.
The table below summarizes the NPV under the two options.
NPV Decision
Alternative 1: Build new refinery $ 2,244,398 Accept
Alternative 2: Outsource supply of ore $ (12,755,462) Reject
The NPV under the new refinery remains positive. Therefore, we recommended that Kidman’s
resources should build a new refinery as it will be more profitable instead of outsourcing supply
of iron to BHP Billiton.
Paraphrase This Document
Need a fresh take? Get an instant paraphrase of this document with our AI Paraphraser

7
References
CFI, 2019. Definition of WACC. [Online]
Available at: https://corporatefinanceinstitute.com/resources/knowledge/finance/what-is-wacc-
formula/
Efinance, 2019. Cost of Preference Share Capital. [Online]
Available at: https://efinancemanagement.com/investment-decisions/cost-of-preference-share-capital
Mensah, Y., 1992. Adjusted accounting beta, operating leverage and financial leverage as determinants
of market beta: A synthesis and empirical evaluation. Review of Quantitative Finance and Accounting,
2(2), pp. 187-203.
Thompson, B., 2018. Elon Musk's Tesla in breakthrough lithium off-take deal with Kidman Resources.
[Online]
Available at: https://www.afr.com/business/mining/kidman-resources-charges-ahead-with-3year-
teslalithium-

8
Appendix
Market Value of Equity
=number of ordinary shares * current price
=405,000,000*1.54=$623,700,000
Market Value of Preference Shares
=number of preference shares * current price
=1,500,000*0.5 =$750,000.00
Market Value Debentures
Market Value Debentures = Present Value of Interest payments + Present value of Principal
Market Value = 960000*((1-(1+8%/2)^-6)/8%/2) +16000000*(1+8%)^-3 = $ 17,677,483.79
Market Value Mortgage
Market Value Mortgage = Present Value of Interest payments + Present value of Principal
Market Value = 607750*((1-(1+5.48%/2)^-16)/5.48%/2) +17000000*(1+5,48%)^-8 = $
18,819,011.91
Market Value Loan
Market Value Loan = Present Value of Interest payments + Present value of Principal
Market Value = 280000*((1-(1+6.5%/2)^-6)/6.5%/2) +8000000*(1+6.5%)^-3 = $ 8,107,451.80
Weights of Capital = Market value of source of capital/Market value of Total Company

9
Cost of ordinary equity
= Rf + Beta*(Rm- Rf) (Efinance, 2019)
==2.43%+BETA*(7.9%-2.43%) = 10.77%
Cost of preference share
Cost of preferred shares = Dividend/market price of preference share (Efinance, 2019)
=5%/0.50 = 10%
Cost of Debt – Given
After Tax Cost of Debt = Cost of Debt *(1-Tax rate)
Daily Returns Ri = (Pt –P t-1)/Pt-1
Calculating Beta
=Slope( Ri,Rm)
Revised Beta -1.52*1.2= 1.8288
Market Value Weights Cost of capital Weighted Ave. Cost of Capital
Equity $ 623,700,000.00 92.67% 12.43% 11.52%
Preference Share $ 750,000.00 0.11% 10.00% 0.01%
Bank Overdraft $ 4,000,000.00 0.59% 5.04% 0.03%
Debenture $ 17,677,483.79 2.63% 5.76% 0.15%
Mortgage $ 18,819,011.91 2.80% 3.95% 0.11%
Term Loan $ 8,107,451.80 1.20% 4.68% 0.06%
Total $ 673,053,947.50 100.00% 11.88%
1 out of 10
Related Documents

Your All-in-One AI-Powered Toolkit for Academic Success.
+13062052269
info@desklib.com
Available 24*7 on WhatsApp / Email
Unlock your academic potential
© 2024 | Zucol Services PVT LTD | All rights reserved.