Investment Analysis of Telstra Corp Ltd - MAF203 Business Finance
VerifiedAdded on 2023/03/23
|12
|3804
|73
Report
AI Summary
This report provides a comprehensive financial analysis of Telstra Corp Ltd, covering various aspects such as industry classification, market capitalization, company overview, risk assessment using beta coefficient, holding period return, and competitor analysis. It delves into expected returns, standard deviation, correlation coefficients, and beta calculations using historical stock data. The report also explores portfolio investment strategies, comparing individual stock performance with market indices and discussing the impact of portfolio diversification on risk and return. Furthermore, it examines the concepts of spurious and real correlations in investment decisions. Finally, the report includes an analysis of various investment projects using gross cash flows, payback period, and internal rate of return (IRR) to evaluate their profitability potential.

Running Head: BUSINESS FINANCE 1
Business Finance
[Name of Writer]
[Name of Institution]
Business Finance
[Name of Writer]
[Name of Institution]
Paraphrase This Document
Need a fresh take? Get an instant paraphrase of this document with our AI Paraphraser
BUSINESS FINANCE 2
Part 1:
Question 1:
Global Industry Classification Standard (GICS) is classification of industries which was
jointly developed and defined by S&P Dow Jones and MSCI (Fan, Furger & Xiu, 2016).
According to this classification there are 11 sectors, 24 industry groups, 69 industries and 158
sub industries (MSCI, 2019). Telstra Corp Ltd is categorized under Telecom Services industry
and Integrated Telecommunication Services sub industry according to Global Industry
Classification Standards (Investsmart, 2019).
Question 2:
Market capitalization refers to total market value of any organization’s shares
outstanding. It can be found by multiplying current share price of the organization with total
shares outstanding. According to Morningstar, total market capitalization of Telstra Corp Ltd is
about AUD 41.1508 Billion.
Question 3:
Telstra is leading organization in the field of telecommunication that offers full range
telecom services and it competes almost in every telecom market. As a leading telecom service
provider, Telstra Corp Ltd serves 18million mobile services, 3.7 million retailed fixed bundles
1.7 Million Voice services. Telecommunication sector is experiencing large scale growth these
days in every corner of the world both in terms of personal use or business need and Telstra Corp
Ltd is committed to serve the growing traffic. Telstra believe in change therefore, remains ready
to accept any technology change and becomes pioneer in many aspects. Telstra’s purpose of
existence is to “Create brilliant connected future for everyone” (Telstra, 2019).
Question 4:
Beta coefficient or simply beta is measure of risk of individual stock. Beta is measure of
unsystematic risk which is risk of individual stock (Williams, 2016). Higher beta means that
company stock is highly volatile and risky. According to Yahoo Finance, beta coefficient of
Telstra is 0.69 (Yahoo Finance, 2019).
Question 5:
Telstra Corp Ltd belongs to telecommunication industry and current market risk of
telecom industry is 0.58.
BUSINESS FINANCE 3
Question 6:
Risk is major factor that is considered by investors prior to investment. Every stock has
different level risk and associated return. In other words, companies with higher risk are more
volatile compared to industry. Although Telstra complete globally but its close competitors are
TPG Telecom Limited and Vodafone Group Plc. Compare to its counterparts, Telstra is less risk
due to less beta. According to Yahoo Finance, TPG Telecom Limited (TPM) has a beta of 1.6.
on the other hand, Vodafone Group Plc has a stock beta of 0.72 (Yahoo Finance, 2019). As we
know that beta coefficient greater than one indicates that particular stock is more volatile or risk
compared to market. Beta coefficient lower than one shows that stock is less volatile than
market. Comparing Telstra to its competitors reveals that Telstra Corp Ltd is less risky than its
counterparts.
Question 7:
Holding period return is total earning or return over holding a security or stock for a
certain period. Holding period return can be weekly, monthly or annually. According to morning
star, 5 year holding period return of Telstra Corp Ltd is 7.54%.
Question 8:
Telstra Corp Ltd is Australian firm headquartered in Melbourne founded in July 1975.
This organization is almost 44 years old.
⊘ This is a preview!⊘
Do you want full access?
Subscribe today to unlock all pages.
Trusted by 1+ million students worldwide
BUSINESS FINANCE 4
Part 2:
Question 2:
Expected return of the give data is -0.07%. This is because stock has faced continuously
decreasing trend. This decreasing trend of stock prices is depicted in negative expected return
stock.
Question 3:
Standard deviation is measure of risk or deviation from the mean. Standard deviation of
daily continuous return of Telstra is 1.543%. this deviation can be explained as there are chances
that given price can deviate from mean by 1.543%.
Question 4:
Daily correlation coefficient between Telstra Corp Ltd and market return is calculated as
0.997. correlation coefficient can be between -1 to +1.
Question 5:
Correlation coefficient between Telstra and market index is calculated as .997 which can
be interpreted as there is strong positive correlation between stock price of Telstra and market
index. For example, on Jan 3, 2018 compounded continuous return of Telstra was 0.005 while it
was 0.004 for Market index. Change in market index yielded almost same change in Telstra
stock which means Telstra is strongly correlated with market.
Question 6:
Beta of any stock is measure of volatility or risk associated with any stock. Beta can be
calculated using different ranges of data. Annual beta can be significantly different than semi-
annually beta. These difference are mainly due to the change in the prices of any stock reflected
in the data. Beta of any stock can be calculated by comparing with any benchmark market. The
formula for calculating beta of any stock is given below
Beta x = (CoV x,y ) / Var x
Paraphrase This Document
Need a fresh take? Get an instant paraphrase of this document with our AI Paraphraser
BUSINESS FINANCE 5
Where x denotes stock for which beta is calculated and y is the benchmark which very
often is market data. In first step variance of the stock is calculated by using percentage change
in the prices. Second step is to find Co variance of stock and benchmark.
Beta of Telstra discussed in part 1 is 0.69 while beta calculated in this part is 0.1556. the
reason of different beta is data used to calculate this figure. In part 1, beta of Telstra is calculated
using daily prices of three years while in this part only 265 days’ data is utilized. Trend analysis
of past prices indicates that Telstra faced high price fluctuation in past three years that resulted in
higher beta.
Question 7:
Return expected of investors from a particular stock is termed as required rate of return.
There are different methods to calculate this parameter depending on the availability of the data.
One method is to calculated expected return based on the stock prices alone which may be
different from the Capital Asset Pricing Model (CAPM). In part 1, required rate of return for
Telstra was -0.07 % which is significantly lower than 2.92% calculated through CAPM. Formula
for calculating required rate of return though CAPM is given below
Required Rate of return =R f + β *Market Risk Premium
Here we can see that in this formula is clearly divided into two parts. Risk free rate is
sure return that can be gained by investing in treasury bonds with almost no risk. While second
part is excess return that investors wants against risk. In part 1, risk free rate is not considered in
the calculation of required rate of return. The stock is undervalued because required rate of return
is significantly lower than expected return. It is arguable that if we add risk free rate of return to
the expected return, we will get CAPM value.
Question 8:
Like expected return of any stock, expected return of portfolio can also be calculated. For
this, first we need to find portfolio beta which is calculated by the following formula
βP= (Weight of A * Beta of A) + (Weight of B* Beta of B)
Beta of portfolio for given data is calculated as 0.635 and required rate of return is found
as 5.32%. Standard deviation of portfolio is 6.87 which is calculated in excel file.
Question 9:
BUSINESS FINANCE 6
Portfolio investment is a method to reduce risk of investment by investing in two or more
securities. According to general impact of portfolio, return will increase and risk will also
increase. Best way is to invest more weight of capital in low risk security to reduce risk. In this
part we calculated required rate of return and standard deviation for individual stock and market.
Required rate of return of Telstra is -0.07% with standard deviation of 1.53. Portfolio return with
equal weightage is 5.32% and standard deviation is 6.87. The primary benefit of the investment
in portfolio is increase in return which is 5.32% while individual security yielded negative return
of 0.07. Apart from the return, we can note that there is also an increase in the risk because there
is higher risk associated with market. As we invested equal weighted in stock and market, it
yielded more risk. The best way to find weightages of each stock is optimal equation with which
risk will decrease significantly.
Question 10:
There are two types of correlations one is spurious while second is real correlations. As
name implies, spurious correlation can be explained as correlation or dependence between two
variables while it is not found actually. It is not a financial method or financial parameter but just
a ridiculous thought. For example, if one expert says that shiny days will result increase in price
while cloudy weather will reduce share price. In some events, it can be very true but actually
there is no correlation between price of stock and weather. A real correlation on other hand is
numerically proved and can be determined through use of data of two different variables. Real
correlation can be defined as correlation or interdependence between two variables where
increase or decrease in one will result increase or decrease on other. Real correlation is used in
investment decision and is calculated by using data of two variables.
⊘ This is a preview!⊘
Do you want full access?
Subscribe today to unlock all pages.
Trusted by 1+ million students worldwide
BUSINESS FINANCE 7
Part III:
Question 1
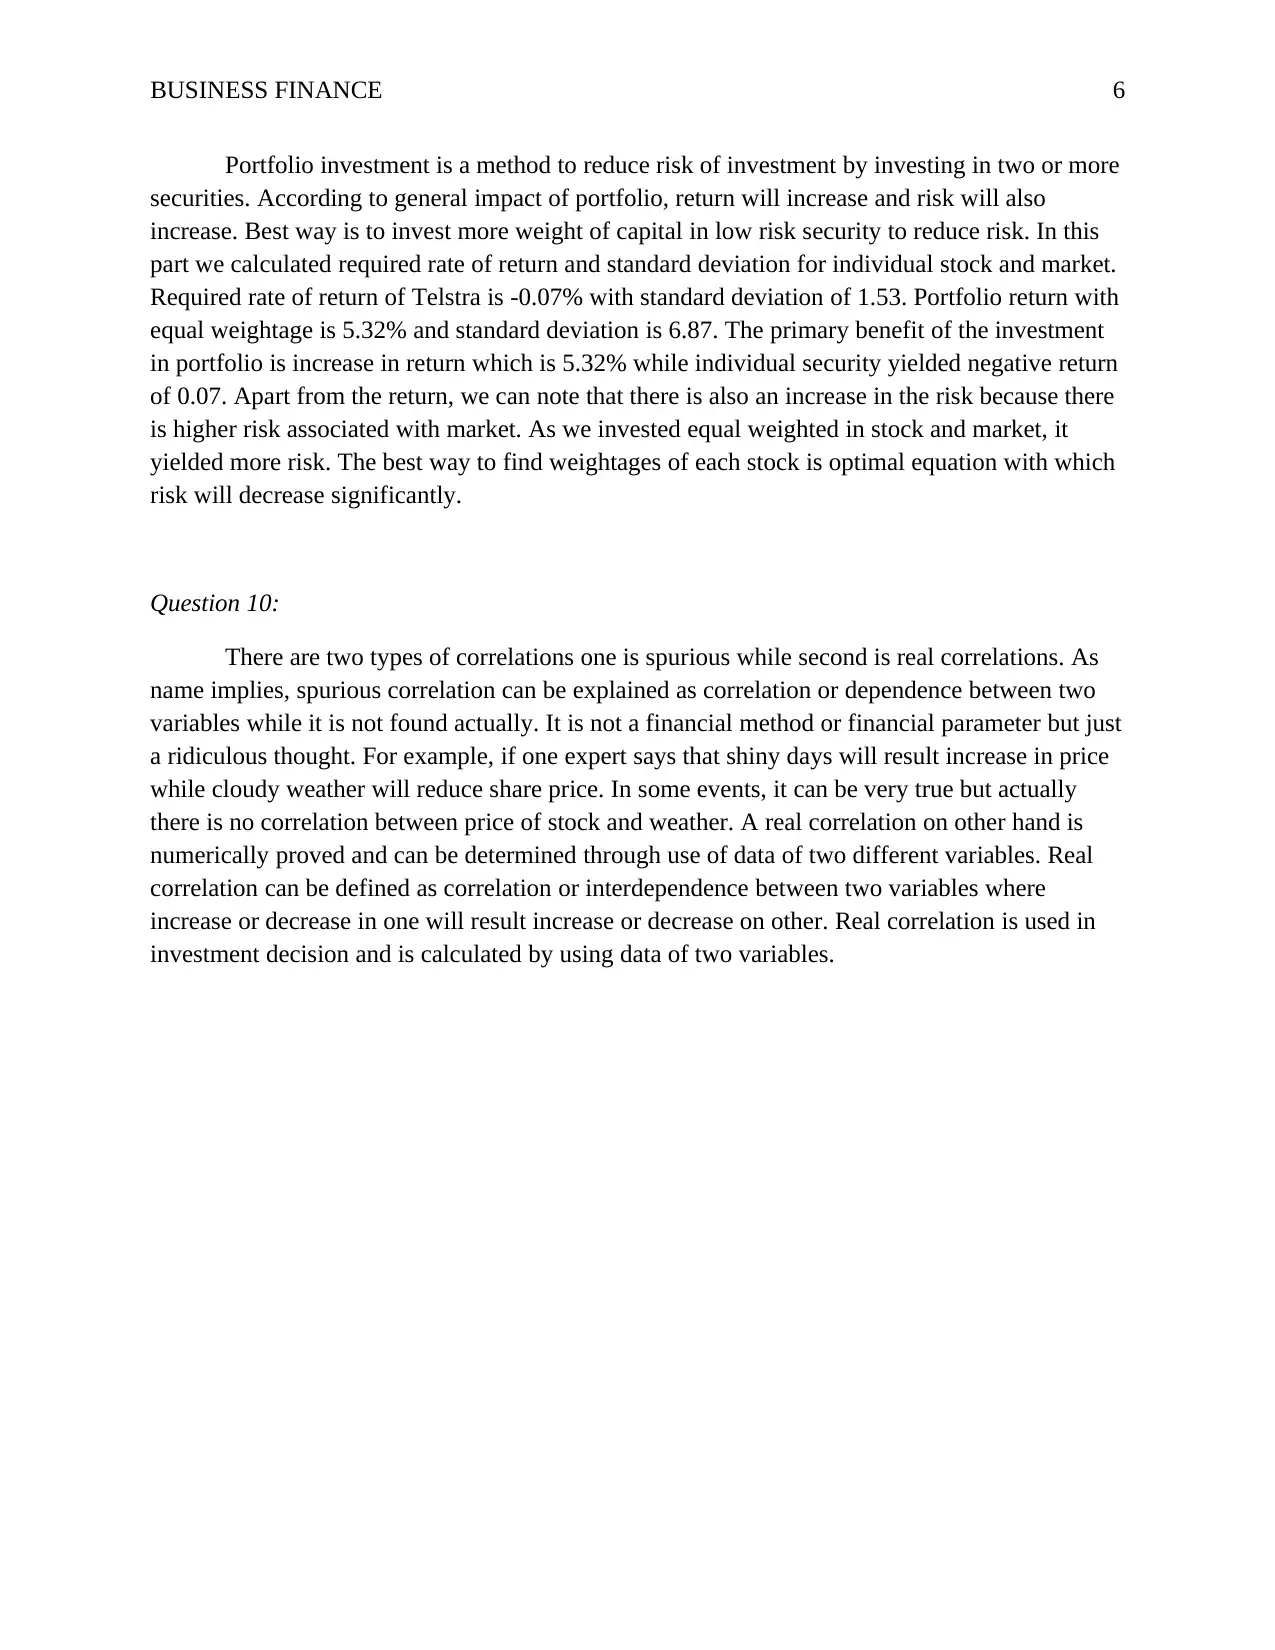
The Gross Cash flow is the sum of all the Cash inflows from year 1 to year 15 of each
project. The following table shows the sum of cash flows of all projects.
Ranking of Projects according to their Cash flows
Project ID I II III IV V VI VII VIII
Gross Cash
Flows 3,410 3,165 10,000 3,661 4,300 3,200 2,560
4,05
0
Ranking 5 7 1 4 2 6 8 3
The table shows the rank of the projects according to their respective cash flows. The
cash flows are gross that is the initial outlay of the project has not been deducted. The Project III
is most attractive, and the Project VII is the least attractive. The project III is ranked as the most
attractive because it has highest Gross Cash flow.
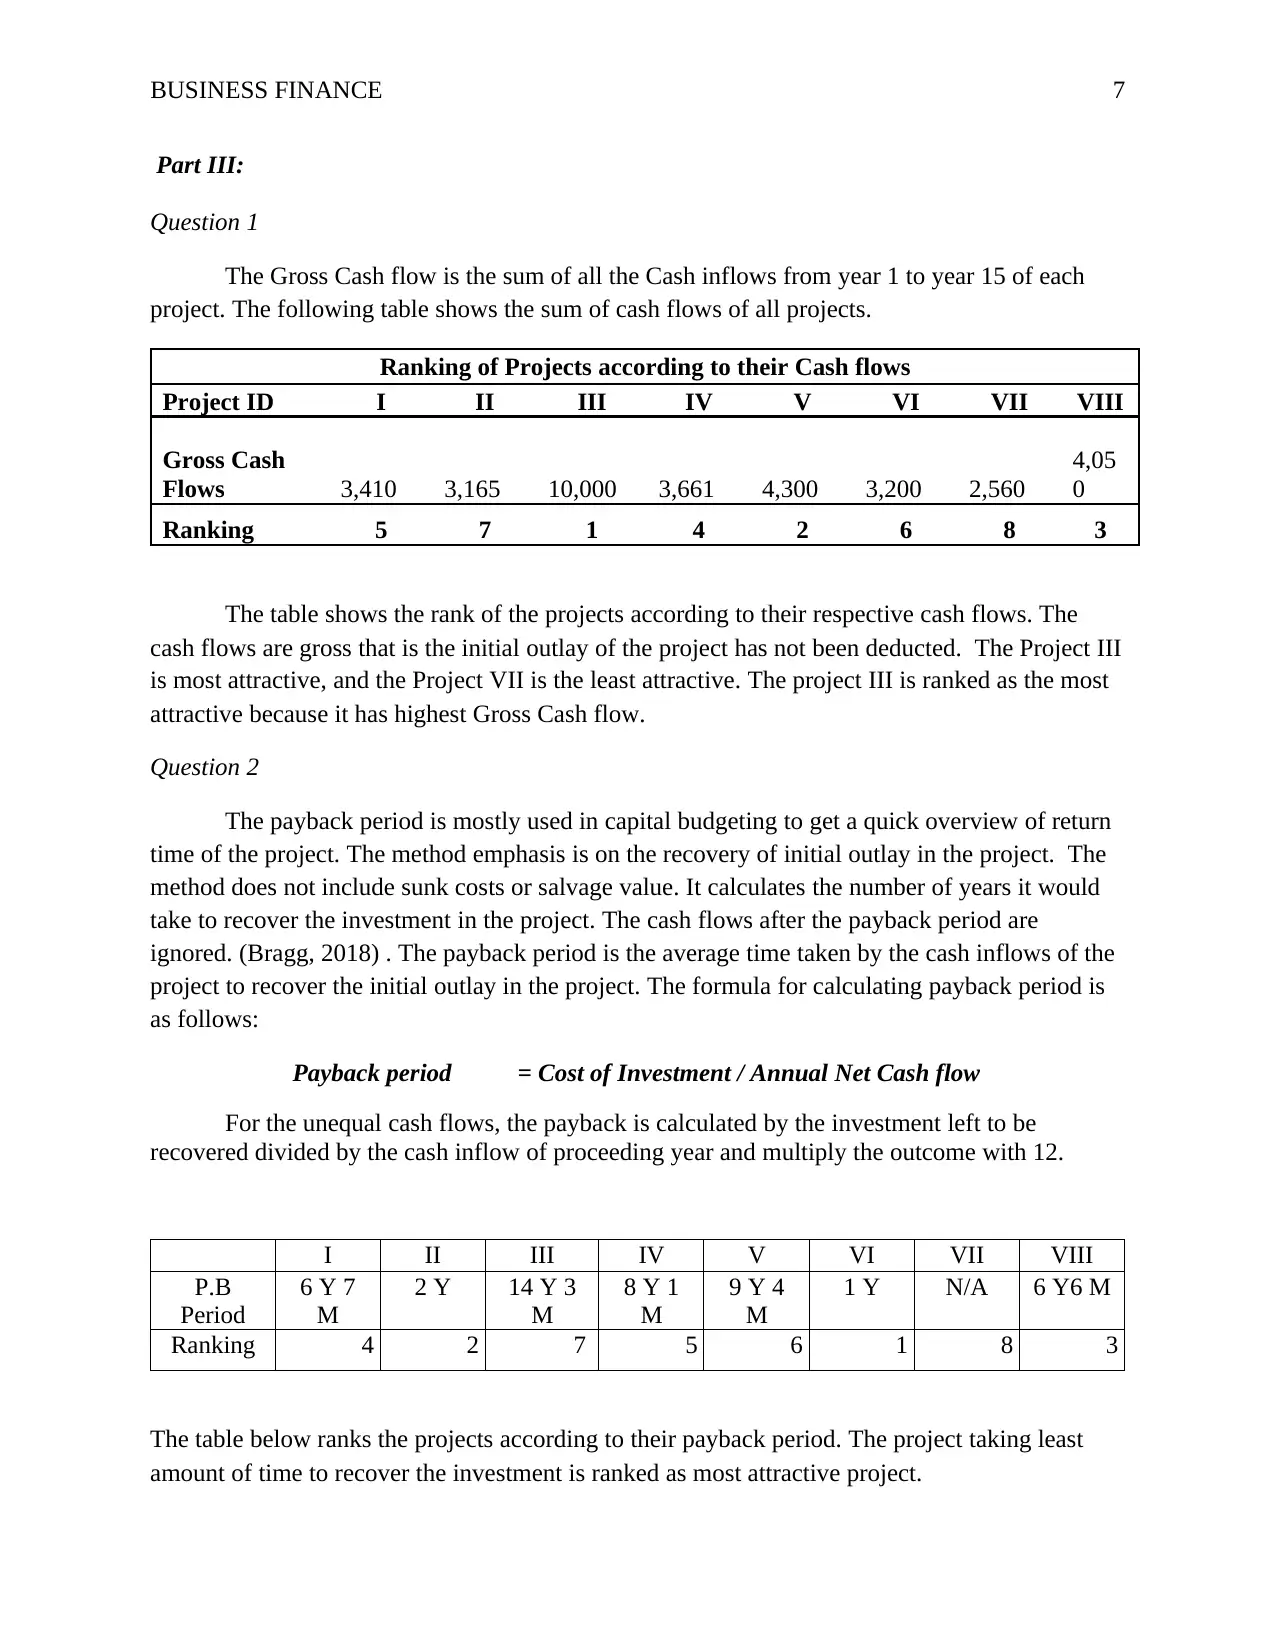
Question 2
The payback period is mostly used in capital budgeting to get a quick overview of return
time of the project. The method emphasis is on the recovery of initial outlay in the project. The
method does not include sunk costs or salvage value. It calculates the number of years it would
take to recover the investment in the project. The cash flows after the payback period are
ignored. (Bragg, 2018) . The payback period is the average time taken by the cash inflows of the
project to recover the initial outlay in the project. The formula for calculating payback period is
as follows:
Payback period = Cost of Investment / Annual Net Cash flow
For the unequal cash flows, the payback is calculated by the investment left to be
recovered divided by the cash inflow of proceeding year and multiply the outcome with 12.
I II III IV V VI VII VIII
P.B
Period
6 Y 7
M
2 Y 14 Y 3
M
8 Y 1
M
9 Y 4
M
1 Y N/A 6 Y6 M
Ranking 4 2 7 5 6 1 8 3
The table below ranks the projects according to their payback period. The project taking least
amount of time to recover the investment is ranked as most attractive project.
Part III:
Question 1
The Gross Cash flow is the sum of all the Cash inflows from year 1 to year 15 of each
project. The following table shows the sum of cash flows of all projects.
Ranking of Projects according to their Cash flows
Project ID I II III IV V VI VII VIII
Gross Cash
Flows 3,410 3,165 10,000 3,661 4,300 3,200 2,560
4,05
0
Ranking 5 7 1 4 2 6 8 3
The table shows the rank of the projects according to their respective cash flows. The
cash flows are gross that is the initial outlay of the project has not been deducted. The Project III
is most attractive, and the Project VII is the least attractive. The project III is ranked as the most
attractive because it has highest Gross Cash flow.
Question 2
The payback period is mostly used in capital budgeting to get a quick overview of return
time of the project. The method emphasis is on the recovery of initial outlay in the project. The
method does not include sunk costs or salvage value. It calculates the number of years it would
take to recover the investment in the project. The cash flows after the payback period are
ignored. (Bragg, 2018) . The payback period is the average time taken by the cash inflows of the
project to recover the initial outlay in the project. The formula for calculating payback period is
as follows:
Payback period = Cost of Investment / Annual Net Cash flow
For the unequal cash flows, the payback is calculated by the investment left to be
recovered divided by the cash inflow of proceeding year and multiply the outcome with 12.
I II III IV V VI VII VIII
P.B
Period
6 Y 7
M
2 Y 14 Y 3
M
8 Y 1
M
9 Y 4
M
1 Y N/A 6 Y6 M
Ranking 4 2 7 5 6 1 8 3
The table below ranks the projects according to their payback period. The project taking least
amount of time to recover the investment is ranked as most attractive project.
Paraphrase This Document
Need a fresh take? Get an instant paraphrase of this document with our AI Paraphraser
BUSINESS FINANCE 8
Question 3:
The IRR employed in capital budgeting helps a company measure the profitability
potential of a project or various projects. Another name for IRR is also Economic rate of return.
The IRR is the discount rate that yields zero net present value for a project.
The IRR is when the NPV of a project is zero. (Vaidya, 2019)
The formula of IRR is as follows:
Internal Rate of Return
I II III IV V VI VII VIII
Initial
Outlay
-
3,000
-
3,000
-
3,000
-
3,000
-
3,000
-
3,000
-
3,000
-
3,000
Year 1
430 2,666 - 260 380 3,200 1,200
-
450
2
330 334 - 200 280 - 900
-
60
3
330 165 - 350 280 - 300 60
4
330 - - 395 280 - 90 350
5
330 - - 432 280 - 70 700
6
330 - - 440 280 - - 1,200
7
330 - - 442 280 - - 2,250
8
1,000 - - 444 280 - - -
9
- - - 446 280 - - -
10
- - - 448 280 - - -
11
- - - 450 280 - - -
12
- - - 451 280 - - -
13
- - - 451 280 - - -
14
- - - 452 280 - - -
15
- - 10,000
-
2,000 280 - - -
BUSINESS FINANCE 9
IRR 2.59% 4.55% 8.36% 4.42% 5.01% 6.67% -8.25% 4.49%
Ranking 7 4 1 6 3 2 8 5
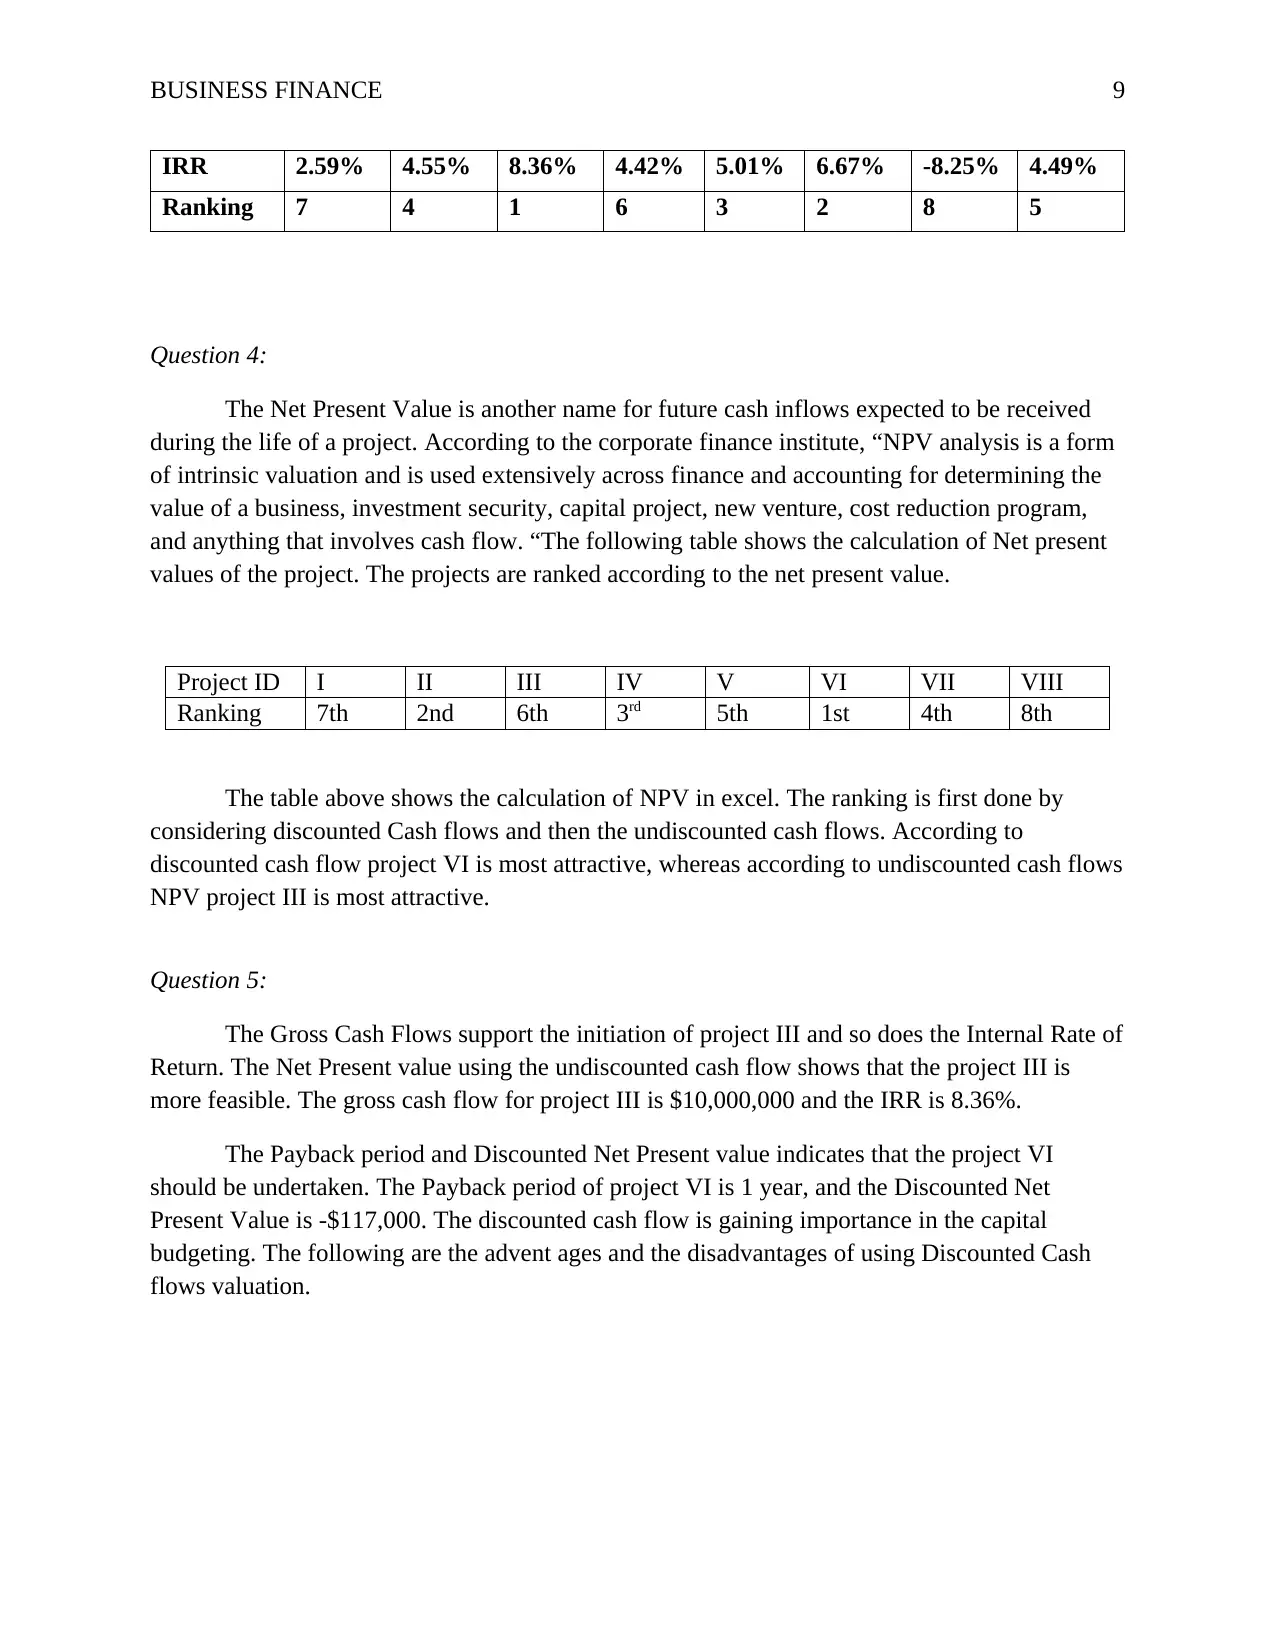
Question 4:
The Net Present Value is another name for future cash inflows expected to be received
during the life of a project. According to the corporate finance institute, “NPV analysis is a form
of intrinsic valuation and is used extensively across finance and accounting for determining the
value of a business, investment security, capital project, new venture, cost reduction program,
and anything that involves cash flow. “The following table shows the calculation of Net present
values of the project. The projects are ranked according to the net present value.
Project ID I II III IV V VI VII VIII
Ranking 7th 2nd 6th 3rd 5th 1st 4th 8th
The table above shows the calculation of NPV in excel. The ranking is first done by
considering discounted Cash flows and then the undiscounted cash flows. According to
discounted cash flow project VI is most attractive, whereas according to undiscounted cash flows
NPV project III is most attractive.
Question 5:
The Gross Cash Flows support the initiation of project III and so does the Internal Rate of
Return. The Net Present value using the undiscounted cash flow shows that the project III is
more feasible. The gross cash flow for project III is $10,000,000 and the IRR is 8.36%.
The Payback period and Discounted Net Present value indicates that the project VI
should be undertaken. The Payback period of project VI is 1 year, and the Discounted Net
Present Value is -$117,000. The discounted cash flow is gaining importance in the capital
budgeting. The following are the advent ages and the disadvantages of using Discounted Cash
flows valuation.
IRR 2.59% 4.55% 8.36% 4.42% 5.01% 6.67% -8.25% 4.49%
Ranking 7 4 1 6 3 2 8 5
Question 4:
The Net Present Value is another name for future cash inflows expected to be received
during the life of a project. According to the corporate finance institute, “NPV analysis is a form
of intrinsic valuation and is used extensively across finance and accounting for determining the
value of a business, investment security, capital project, new venture, cost reduction program,
and anything that involves cash flow. “The following table shows the calculation of Net present
values of the project. The projects are ranked according to the net present value.
Project ID I II III IV V VI VII VIII
Ranking 7th 2nd 6th 3rd 5th 1st 4th 8th
The table above shows the calculation of NPV in excel. The ranking is first done by
considering discounted Cash flows and then the undiscounted cash flows. According to
discounted cash flow project VI is most attractive, whereas according to undiscounted cash flows
NPV project III is most attractive.
Question 5:
The Gross Cash Flows support the initiation of project III and so does the Internal Rate of
Return. The Net Present value using the undiscounted cash flow shows that the project III is
more feasible. The gross cash flow for project III is $10,000,000 and the IRR is 8.36%.
The Payback period and Discounted Net Present value indicates that the project VI
should be undertaken. The Payback period of project VI is 1 year, and the Discounted Net
Present Value is -$117,000. The discounted cash flow is gaining importance in the capital
budgeting. The following are the advent ages and the disadvantages of using Discounted Cash
flows valuation.
⊘ This is a preview!⊘
Do you want full access?
Subscribe today to unlock all pages.
Trusted by 1+ million students worldwide
BUSINESS FINANCE 10
ADVANTAGES of DCF:
The closest estimate of intrinsic value of the business/asset can be said to be DCF
Valuation; it focuses on the fundamental building blocks of a business. This method of valuation
relies on Free Cash Flows. DCF is reliable, it helps eliminate the subjectivity in the accounting
policies. The risk of window dressing can be eliminated to some extent and increasing reliability
of the reported earnings. The FCF shows the true value left for the shareholders because it
considers the time value for money in real terms. Despite being relatively easier to easier to
calculate the other methods of valuation aren’t that reliable if the entire sector or market is over-
valued or under-valued. What makes DCF even more reliable as compared to the other methods
(Stephen, 2016)
DISADVANTAGES OF DCF:
When postulating persistent growth rate and discount rate, DCF valuation is vulnerable to
both. Even a slight adjustment of any variable will result in the wide fluctuation of DCF
valuation which will result in an inaccurate fair value.
DCF valuation is most effective only when there is a high level of confidence about
subsequent cash flows. Accurate forecast of sales, operating costs and capital investment
becomes difficult if the company’s operations lack visibility. While predicting future cash flows
is not easy, it is not remotely possible to just push them out continuously, which is mandatory for
DCF valuation. Therefore, DCF method is prone to error these inputs are not considered.
(Stephen, 2016)
A major criticism of Discounted Cash flow is that the last year value consists of a large
amount. Evan a little change in the final years’ value would have a material impact on the
valuation of a project. The Discounted cash flows demand a constant revision and vigilant
modification according to changes in external environment. The external environment as well as
the analysis of the management would lead to a change in fair value of a project. The discounted
cash flow Model should be used for long term investments and not the short-term investments.
That is so because the discounted cash flows help in long-term value creation.
Question 6
The mining company of Australia known as Rio Tinto is a large concern. It had $5.4
Billion as capital expenditure in 2018. It generated a cash of $11.8 Billion in 2018. Rio Tin
declared $13.5 Billion in cash returns to shareholders. The company completed the following
projects in 2018:
Paraphrase This Document
Need a fresh take? Get an instant paraphrase of this document with our AI Paraphraser
BUSINESS FINANCE 11
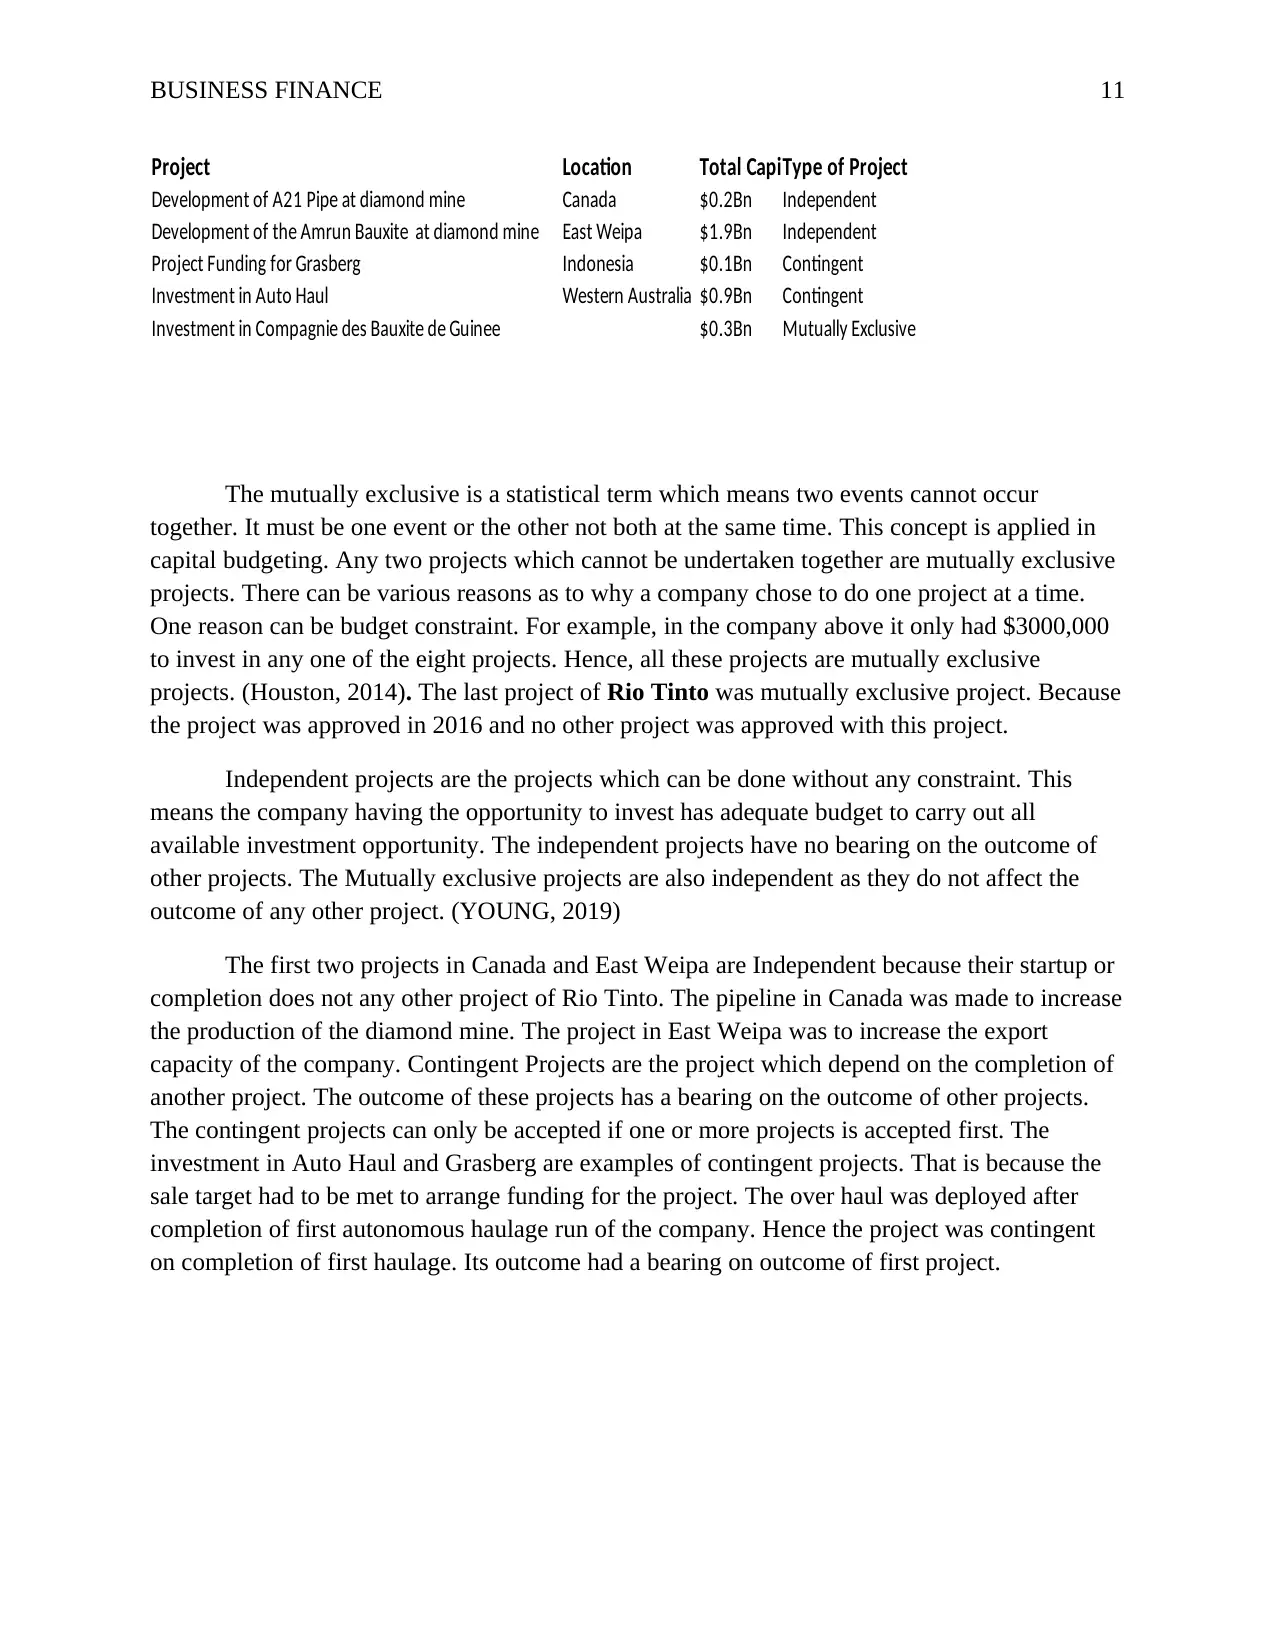
Project Location Total CapiType of Project
Development of A21 Pipe at diamond mine Canada $0.2Bn Independent
Development of the Amrun Bauxite at diamond mine East Weipa $1.9Bn Independent
Project Funding for Grasberg Indonesia $0.1Bn Contingent
Investment in Auto Haul Western Australia $0.9Bn Contingent
Investment in Compagnie des Bauxite de Guinee $0.3Bn Mutually Exclusive
The mutually exclusive is a statistical term which means two events cannot occur
together. It must be one event or the other not both at the same time. This concept is applied in
capital budgeting. Any two projects which cannot be undertaken together are mutually exclusive
projects. There can be various reasons as to why a company chose to do one project at a time.
One reason can be budget constraint. For example, in the company above it only had $3000,000
to invest in any one of the eight projects. Hence, all these projects are mutually exclusive
projects. (Houston, 2014). The last project of Rio Tinto was mutually exclusive project. Because
the project was approved in 2016 and no other project was approved with this project.
Independent projects are the projects which can be done without any constraint. This
means the company having the opportunity to invest has adequate budget to carry out all
available investment opportunity. The independent projects have no bearing on the outcome of
other projects. The Mutually exclusive projects are also independent as they do not affect the
outcome of any other project. (YOUNG, 2019)
The first two projects in Canada and East Weipa are Independent because their startup or
completion does not any other project of Rio Tinto. The pipeline in Canada was made to increase
the production of the diamond mine. The project in East Weipa was to increase the export
capacity of the company. Contingent Projects are the project which depend on the completion of
another project. The outcome of these projects has a bearing on the outcome of other projects.
The contingent projects can only be accepted if one or more projects is accepted first. The
investment in Auto Haul and Grasberg are examples of contingent projects. That is because the
sale target had to be met to arrange funding for the project. The over haul was deployed after
completion of first autonomous haulage run of the company. Hence the project was contingent
on completion of first haulage. Its outcome had a bearing on outcome of first project.
BUSINESS FINANCE 12
References
Fan, J., Furger, A. and Xiu, D., 2016. Incorporating global industrial classification standard into
portfolio allocation: A simple factor-based large covariance matrix estimator with high-
frequency data. Journal of Business & Economic Statistics, 34(4), pp.489-503. Data retrieved
from https://amstat.tandfonline.com/doi/abs/10.1080/07350015.2015.1052458
GICS., 2019. Global Industry Classification Standards. From the Official website of MSCI. Data
retrieved from
https://www.msci.com/documents/1296102/11185224/MSCI_GICS_Overview.pdf/cfdc73ec-
9704-1685-7742-96bf2c3ec699
https://finance.yahoo.com/quote/TLS.AX?p=TLS.AX&.tsrc=fin-srch
https://www.telstra.com.au/aboutus/our-company/present/purpose-values
Investsmart., 2019 Telstra Corporation Limited (TLS) – Research. From the official website of
Invetsmart. Data retrieved from https://www.investsmart.com.au/shares/asx-tls/telstra-
corporation-limited
Morningstar., 2019. Telstra Corp Ltd. Official Website of Morningstar. Data retrieved from
https://www.morningstar.com/stocks/xasx/tls/quote.html
Morningstar., 2019. Telstra Corp Ltd: Valuation. Official Website of Morningstar. Data retrieved
from https://www.morningstar.com/stocks/xasx/tls/quote.html
Telstra., 2019. Telstra Purpose and Values. From the official website of Telstra. Data retrieved
from
Williams, R., 2016. Understanding and interpreting generalized ordered logit models. The
Journal of Mathematical Sociology, 40(1), pp.7-20. Data retrieved from
https://www3.nd.edu/~rwilliam/rwpubs/UnderstandingGologit2016.pdf
Yahoo Finance., 2019. Telstra Corp Ltd: Summary. Official website of Yahoo Finance. Data
retrieved from
Yahoo Finance., 2019. TPG Telecom Limited: Summary. Official website of Yahoo Finance.
Data retrieved from https://finance.yahoo.com/quote/TPM.AX?p=TPM.AX&.tsrc=fin-srch
Yahoo Finance., 2019.Vodafone Group Plc: Summary. Official website of Yahoo Finance. Data
retrieved from https://finance.yahoo.com/quote/VOD?p=VOD&.tsrc=fin-srch
⊘ This is a preview!⊘
Do you want full access?
Subscribe today to unlock all pages.
Trusted by 1+ million students worldwide
1 out of 12

Your All-in-One AI-Powered Toolkit for Academic Success.
+13062052269
info@desklib.com
Available 24*7 on WhatsApp / Email
![[object Object]](/_next/static/media/star-bottom.7253800d.svg)
Unlock your academic potential
Copyright © 2020–2026 A2Z Services. All Rights Reserved. Developed and managed by ZUCOL.