Business Finance Report: Melbourne Housing, Income, and Loan Analysis
VerifiedAdded on 2021/06/17
|12
|2693
|26
Report
AI Summary
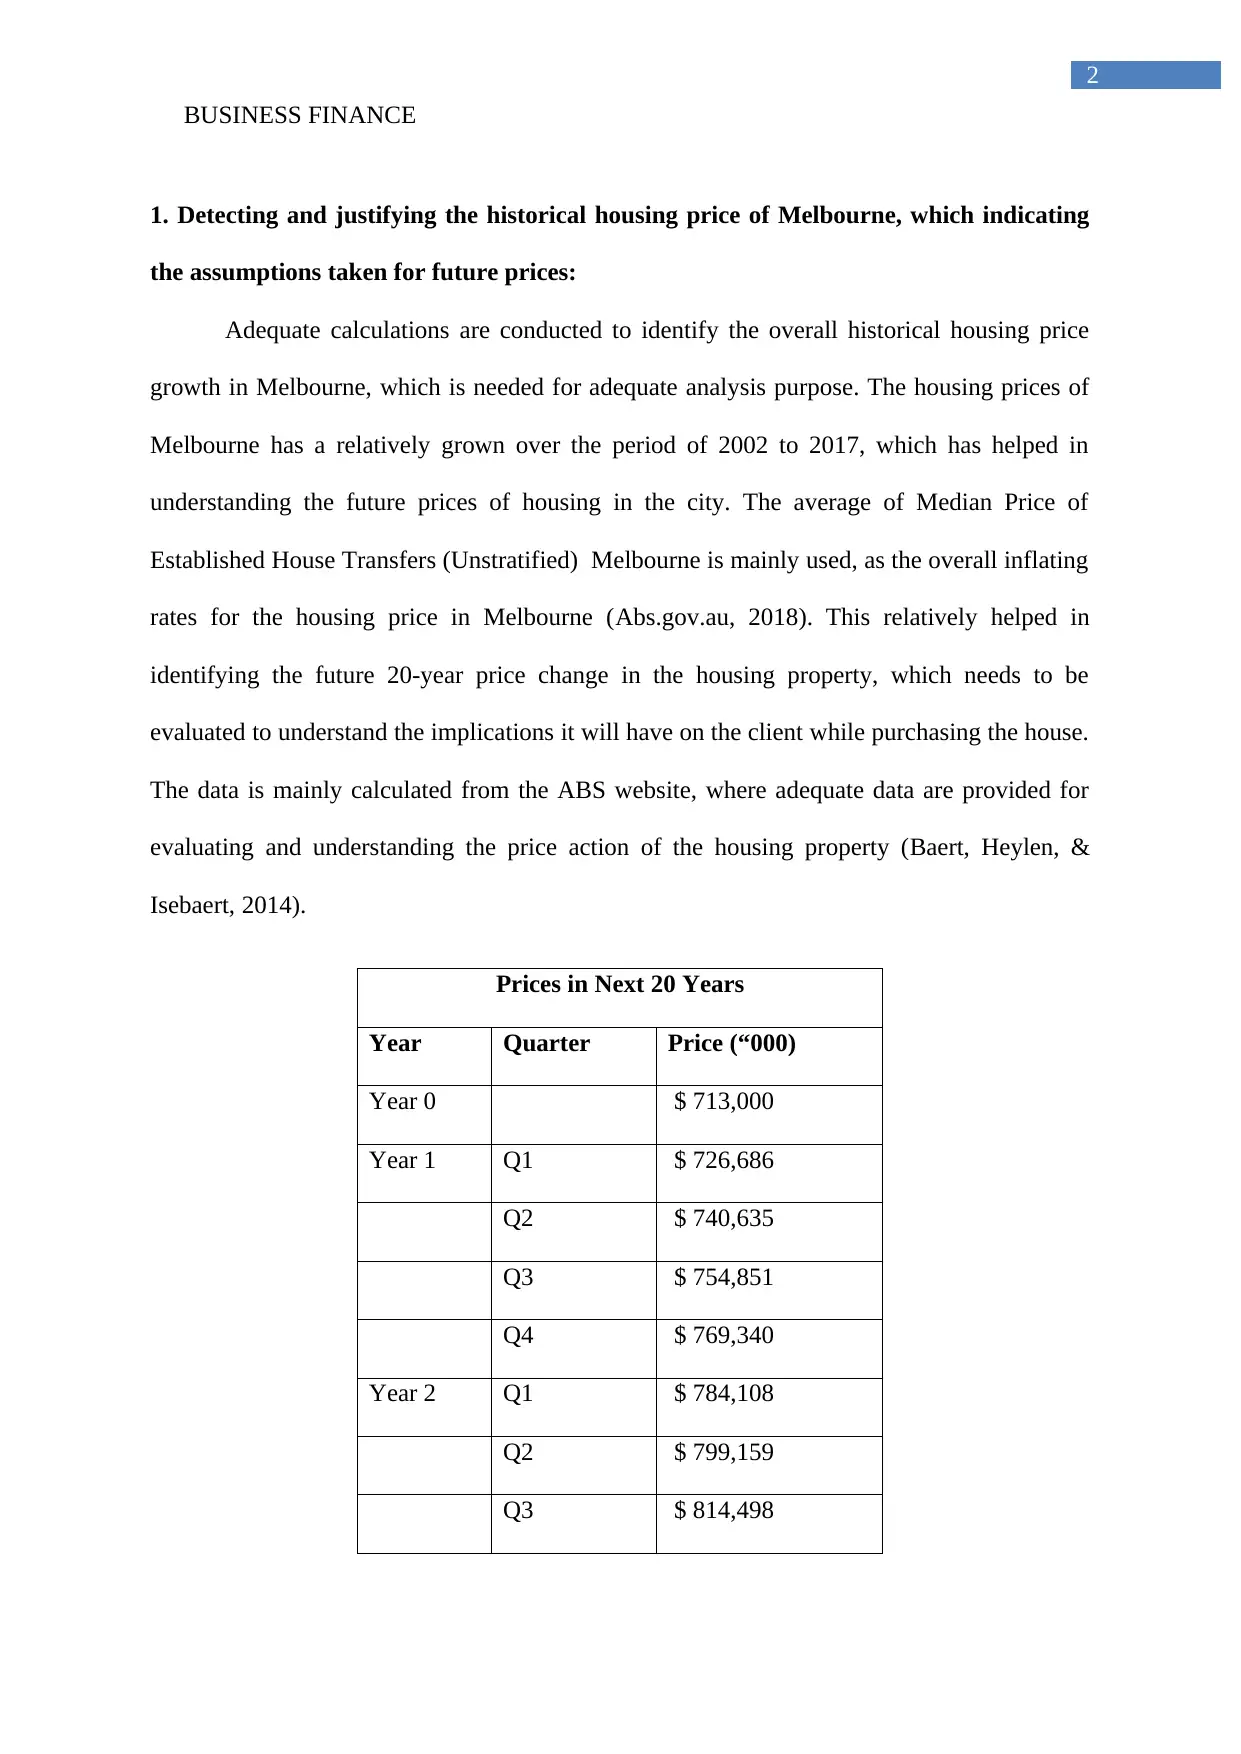
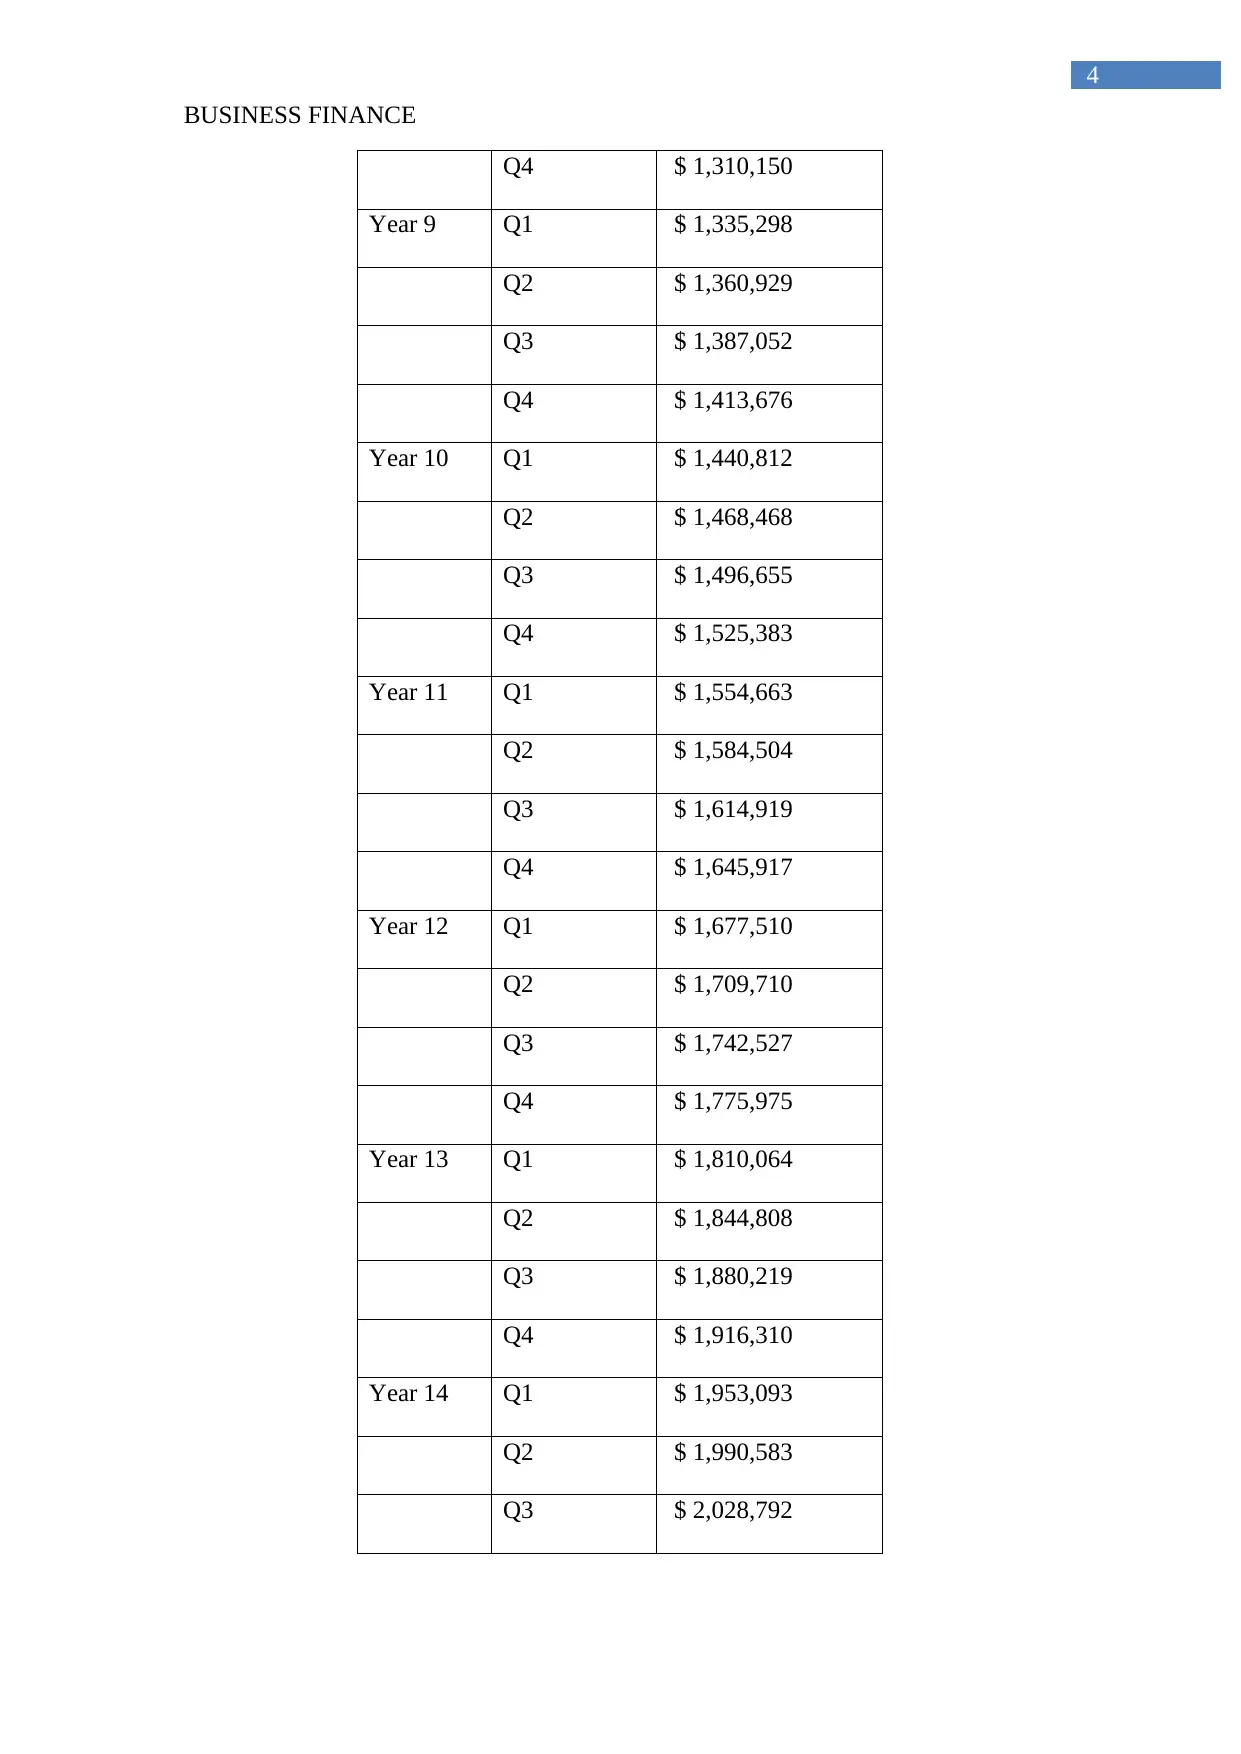
This report provides a comprehensive analysis of the Melbourne housing market, examining historical housing price growth from 2002 to 2017 and projecting future prices. It evaluates historical income data from 1994 to 2016, incorporating inflation to forecast income growth. The report incl...

Running head: BUSINESS FINANCE
Business Finance
Name of the Student:
Name of the University:
Authors Note:
Business Finance
Name of the Student:
Name of the University:
Authors Note:
Secure Best Marks with AI Grader
Need help grading? Try our AI Grader for instant feedback on your assignments.

BUSINESS FINANCE
1
Table of Contents
1. Detecting and justifying the historical housing price of Melbourne, which indicating the
assumptions taken for future prices:..........................................................................................2
2. Evaluating the historical income data of Melbourne, while justifying the assumptions for
the income data:.........................................................................................................................6
3. Detecting the net income by using ATO calculator, while detecting the home loan rate and
maximum amount that the cline could borrow:.........................................................................8
4. Calculating the stamp duty situated with property purchase, while detecting the house price
client can afford:........................................................................................................................9
5. Calculating and presenting a financial plan with upfront payment of 20% and upfront
payment of 5% for the loan:.....................................................................................................10
6. Calculating whether increment in interest payment can hamper interest payment capability
of the lender:............................................................................................................................12
7. Providing a relevant plan with detailed risk entailed by the assumption made for the
financial plan:...........................................................................................................................12
Reference and Bibliography:....................................................................................................14

BUSINESS FINANCE
2
1. Detecting and justifying the historical housing price of Melbourne, which indicating
the assumptions taken for future prices:
Adequate calculations are conducted to identify the overall historical housing price
growth in Melbourne, which is needed for adequate analysis purpose. The housing prices of
Melbourne has a relatively grown over the period of 2002 to 2017, which has helped in
understanding the future prices of housing in the city. The average of Median Price of
Established House Transfers (Unstratified) Melbourne is mainly used, as the overall inflating
rates for the housing price in Melbourne (Abs.gov.au, 2018). This relatively helped in
identifying the future 20-year price change in the housing property, which needs to be
evaluated to understand the implications it will have on the client while purchasing the house.
The data is mainly calculated from the ABS website, where adequate data are provided for
evaluating and understanding the price action of the housing property (Baert, Heylen, &
Isebaert, 2014).
Prices in Next 20 Years
Year Quarter Price (“000)
Year 0 $ 713,000
Year 1 Q1 $ 726,686
Q2 $ 740,635
Q3 $ 754,851
Q4 $ 769,340
Year 2 Q1 $ 784,108
Q2 $ 799,159
Q3 $ 814,498

BUSINESS FINANCE
3
Q4 $ 830,132
Year 3 Q1 $ 846,067
Q2 $ 862,307
Q3 $ 878,859
Q4 $ 895,728
Year 4 Q1 $ 912,922
Q2 $ 930,445
Q3 $ 948,305
Q4 $ 966,508
Year 5 Q1 $ 985,060
Q2 $ 1,003,968
Q3 $ 1,023,239
Q4 $ 1,042,880
Year 6 Q1 $ 1,062,898
Q2 $ 1,083,300
Q3 $ 1,104,094
Q4 $ 1,125,287
Year 7 Q1 $ 1,146,886
Q2 $ 1,168,901
Q3 $ 1,191,338
Q4 $ 1,214,205
Year 8 Q1 $ 1,237,512
Q2 $ 1,261,266
Q3 $ 1,285,476
Secure Best Marks with AI Grader
Need help grading? Try our AI Grader for instant feedback on your assignments.

BUSINESS FINANCE
4
Q4 $ 1,310,150
Year 9 Q1 $ 1,335,298
Q2 $ 1,360,929
Q3 $ 1,387,052
Q4 $ 1,413,676
Year 10 Q1 $ 1,440,812
Q2 $ 1,468,468
Q3 $ 1,496,655
Q4 $ 1,525,383
Year 11 Q1 $ 1,554,663
Q2 $ 1,584,504
Q3 $ 1,614,919
Q4 $ 1,645,917
Year 12 Q1 $ 1,677,510
Q2 $ 1,709,710
Q3 $ 1,742,527
Q4 $ 1,775,975
Year 13 Q1 $ 1,810,064
Q2 $ 1,844,808
Q3 $ 1,880,219
Q4 $ 1,916,310
Year 14 Q1 $ 1,953,093
Q2 $ 1,990,583
Q3 $ 2,028,792

BUSINESS FINANCE
5
Q4 $ 2,067,734
Year 15 Q1 $ 2,107,424
Q2 $ 2,147,876
Q3 $ 2,189,104
Q4 $ 2,231,124
Year 16 Q1 $ 2,273,950
Q2 $ 2,317,598
Q3 $ 2,362,084
Q4 $ 2,407,424
Year 17 Q1 $ 2,453,634
Q2 $ 2,500,731
Q3 $ 2,548,733
Q4 $ 2,597,655
Year 18 Q1 $ 2,647,517
Q2 $ 2,698,336
Q3 $ 2,750,130
Q4 $ 2,802,918
Year 19 Q1 $ 2,856,720
Q2 $ 2,911,554
Q3 $ 2,967,441
Q4 $ 3,024,401
Year 20 Q1 $ 3,082,454
Q2 $ 3,141,621
Q3 $ 3,201,924

BUSINESS FINANCE
6
Q4 $ 3,263,385
2. Evaluating the historical income data of Melbourne, while justifying the assumptions
for the income data:
Time Income Yearly Income Income Growth
1994–95 $ 1,340 $ 69,680
1995–96 $ 1,297 $ 67,444 -3.2090%
1996–97 $ 1,342 $ 69,784 3.4695%
1997–98 $ 1,400 $ 72,800 4.3219%
1999–2000 $ 1,534 $ 79,768 9.5714%
2000–01 $ 1,475 $ 76,700 -3.8462%
2002–03 $ 1,525 $ 79,300 3.3898%
2003–04(a) $ 1,582 $ 82,264 3.7377%
2005–06(a) $ 1,681 $ 87,412 6.2579%
2007–08(a) $ 1,967 $ 102,284 17.0137%
2009–10(a) $ 1,870 $ 97,240 -4.9314%
2011–12(a) $ 1,914 $ 99,528 2.3529%
2013–14(a) $ 2,016 $ 104,832 5.3292%
2015–16(a) $ 2,055 $ 106,860 1.9345%
Average income Growth rate 3.4917%
Inflation rate 1.9200%
Growth rate in income 3.5587%
Paraphrase This Document
Need a fresh take? Get an instant paraphrase of this document with our AI Paraphraser

BUSINESS FINANCE
7
The above table a relatively represents the overall historical growth in income which
is calculated from 1994 to 2016. This overall historical data has eventually helped in
protecting the increment in income that will allow the client to obtain the Austrian dream.
The average growth rate in income has been calculated for the past years while adequate
incrementation is used by implementing the inflation rate on the average growth rate. This
relatively has been understanding the level of growth in income that will incur in the next 10
years. This determination of the income is relatively viable approach which would eventually
help in understanding the level of mortgage exposure the client could have in future.
Moreover, it will also help in understanding when the client would be able to purchase the
Austrian Dreamhouse. Growth rate of 3.5587% is used on the yearly income of the client to
understand its growth over the period of 10 years which is effectively depicted in the
following table (Genworth.com.au, 2018).
Time Future 10 years growth rate
Year 0 $ 80,000
Year 1 $ 82,847
Year 2 $ 85,740
Year 3 $ 88,734
Year 4 $ 91,832
Year 5 $ 95,038
Year 6 $ 98,357
Year 7 $ 101,791
Year 8 $ 105,345
Year 9 $ 109,024
Year 10 $ 112,831

BUSINESS FINANCE
8
3. Detecting the net income by using ATO calculator, while detecting the home loan rate
and maximum amount that the cline could borrow:
Particulars Monthly Yearly
Annual Salary $ 6,667 $ 80,000
Expenses
Amenities (Food and Transport) $ 1,850 $ 22,200
Rent $ 1,250 $ 15,000
Living Expense $ 3,100 $ 37,200
Tax $ 17,547
Savings $ 2,104 $ 25,253
Particulars Values
Home Loan rate 4.50%
Time 30
Max LVR 80%
Property Price $ 374,851
Maximum Amount borrowed $ 299,598
Initial deposit to the bank $ 75,253
The above tables relatively represent the overall Savings and maximum borrowed
money which will be allowed to the client. the client will eventually save around $2,104 on
monthly basis which could be used for the mortgage payments. However, the calculations of
loan requirements are relatively indicating that a property value of $374,857 would only be
allowed to the client due to the low initial deposit to the bank. Hence, a small property can be

BUSINESS FINANCE
9
bought by the client with the value of $374,857 and about this payment of $2,104 (McCollum
& Upton, 2016).
4. Calculating the stamp duty situated with property purchase, while detecting the
house price client can afford:
Without Mortgage Premium
Particulars Values
Property $ 370,000.00
Total Stamp Duty value $ 1,076.00
Total cost $ 371,076.00
Bank loan $ 74,000.00
Savings $ 75,253.00
With Mortgage Premium
Particulars Values
Property $ 600,000.00
Total Stamp Duty value $ 1,614.00
Current savings $ 75,253.00
Initial payment $ 50,000.00
Insurance premium $ 20,790.00
Total Bank deposit $ 70,790.00
Savings $ 4,463.00
Secure Best Marks with AI Grader
Need help grading? Try our AI Grader for instant feedback on your assignments.

BUSINESS FINANCE
10
The above two tables relatively indicate the overall Property value that will be
obtained by the client when mortgage premium is not used and when mortgage premium is
used. From the valuation the property value of only $ 370,000 can be obtained by the client,
as the overall savings is at the levels of $ 75,253 (Living, 2018). Moreover, the total LVR is
at the levels of 80%, which has allowed the client to effectively accumulate the property with
the value of $ 370,000. However, the property value with the mortgage premium is at the
levels of $ 600,000, where the client pays adequate insurance premium to obtain the loan for
the property. Total LVR of 92% is mainly provided by the bank for the property with the
mortgage premium.
5. Calculating and presenting a financial plan with upfront payment of 20% and
upfront payment of 5% for the loan:
Year Property price Savings Target 20% upfront Stamp duty Difference
0 $ 713,000 $ 75,253 $ 142,600 $ 39,729 $ (107,076)
1 $ 726,686 $ 101,696 $ 145,337 $ 40,492 $ (84,133)
2 $ 740,635 $ 129,343 $ 148,127 $ 41,269 $ (60,053)
3 $ 754,851 $ 158,171 $ 150,970 $ 42,061 $ (34,860)
4 $ 769,340 $ 188,175 $ 153,868 $ 42,868 $ (8,562)
5 $ 784,108 $ 219,406 $ 156,822 $ 43,691 $ 18,893
6 $ 799,159 $ 251,920 $ 159,832 $ 44,530 $ 47,558
7 $ 814,498 $ 285,773 $ 162,900 $ 45,385 $ 77,489
8 $ 830,132 $ 321,026 $ 166,026 $ 46,256 $ 108,744
9 $ 846,067 $ 357,739 $ 169,213 $ 47,144 $ 141,382
10 $ 862,307 $ 395,978 $ 172,461 $ 48,049 $ 175,468
11 $ 878,859 $ 435,807 $ 175,772 $ 48,971 $ 211,064

BUSINESS FINANCE
11
12 $ 895,728 $ 477,297 $ 179,146 $ 49,911 $ 248,241
13 $ 912,922 $ 520,519 $ 182,584 $ 50,869 $ 287,066
14 $ 930,445 $ 565,548 $ 186,089 $ 51,845 $ 327,614
15 $ 948,305 $ 612,461 $ 189,661 $ 52,840 $ 369,960
16 $ 966,508 $ 661,339 $ 193,302 $ 53,855 $ 414,183
Year Property price Savings
Target
5% upfront Insurance
premium
Stamp duty Amount
0 $ 713,000 $ 75,253 $ 35,650 $ 30,588 $ 39,729 $ (30,713)
1 $ 726,686 $ 101,696 $ 36,334 $ 31,175 $ 40,492 $ (6,305)
2 $ 740,635 $ 129,343 $ 37,032 $ 31,773 $ 41,269 $ 19,269
3 $ 754,851 $ 158,171 $ 37,743 $ 32,383 $ 42,061 $ 45,985
4 $ 769,340 $ 188,175 $ 38,467 $ 33,005 $ 42,868 $ 73,835
5 $ 784,108 $ 219,406 $ 39,205 $ 33,638 $ 43,691 $ 102,871
6 $ 799,159 $ 251,920 $ 39,958 $ 34,284 $ 44,530 $ 133,148
7 $ 814,498 $ 285,773 $ 40,725 $ 34,942 $ 45,385 $ 164,722
The calculation of tables relatively indicates the duration where adequate investments
on the property can be conducted with a 20% upfront payment by the client. equation loan
can be accumulated during the fifth year where the difference between income and expenses
as positive. On the other hand, the case scenario with 5% upfront payment relatively indicates
the use of insurance premium which would allow the client to obtain the property by year 3.
this would eventually help in improving the level of income that could be generated from
operations (Bankrate.com, 2018).
1 out of 12
Related Documents

Your All-in-One AI-Powered Toolkit for Academic Success.
+13062052269
info@desklib.com
Available 24*7 on WhatsApp / Email
Unlock your academic potential
© 2024 | Zucol Services PVT LTD | All rights reserved.