HC2091 Business Finance: Comparing Financials of MYOB and Xero
VerifiedAdded on 2023/06/07
|18
|3961
|61
Report
AI Summary
This report provides a comprehensive financial analysis of two Australian companies, MYOB Group Limited and Xero Limited. It begins with an introduction and a description of each company, outlining their core activities and competitive advantages. The analysis then delves into the calculation and interpretation of various financial performance ratios, including short-term and long-term solvency ratios, asset utilization ratios, profitability ratios, and market value ratios. The report compares the share price movements of both companies with the ASX S&P 200, followed by a share valuation using the Constant Dividend Growth Rate model. Finally, the report concludes by summarizing the findings and comparing the financial performance of both companies over the past two years.
RUNNING HEAD: BUSINESS FINANCE
Financial analysis
Financial analysis
Paraphrase This Document
Need a fresh take? Get an instant paraphrase of this document with our AI Paraphraser
Business finance 2
Contents
Introduction.................................................................................................................................................3
Description of the companies......................................................................................................................3
MYOB Group Limited............................................................................................................................3
Xero Limited...........................................................................................................................................4
Calculation and analysis of performance ratios...........................................................................................5
Short term solvency.................................................................................................................................5
Long term solvency.................................................................................................................................6
Asset utilization.......................................................................................................................................8
Profitability ratios....................................................................................................................................9
Market value ratios................................................................................................................................11
Graphs and comparison of share price movements....................................................................................13
Share valuation..........................................................................................................................................14
Conclusion.................................................................................................................................................15
References.................................................................................................................................................16
Business finance 3
Introduction
The report discusses the financial performance of two Australian companies named as MYOB
Group Ltd and Xero Limited. It covers all the aspects from measuring the performance with the
help of key ratios to comparing the value of companies’ stock with its current share price. The
report provides a brief overview of both the companies, outlining their core activities,
competitive advantage and their historical performance. Further, various categories of
performance ratios are calculated which evaluates and compares the financial position of both
companies for the past two years. In the later part, the report explains the share price movements
of both the entities and compares the same with the fluctuations in the market prices of ASX
S&P 200. In addition, the report also explains the calculation of companies’ stock by using
Constant Dividend Growth Rate model and compares the value with its recent market price of
the stock. At last, a conclusion is provided stating the findings of the analysis and concluding
that which company has performed better in the past two years.
Description of the companies
MYOB Group Limited
Mind Your Own Business (MYOB) is an Australia based multinational company engaged in
providing various types of accounting software services to small and medium sized entities. The
company was found in 1980 by a team of developers working at Teleware Inc. and got listed on
ASX on 9 July 1999. The company develops and publishes software in New Zealand and
Australia. It operates its business through three segments named as Payment Solutions, Clients
and Partners and Enterprise Solutions. The segment payment solutions offer various types of
⊘ This is a preview!⊘
Do you want full access?
Subscribe today to unlock all pages.
Trusted by 1+ million students worldwide
Business finance 4
services like payment gateway services, merchant services facilities, fraud management and
invoice payments. Clients and Partners segment payroll, tax and other management solutions to
SMEs and provide advisory services to the business. The division of Enterprise Solutions
provides services related to business management software like enterprise resource planning,
payroll and human capital management. Currently, the company is the leading provider of
business management solutions across the country (Bloomberg. 2018).
Xero Limited
It is software as a service (SaaS) company operating its business in Australia, United States and
other countries. The entity deals with offering a platform for conducting online accounting
services for the businesses and their advisors. There are two segments of the company through
which it operates and they are Australia and New Zealand (ANZ), and International. Its cloud
accounting software named as Xero for small businesses is provided in ANZ and United
Kingdom. The software contains over 400 add-on applications that allow individuals to
customize Xero as per their needs. It has various features including payments, reports, invoicing,
cash flow, support and mobile. With help of such features, it offers online accounting training for
small and medium size businesses as well as provides access to the real-time account
information. Xero was founded in 2006 and it is one of the fastest growing software on
international basis. It employs more than 2000 people and is considered as the World’s Most
Innovative Growth Company in 2014 and 2015 according to Forbes. It is publically listed on
ASX and is traded with the symbol XRO.AX (Reuters. 2018).
Being operating in the same market, both the companies give each other tough competition as
they perform their functions in same industry. The competitive advantage of MYOB was gained
by its acquisition of BankLink, a New Zealand accounting solution provider. This deal was the
Paraphrase This Document
Need a fresh take? Get an instant paraphrase of this document with our AI Paraphraser
Business finance 5
strategic move of the company in order to expand its cloud computing space and business
management solutions (MYOB. 2013).
Calculation and analysis of performance ratios
Short term solvency
Current ratio
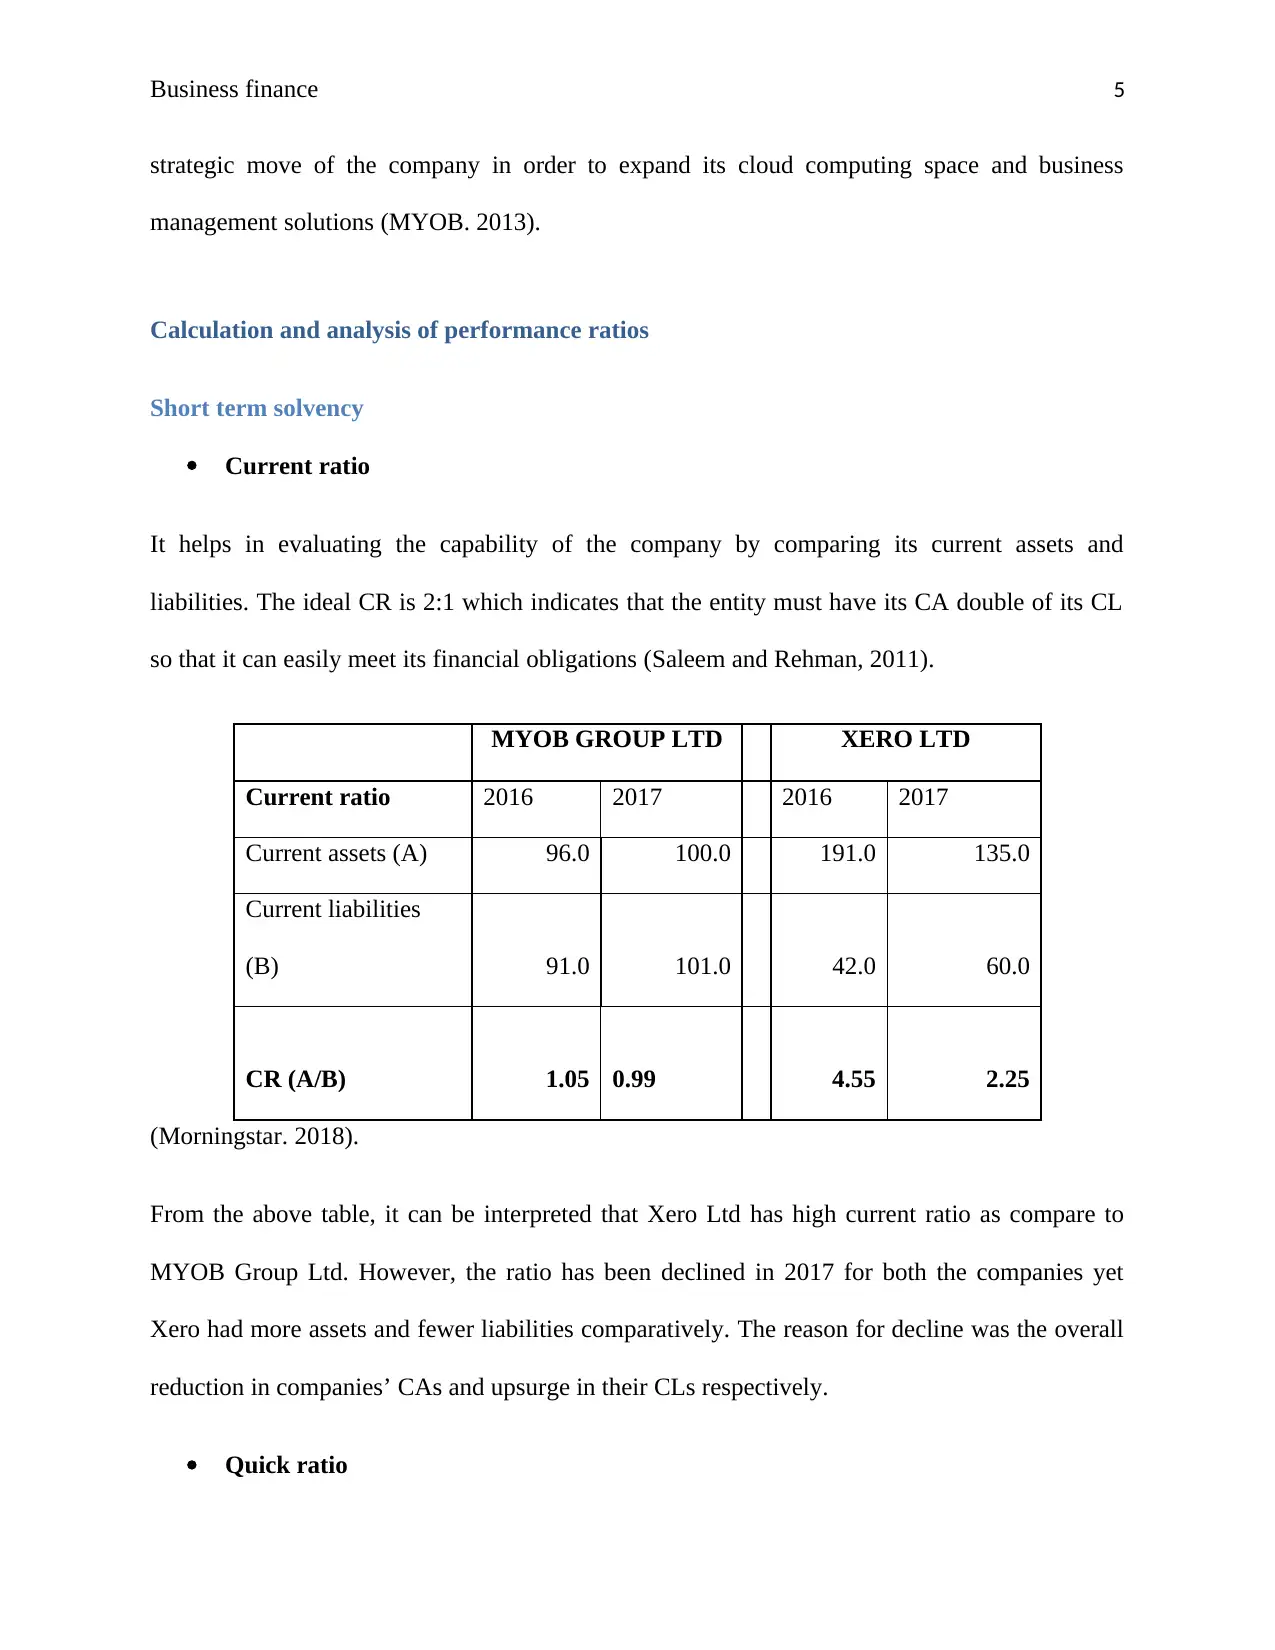
It helps in evaluating the capability of the company by comparing its current assets and
liabilities. The ideal CR is 2:1 which indicates that the entity must have its CA double of its CL
so that it can easily meet its financial obligations (Saleem and Rehman, 2011).
MYOB GROUP LTD XERO LTD
Current ratio 2016 2017 2016 2017
Current assets (A) 96.0 100.0 191.0 135.0
Current liabilities
(B) 91.0 101.0 42.0 60.0
CR (A/B) 1.05 0.99 4.55 2.25
(Morningstar. 2018).
From the above table, it can be interpreted that Xero Ltd has high current ratio as compare to
MYOB Group Ltd. However, the ratio has been declined in 2017 for both the companies yet
Xero had more assets and fewer liabilities comparatively. The reason for decline was the overall
reduction in companies’ CAs and upsurge in their CLs respectively.
Quick ratio
strategic move of the company in order to expand its cloud computing space and business
management solutions (MYOB. 2013).
Calculation and analysis of performance ratios
Short term solvency
Current ratio
It helps in evaluating the capability of the company by comparing its current assets and
liabilities. The ideal CR is 2:1 which indicates that the entity must have its CA double of its CL
so that it can easily meet its financial obligations (Saleem and Rehman, 2011).
MYOB GROUP LTD XERO LTD
Current ratio 2016 2017 2016 2017
Current assets (A) 96.0 100.0 191.0 135.0
Current liabilities
(B) 91.0 101.0 42.0 60.0
CR (A/B) 1.05 0.99 4.55 2.25
(Morningstar. 2018).
From the above table, it can be interpreted that Xero Ltd has high current ratio as compare to
MYOB Group Ltd. However, the ratio has been declined in 2017 for both the companies yet
Xero had more assets and fewer liabilities comparatively. The reason for decline was the overall
reduction in companies’ CAs and upsurge in their CLs respectively.
Quick ratio
Business finance 6
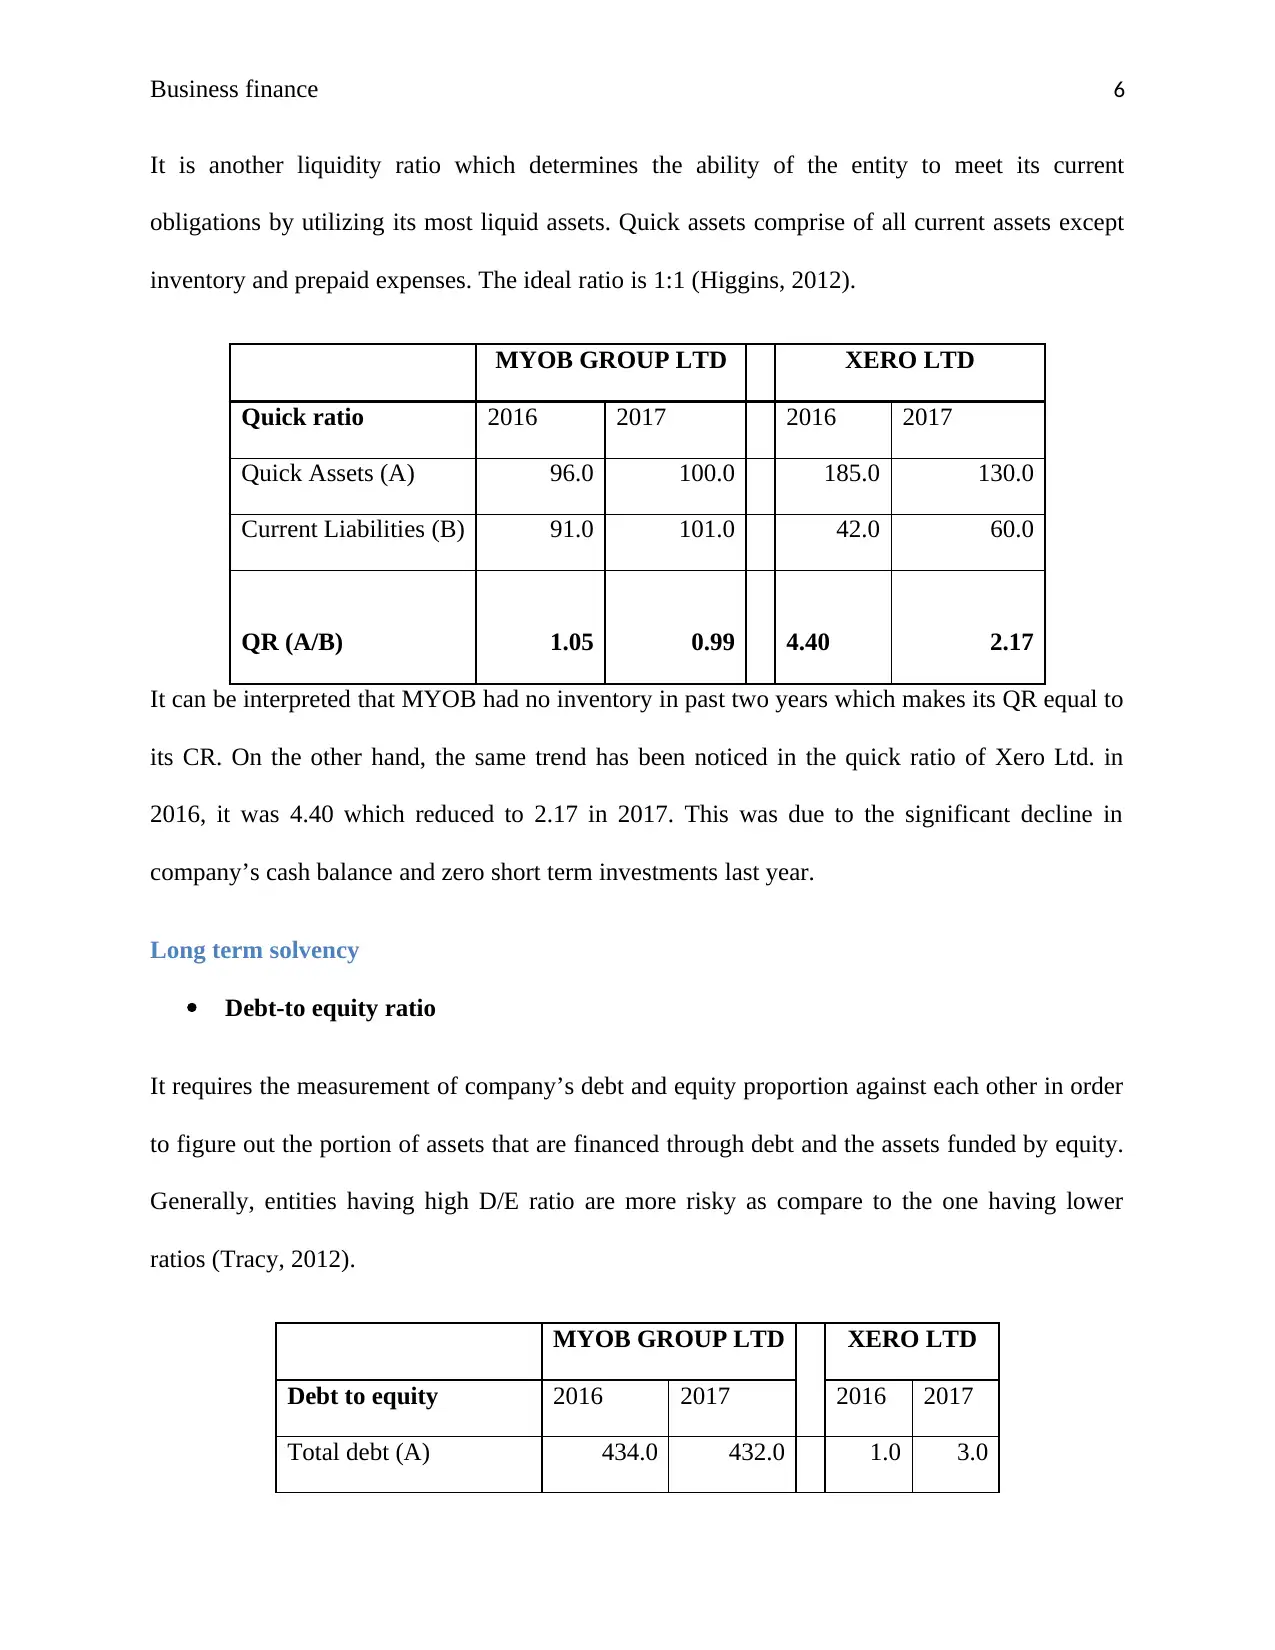
It is another liquidity ratio which determines the ability of the entity to meet its current
obligations by utilizing its most liquid assets. Quick assets comprise of all current assets except
inventory and prepaid expenses. The ideal ratio is 1:1 (Higgins, 2012).
MYOB GROUP LTD XERO LTD
Quick ratio 2016 2017 2016 2017
Quick Assets (A) 96.0 100.0 185.0 130.0
Current Liabilities (B) 91.0 101.0 42.0 60.0
QR (A/B) 1.05 0.99 4.40 2.17
It can be interpreted that MYOB had no inventory in past two years which makes its QR equal to
its CR. On the other hand, the same trend has been noticed in the quick ratio of Xero Ltd. in
2016, it was 4.40 which reduced to 2.17 in 2017. This was due to the significant decline in
company’s cash balance and zero short term investments last year.
Long term solvency
Debt-to equity ratio
It requires the measurement of company’s debt and equity proportion against each other in order
to figure out the portion of assets that are financed through debt and the assets funded by equity.
Generally, entities having high D/E ratio are more risky as compare to the one having lower
ratios (Tracy, 2012).
MYOB GROUP LTD XERO LTD
Debt to equity 2016 2017 2016 2017
Total debt (A) 434.0 432.0 1.0 3.0
⊘ This is a preview!⊘
Do you want full access?
Subscribe today to unlock all pages.
Trusted by 1+ million students worldwide
Business finance 7
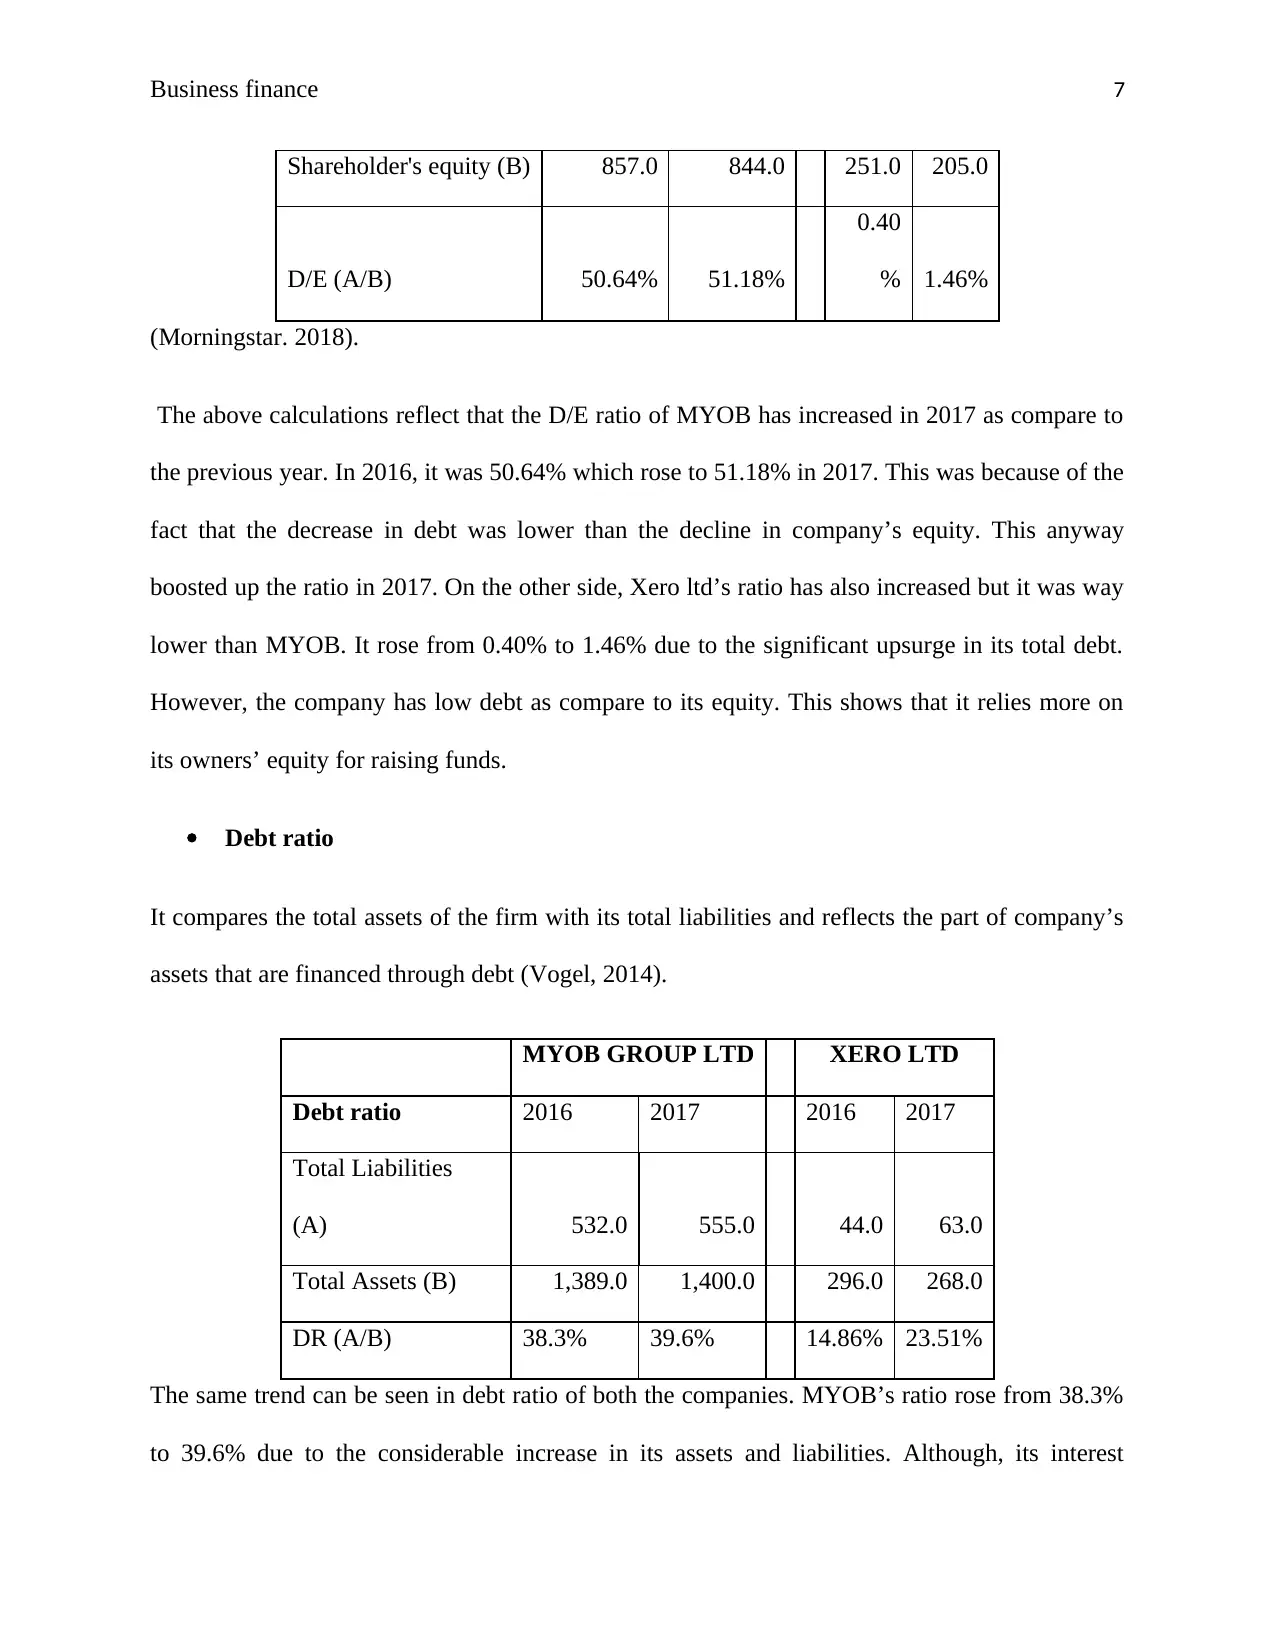
Shareholder's equity (B) 857.0 844.0 251.0 205.0
D/E (A/B) 50.64% 51.18%
0.40
% 1.46%
(Morningstar. 2018).
The above calculations reflect that the D/E ratio of MYOB has increased in 2017 as compare to
the previous year. In 2016, it was 50.64% which rose to 51.18% in 2017. This was because of the
fact that the decrease in debt was lower than the decline in company’s equity. This anyway
boosted up the ratio in 2017. On the other side, Xero ltd’s ratio has also increased but it was way
lower than MYOB. It rose from 0.40% to 1.46% due to the significant upsurge in its total debt.
However, the company has low debt as compare to its equity. This shows that it relies more on
its owners’ equity for raising funds.
Debt ratio
It compares the total assets of the firm with its total liabilities and reflects the part of company’s
assets that are financed through debt (Vogel, 2014).
MYOB GROUP LTD XERO LTD
Debt ratio 2016 2017 2016 2017
Total Liabilities
(A) 532.0 555.0 44.0 63.0
Total Assets (B) 1,389.0 1,400.0 296.0 268.0
DR (A/B) 38.3% 39.6% 14.86% 23.51%
The same trend can be seen in debt ratio of both the companies. MYOB’s ratio rose from 38.3%
to 39.6% due to the considerable increase in its assets and liabilities. Although, its interest
Paraphrase This Document
Need a fresh take? Get an instant paraphrase of this document with our AI Paraphraser
Business finance 8
bearing borrowings reduced in 2017 but its total non-current liabilities has shown an upsurge
which ultimately affected the ratio. In case of Xero Ltd., there was an upward trend in the ratio
and it increased from 14.86% to 23.51%. This was due to a significant upsurge in company’s
long term borrowings from $1 million to $3 million in 2017. It boosted up the ratio to a great
extent.
Asset utilization
Receivable turnover ratio
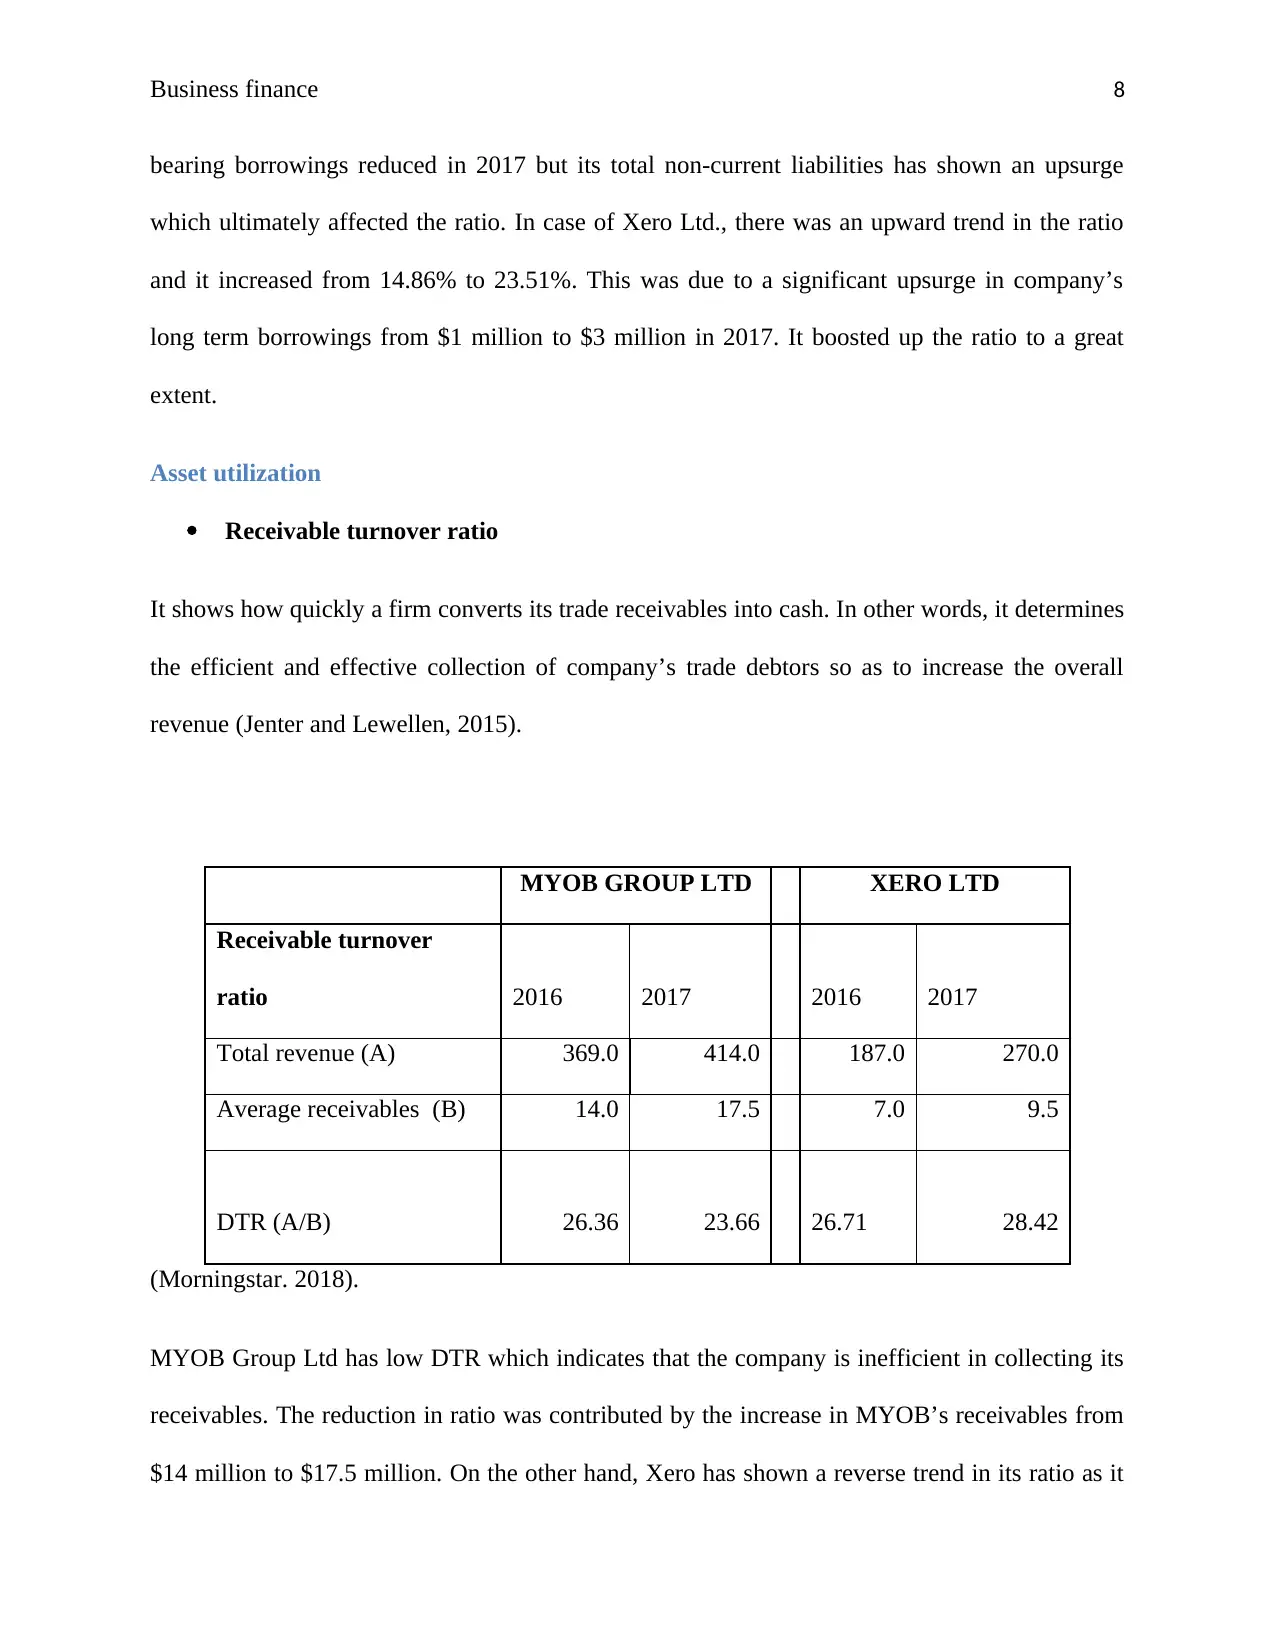
It shows how quickly a firm converts its trade receivables into cash. In other words, it determines
the efficient and effective collection of company’s trade debtors so as to increase the overall
revenue (Jenter and Lewellen, 2015).
MYOB GROUP LTD XERO LTD
Receivable turnover
ratio 2016 2017 2016 2017
Total revenue (A) 369.0 414.0 187.0 270.0
Average receivables (B) 14.0 17.5 7.0 9.5
DTR (A/B) 26.36 23.66 26.71 28.42
(Morningstar. 2018).
MYOB Group Ltd has low DTR which indicates that the company is inefficient in collecting its
receivables. The reduction in ratio was contributed by the increase in MYOB’s receivables from
$14 million to $17.5 million. On the other hand, Xero has shown a reverse trend in its ratio as it
bearing borrowings reduced in 2017 but its total non-current liabilities has shown an upsurge
which ultimately affected the ratio. In case of Xero Ltd., there was an upward trend in the ratio
and it increased from 14.86% to 23.51%. This was due to a significant upsurge in company’s
long term borrowings from $1 million to $3 million in 2017. It boosted up the ratio to a great
extent.
Asset utilization
Receivable turnover ratio
It shows how quickly a firm converts its trade receivables into cash. In other words, it determines
the efficient and effective collection of company’s trade debtors so as to increase the overall
revenue (Jenter and Lewellen, 2015).
MYOB GROUP LTD XERO LTD
Receivable turnover
ratio 2016 2017 2016 2017
Total revenue (A) 369.0 414.0 187.0 270.0
Average receivables (B) 14.0 17.5 7.0 9.5
DTR (A/B) 26.36 23.66 26.71 28.42
(Morningstar. 2018).
MYOB Group Ltd has low DTR which indicates that the company is inefficient in collecting its
receivables. The reduction in ratio was contributed by the increase in MYOB’s receivables from
$14 million to $17.5 million. On the other hand, Xero has shown a reverse trend in its ratio as it
Business finance 9
rose from 26.71 times to 28.42 times. This indicates that company is good at collecting its
debtors and the same has been reflected by its cash balance.
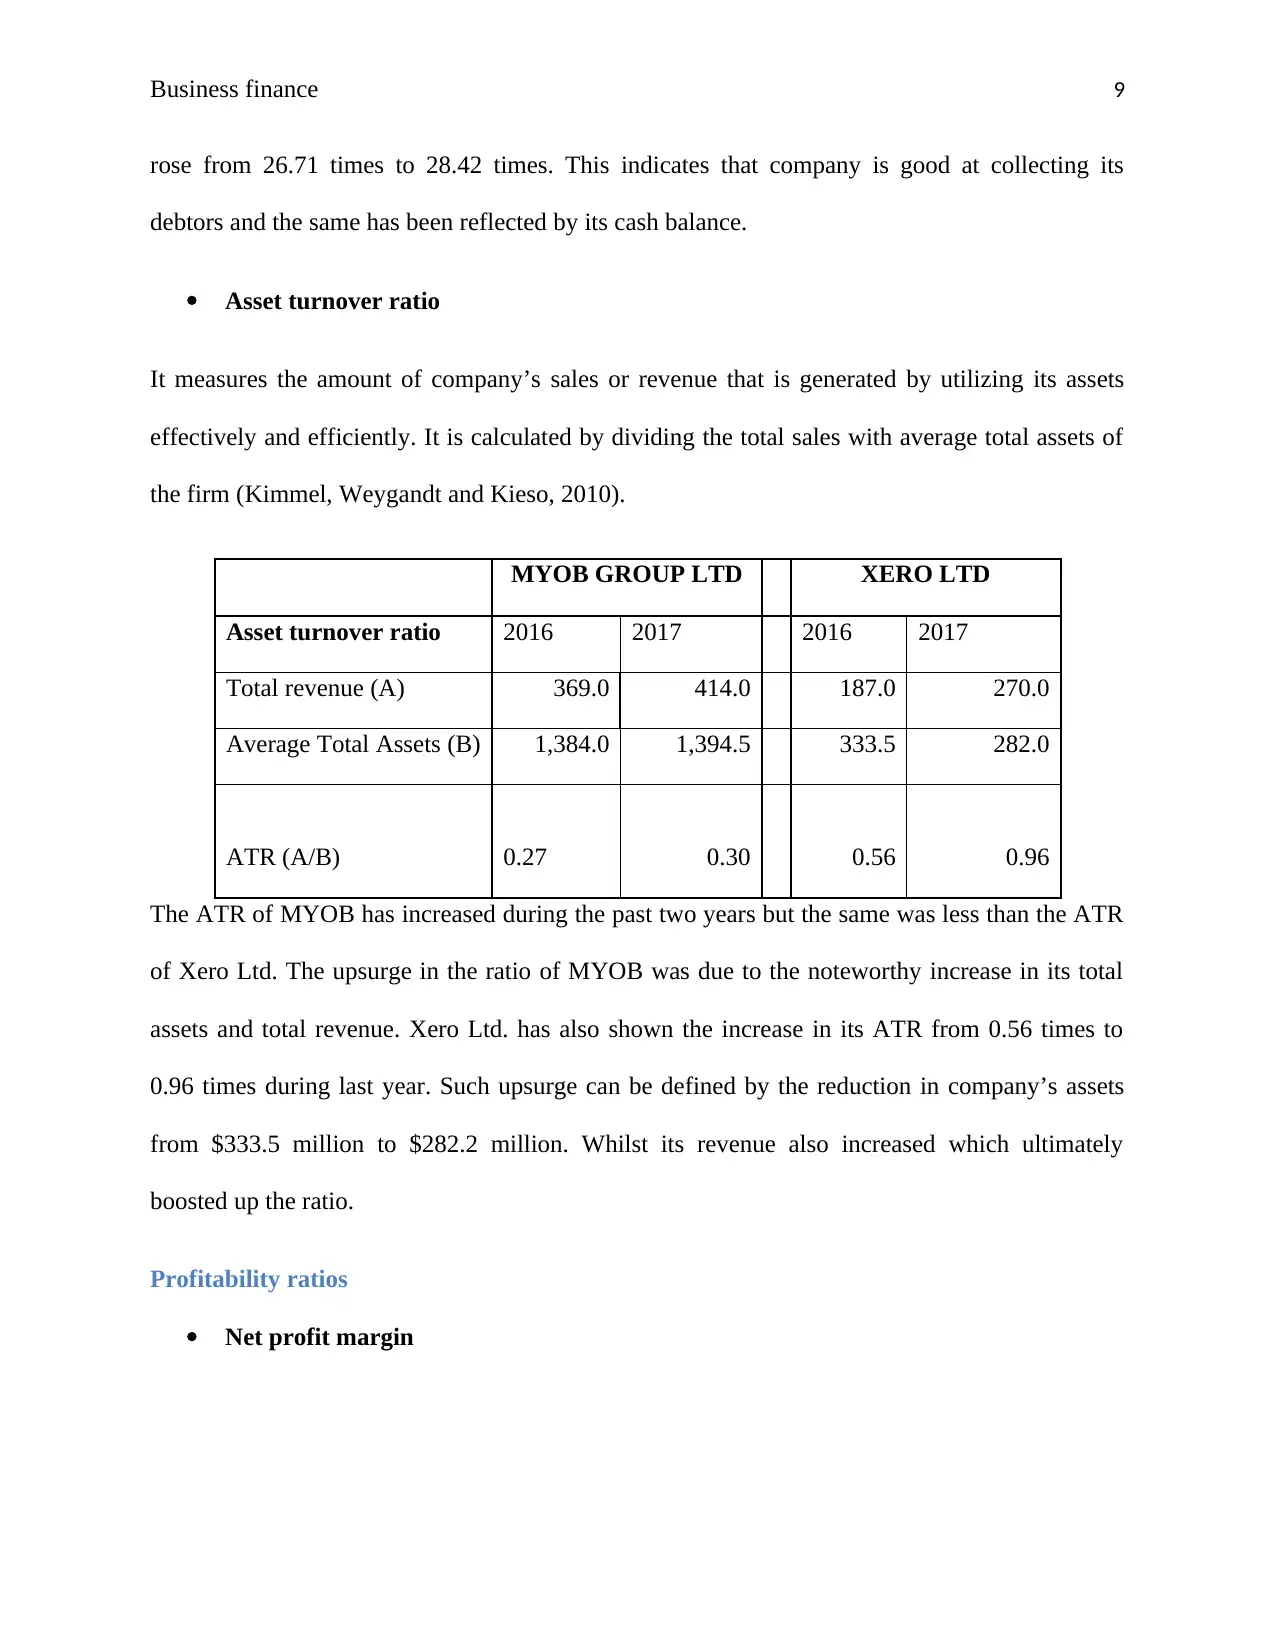
Asset turnover ratio
It measures the amount of company’s sales or revenue that is generated by utilizing its assets
effectively and efficiently. It is calculated by dividing the total sales with average total assets of
the firm (Kimmel, Weygandt and Kieso, 2010).
MYOB GROUP LTD XERO LTD
Asset turnover ratio 2016 2017 2016 2017
Total revenue (A) 369.0 414.0 187.0 270.0
Average Total Assets (B) 1,384.0 1,394.5 333.5 282.0
ATR (A/B) 0.27 0.30 0.56 0.96
The ATR of MYOB has increased during the past two years but the same was less than the ATR
of Xero Ltd. The upsurge in the ratio of MYOB was due to the noteworthy increase in its total
assets and total revenue. Xero Ltd. has also shown the increase in its ATR from 0.56 times to
0.96 times during last year. Such upsurge can be defined by the reduction in company’s assets
from $333.5 million to $282.2 million. Whilst its revenue also increased which ultimately
boosted up the ratio.
Profitability ratios
Net profit margin
rose from 26.71 times to 28.42 times. This indicates that company is good at collecting its
debtors and the same has been reflected by its cash balance.
Asset turnover ratio
It measures the amount of company’s sales or revenue that is generated by utilizing its assets
effectively and efficiently. It is calculated by dividing the total sales with average total assets of
the firm (Kimmel, Weygandt and Kieso, 2010).
MYOB GROUP LTD XERO LTD
Asset turnover ratio 2016 2017 2016 2017
Total revenue (A) 369.0 414.0 187.0 270.0
Average Total Assets (B) 1,384.0 1,394.5 333.5 282.0
ATR (A/B) 0.27 0.30 0.56 0.96
The ATR of MYOB has increased during the past two years but the same was less than the ATR
of Xero Ltd. The upsurge in the ratio of MYOB was due to the noteworthy increase in its total
assets and total revenue. Xero Ltd. has also shown the increase in its ATR from 0.56 times to
0.96 times during last year. Such upsurge can be defined by the reduction in company’s assets
from $333.5 million to $282.2 million. Whilst its revenue also increased which ultimately
boosted up the ratio.
Profitability ratios
Net profit margin
⊘ This is a preview!⊘
Do you want full access?
Subscribe today to unlock all pages.
Trusted by 1+ million students worldwide
Business finance 10
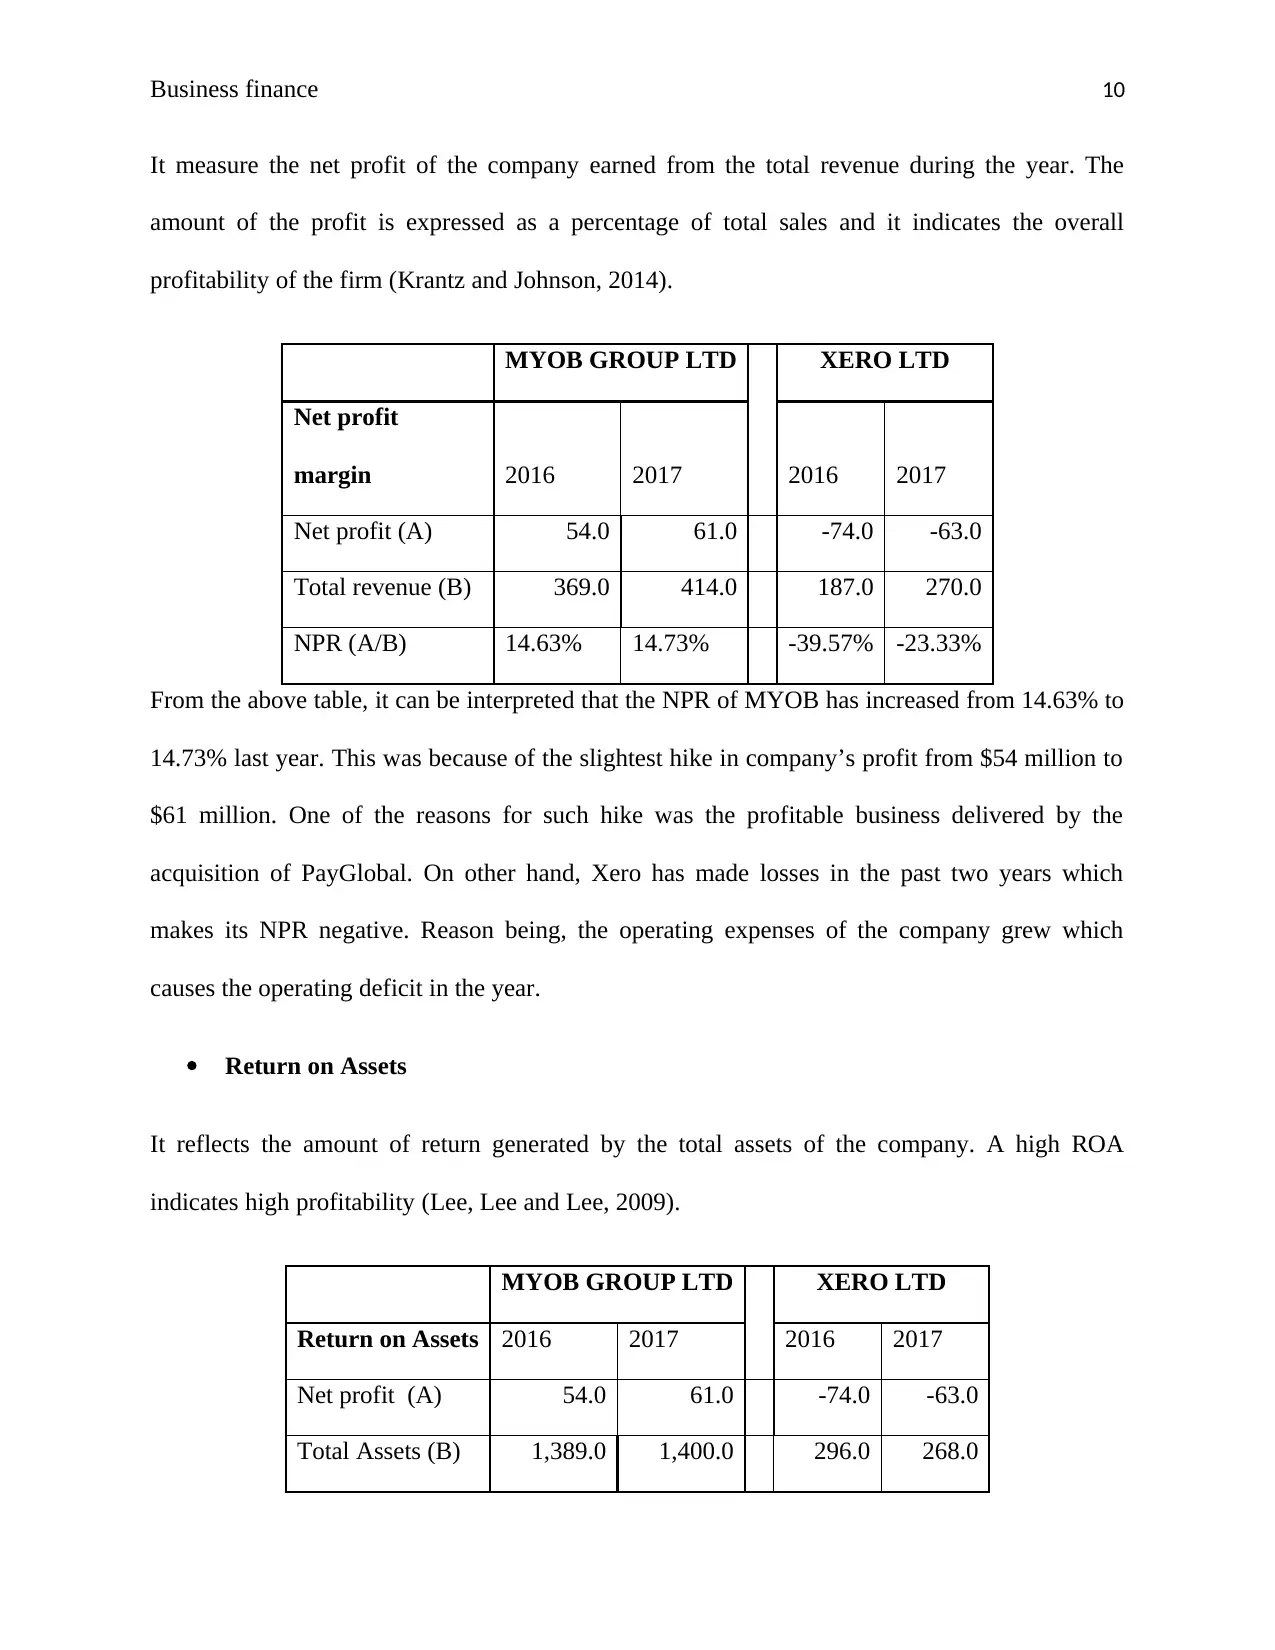
It measure the net profit of the company earned from the total revenue during the year. The
amount of the profit is expressed as a percentage of total sales and it indicates the overall
profitability of the firm (Krantz and Johnson, 2014).
MYOB GROUP LTD XERO LTD
Net profit
margin 2016 2017 2016 2017
Net profit (A) 54.0 61.0 -74.0 -63.0
Total revenue (B) 369.0 414.0 187.0 270.0
NPR (A/B) 14.63% 14.73% -39.57% -23.33%
From the above table, it can be interpreted that the NPR of MYOB has increased from 14.63% to
14.73% last year. This was because of the slightest hike in company’s profit from $54 million to
$61 million. One of the reasons for such hike was the profitable business delivered by the
acquisition of PayGlobal. On other hand, Xero has made losses in the past two years which
makes its NPR negative. Reason being, the operating expenses of the company grew which
causes the operating deficit in the year.
Return on Assets
It reflects the amount of return generated by the total assets of the company. A high ROA
indicates high profitability (Lee, Lee and Lee, 2009).
MYOB GROUP LTD XERO LTD
Return on Assets 2016 2017 2016 2017
Net profit (A) 54.0 61.0 -74.0 -63.0
Total Assets (B) 1,389.0 1,400.0 296.0 268.0
Paraphrase This Document
Need a fresh take? Get an instant paraphrase of this document with our AI Paraphraser
Business finance 11
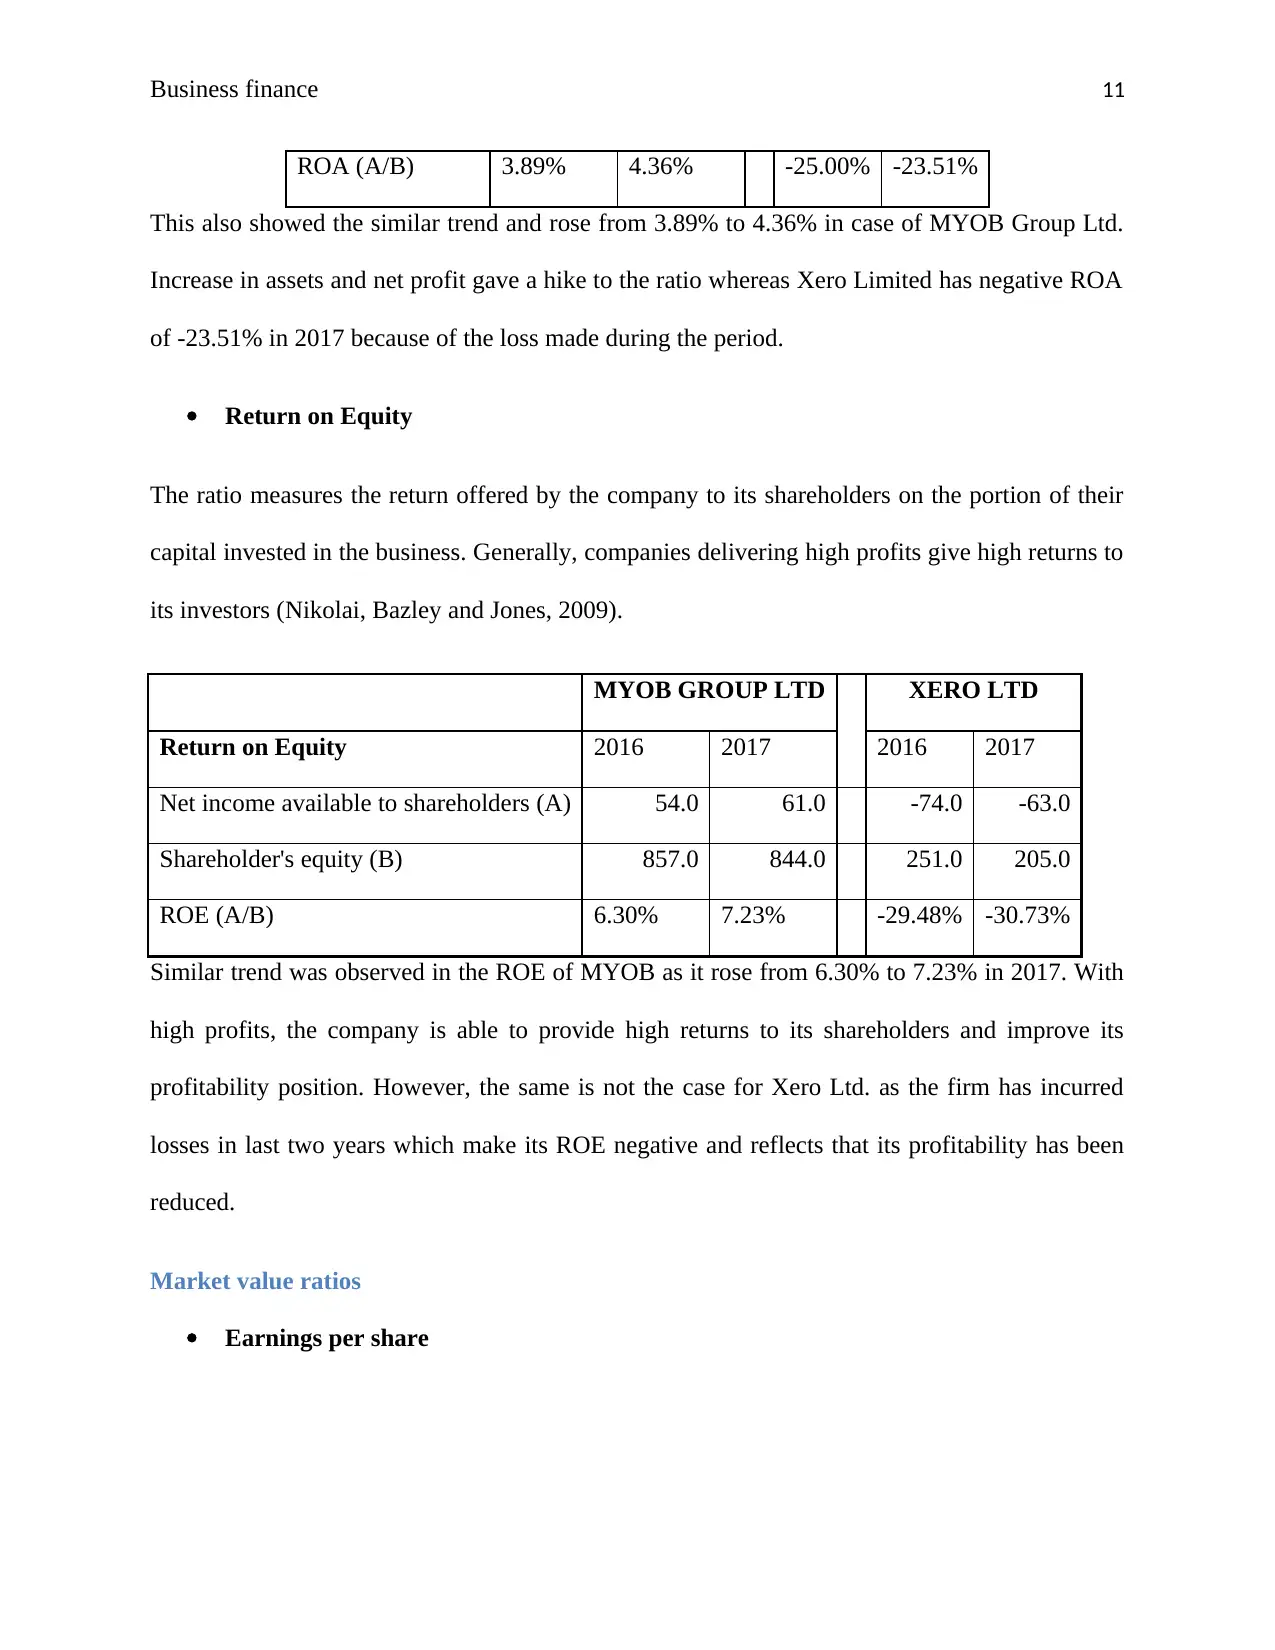
ROA (A/B) 3.89% 4.36% -25.00% -23.51%
This also showed the similar trend and rose from 3.89% to 4.36% in case of MYOB Group Ltd.
Increase in assets and net profit gave a hike to the ratio whereas Xero Limited has negative ROA
of -23.51% in 2017 because of the loss made during the period.
Return on Equity
The ratio measures the return offered by the company to its shareholders on the portion of their
capital invested in the business. Generally, companies delivering high profits give high returns to
its investors (Nikolai, Bazley and Jones, 2009).
MYOB GROUP LTD XERO LTD
Return on Equity 2016 2017 2016 2017
Net income available to shareholders (A) 54.0 61.0 -74.0 -63.0
Shareholder's equity (B) 857.0 844.0 251.0 205.0
ROE (A/B) 6.30% 7.23% -29.48% -30.73%
Similar trend was observed in the ROE of MYOB as it rose from 6.30% to 7.23% in 2017. With
high profits, the company is able to provide high returns to its shareholders and improve its
profitability position. However, the same is not the case for Xero Ltd. as the firm has incurred
losses in last two years which make its ROE negative and reflects that its profitability has been
reduced.
Market value ratios
Earnings per share
Business finance 12
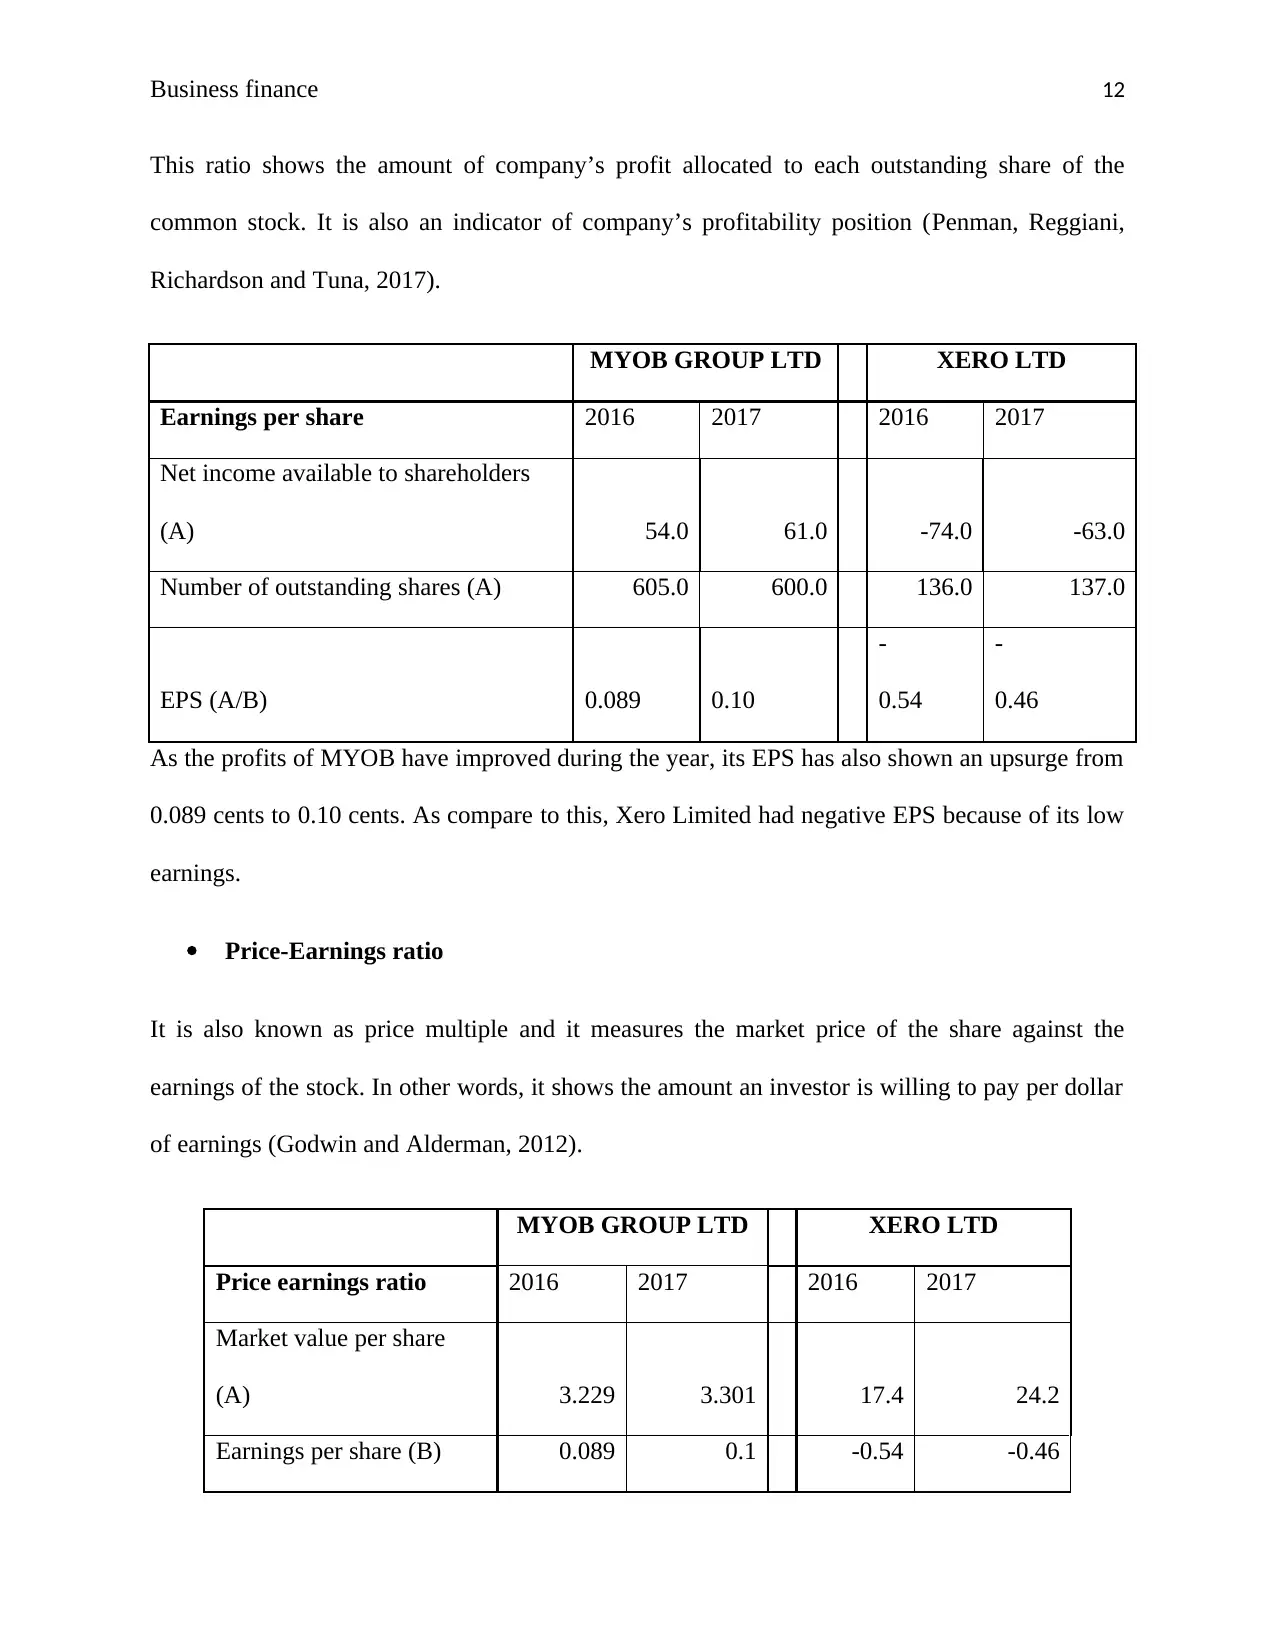
This ratio shows the amount of company’s profit allocated to each outstanding share of the
common stock. It is also an indicator of company’s profitability position (Penman, Reggiani,
Richardson and Tuna, 2017).
MYOB GROUP LTD XERO LTD
Earnings per share 2016 2017 2016 2017
Net income available to shareholders
(A) 54.0 61.0 -74.0 -63.0
Number of outstanding shares (A) 605.0 600.0 136.0 137.0
EPS (A/B) 0.089 0.10
-
0.54
-
0.46
As the profits of MYOB have improved during the year, its EPS has also shown an upsurge from
0.089 cents to 0.10 cents. As compare to this, Xero Limited had negative EPS because of its low
earnings.
Price-Earnings ratio
It is also known as price multiple and it measures the market price of the share against the
earnings of the stock. In other words, it shows the amount an investor is willing to pay per dollar
of earnings (Godwin and Alderman, 2012).
MYOB GROUP LTD XERO LTD
Price earnings ratio 2016 2017 2016 2017
Market value per share
(A) 3.229 3.301 17.4 24.2
Earnings per share (B) 0.089 0.1 -0.54 -0.46
⊘ This is a preview!⊘
Do you want full access?
Subscribe today to unlock all pages.
Trusted by 1+ million students worldwide
1 out of 18
Related Documents


Your All-in-One AI-Powered Toolkit for Academic Success.
+13062052269
info@desklib.com
Available 24*7 on WhatsApp / Email
![[object Object]](/_next/static/media/star-bottom.7253800d.svg)
Unlock your academic potential
Copyright © 2020–2026 A2Z Services. All Rights Reserved. Developed and managed by ZUCOL.