BMP3005 Applied Business Finance: Enhancing Financial Performance
VerifiedAdded on 2023/06/14
|14
|3349
|498
Report
AI Summary
This report provides an overview of financial management, its importance, and its application within businesses. It defines financial management and discusses its significance in decision-making, profitability, funds distribution, and capital structure formation. The report also describes the main financial statements (profit and loss statement, statement of financial position, and cash flow statement) and explains the use of ratios (profitability, efficiency, and liquidity ratios) in financial management, using a case study to illustrate their application. Furthermore, it analyzes the case study company's profitability, liquidity, and efficiency based on ratio analysis and suggests processes the business might use to improve its financial performance. Desklib provides access to this and other solved assignments for students.
BSc (Hons) Business Management with
Foundation
BMP3005
Applied Business Finance
The concept and importance of financial
management and the processes
businesses might use to improve their
financial performance
1
Foundation
BMP3005
Applied Business Finance
The concept and importance of financial
management and the processes
businesses might use to improve their
financial performance
1
Paraphrase This Document
Need a fresh take? Get an instant paraphrase of this document with our AI Paraphraser
Contents
Introduction 3
Section 1: Definition and discussion of the concept and
importance of financial management 3
Section 2: Description and discussion of the main financial
statements and explain the use of ratios in financial management
4
Section 3: Using the template provided 5-9
i. Completing the Information on the ‘Business Review Template
(Ensure that you display your calculations for this detail)
5
ii. Using Excel producing an Income Statement for the Sample
Organisation (see Case Study). This should be included within your
appendices 6
iii. Using Excel completing the Balance Sheet 7
iv. Using the Case study information describing the profitability,
liquidity and efficiency of the company based on the results of ratio
analysis 8
Section 4: Using examples from the case study describing and
discussing the processes this business might use to improve their
financial performance 9
Conclusion 10
References 11
Appendix 13
2
Introduction
Among the most important components of running a business is financial
management. It ensures that the company 's activities function smoothly and that the
distribution of funding is not disrupted. The study discusses the relevance of financial
governance, financial statement ideas, and the use of ratios in business operations. It has also
gone through key ratios like as profitability, liquidity, and efficiency ratios using the income
statement and balance sheet as an example from the case study. The financial performance of
the firm is also examined during the business performance review (Ashley and et. al., 2018).
Section 1: Definition and discussion of the concept and
importance of financial management
Financial management is a term that relates to the process of leading, controlling,
planning, and coordinating a company's financial activities. It also entails applying
management principles to an organization's financial resources, as well as having a
substantial influence on financial administration (Bano and et. al., 2021).
Keeping a sufficient stock of assets for the organisation;
Assuring investors that their investment will provide a high return;
Optimal and efficient asset use;
Creating real and secure venture freedoms to put resources into
Importance of Financial Management:
Financial Decision: It supports the company in making key financial decisions. A
decision that has the potential to bring the entire company down. It explains the various risks
and options and assists in determining the size of the investor's capital and the assets bought.
Profitability: If the books of accounts and resources are well-managed, the
organization's production will improve. It will also guarantee that the company's efficiency
and development potential are assessed.
Funds distribution: The right distribution of fiscal resources is based on the company's
earnings. It will assist the firm's fiscal ratios improve, as well as reduce expenses and raise its
monetary state.
Economic Stability: It provides immovability to a firm by addressing a solid monetary
framework and preventing commercial actions that might be harmful to the organisation, as
well as assisting in the maintenance and acquisition of further advantages.
3
⊘ This is a preview!⊘
Do you want full access?
Subscribe today to unlock all pages.
Trusted by 1+ million students worldwide
Formation of the capital structure: The design should be appropriately created in order
to calculate the needed capital. Any business that is dependent on the quantity of cash it has
and how much it has to raise from outside sources (Black, 2019).
Section 2: Description and discussion of the main financial
statements and explain the use of ratios in financial management
Financial statements are information that every publicly traded firm is required to
keep. It depicts the firm's monetary activity. These financial statements indicate the
company's financial health and give financial statistics. These are required to be audited and
are the financial manager's duty. Internal and external sources can be used to audit these. It
ensured that the company's statements were not faked and were genuine. The following are
the statements (Büyüközkan, Göçer and Karabulut, 2019):
Profit and loss statement: This statement details the income, revenues, expenditures,
and accrued or outstanding expenses and earnings for the financial period. It also indicates
the transactions that were made throughout the time period and the expenditures that the
company had to bear in order to yield and make the sales. The organization's net profit for the
time is calculated by subtracting the period's costs and wages. It's the last item on the revenue
statement.
Statement of financial performance: This is the most important financial statement in
the company since it provides clients with a thorough overview of the company's financial
data. This statement shows the total assets as well as the obligations that the company has
agreed to pay in the future. It is also known as a financial record, which is the major concern
of businesses. In simple terms, this statement indicates the financial position of the company
at a certain point in time.
Cash flow statement: The net amount of cash inflow and outflow from the firm over a
period of time is shown in the cash flow statement. It depicts the cash flow from investing,
operating, and financing operations over a period of time. Operational operations indicate the
changes in current assets and liabilities, as well as interest and duty expenditures. The inflows
and outflows from the issuing of shareholder capital, debentures, advances, and dividend
payments are shown in the financing exercises (Chai and Ngai, 2020).
Uses of ratios in Financial management:
Monetary Ratios Analysis is an accounting strategy that assists managers in analysing
financial data that has been reported for the entire fiscal year. It is a limitless tool for the
management of a company's resources, since it allows them to examine the financial position
4
Paraphrase This Document
Need a fresh take? Get an instant paraphrase of this document with our AI Paraphraser
of the company. It aids senior management in making short and long-term company
decisions, as well as categorising patterns in those decisions by comparing them to past years.
The following are the most common applications of percentage assessment:
Financial ratios assist key supervisors in making decisions: In the computation of
extents and following definite judgments of these proportions, monetary reports, benefits,
pattern of returns, acquisition capacity, and recompense of the business are used. The
decision-makers are given a concise overview of what has to be done in the future to obtain
rewards.
Efficiencies in Operations: The ratios are used to determine a company's liquidity,
solvency, and productivity. It aids management in maintaining cheap costs while maintaining
high skill levels in order to accomplish the company's strategic goals (Goodwin, Stein and
Amelung, 2021).
Comparative analysis: Proportional analysis of the business is used to compare
various components in monetary information reporting. It evaluates the company's financial
performance and establishes a benchmark against which it can be compared to other
companies in the same industry.
Section 3: Using the template provided:
i. Completing the Information on the ‘Business Review Template
(Ensure that you display your calculations for this detail)
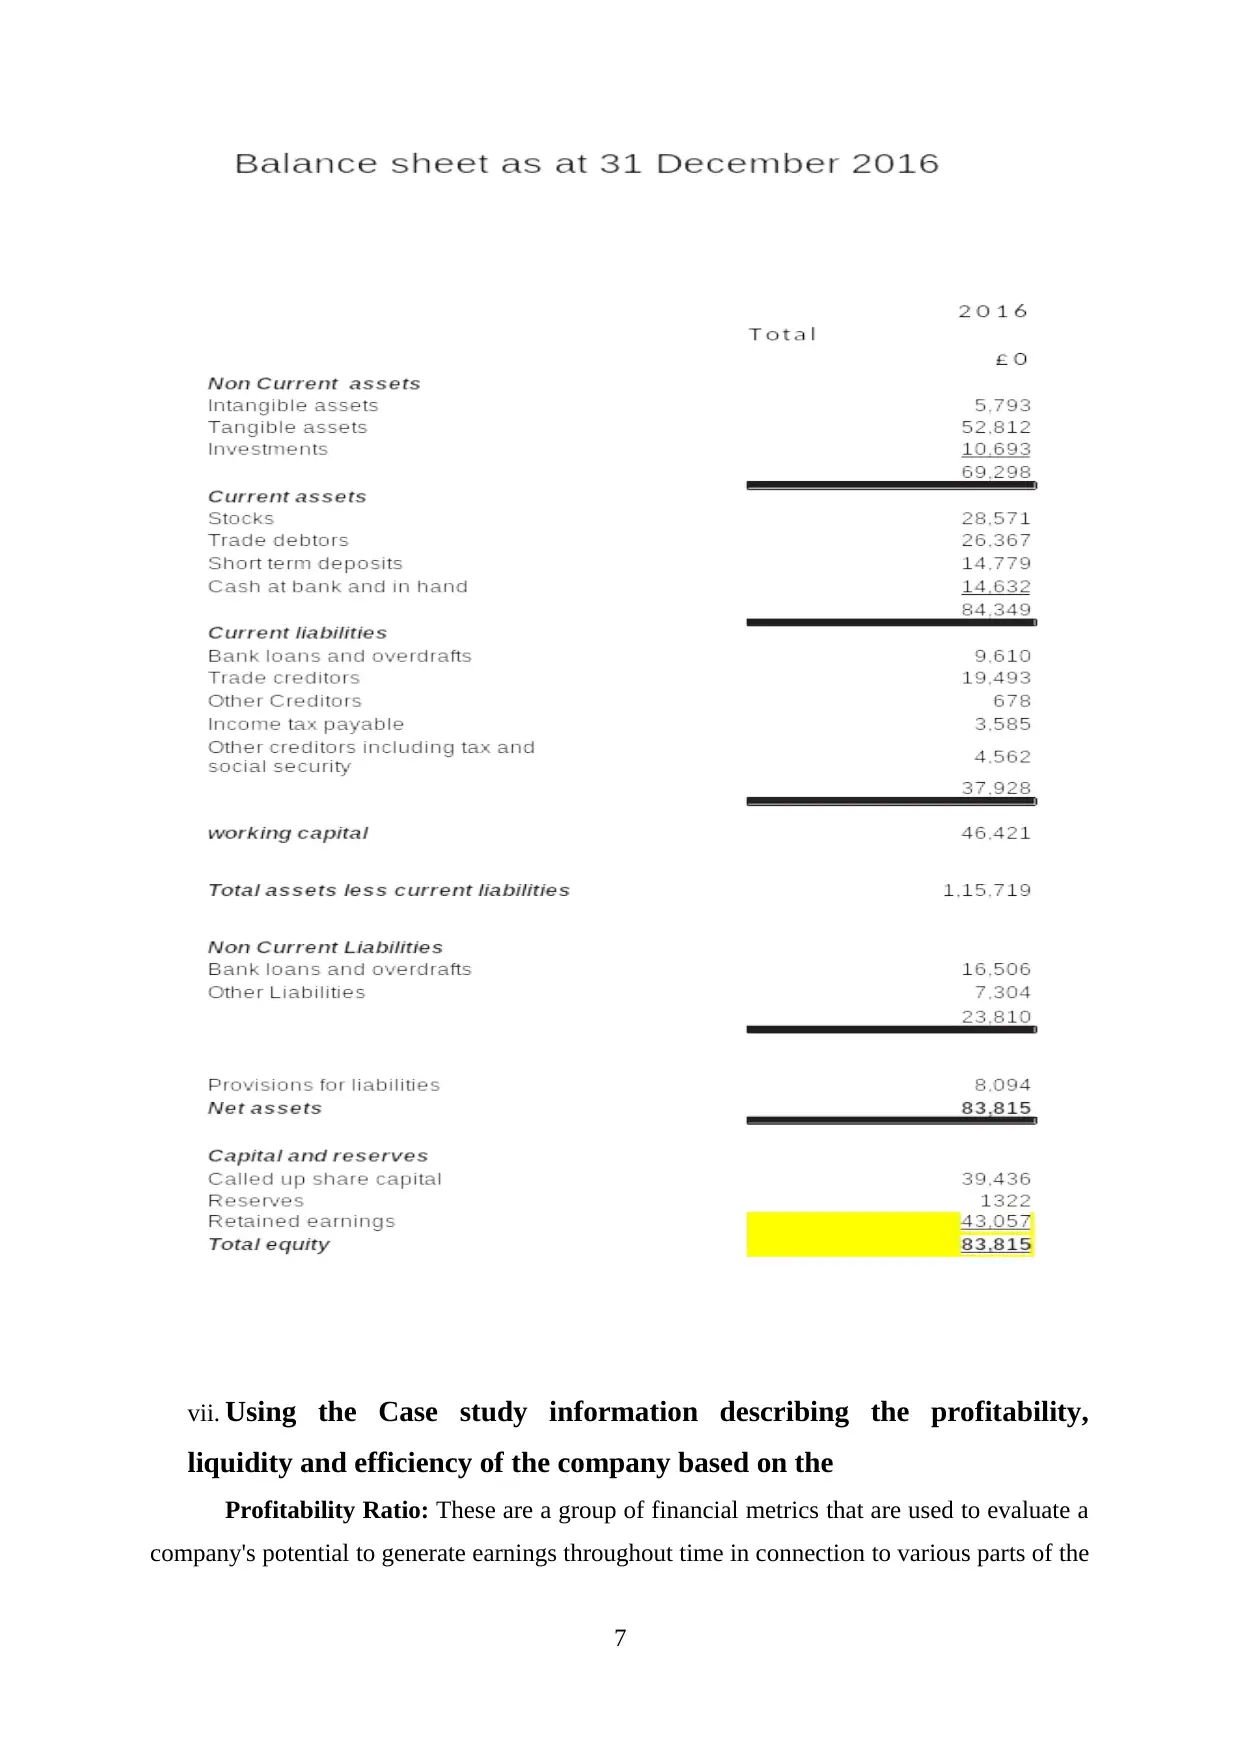
The Net Profit for the year 2016, is £43,057. (2015: £18,987,000).
The Company’s key financial and other performance indicators during the year were as
follows:
2016
£’000
2015
£’000 Change %
Turnover (continuing operations) 189711 179587 +5.6%
Profit for the financial year 43057 18,987 +126.77%
Shareholder’s equity 83802.75 63,057 +32.9%
Current assets as % of current liabilities 222 % 304.00% -82%
Customer satisfaction 4.5 4.1 +10%
Average number of employees 649 618 +5%
5
decisions, as well as categorising patterns in those decisions by comparing them to past years.
The following are the most common applications of percentage assessment:
Financial ratios assist key supervisors in making decisions: In the computation of
extents and following definite judgments of these proportions, monetary reports, benefits,
pattern of returns, acquisition capacity, and recompense of the business are used. The
decision-makers are given a concise overview of what has to be done in the future to obtain
rewards.
Efficiencies in Operations: The ratios are used to determine a company's liquidity,
solvency, and productivity. It aids management in maintaining cheap costs while maintaining
high skill levels in order to accomplish the company's strategic goals (Goodwin, Stein and
Amelung, 2021).
Comparative analysis: Proportional analysis of the business is used to compare
various components in monetary information reporting. It evaluates the company's financial
performance and establishes a benchmark against which it can be compared to other
companies in the same industry.
Section 3: Using the template provided:
i. Completing the Information on the ‘Business Review Template
(Ensure that you display your calculations for this detail)
The Net Profit for the year 2016, is £43,057. (2015: £18,987,000).
The Company’s key financial and other performance indicators during the year were as
follows:
2016
£’000
2015
£’000 Change %
Turnover (continuing operations) 189711 179587 +5.6%
Profit for the financial year 43057 18,987 +126.77%
Shareholder’s equity 83802.75 63,057 +32.9%
Current assets as % of current liabilities 222 % 304.00% -82%
Customer satisfaction 4.5 4.1 +10%
Average number of employees 649 618 +5%
5
The purchase of the Extinguishers company on 1 May 2015, which contributed a full year's
contribution in 2016, raised turnover from ongoing operations by 5.6 percent.
Gross Profit = £81,125
Net Profit = £43057
Net Profit increased in 2016 by 126.77% during the year.
Shareholders’ equity increased by 32.9% by £20,745.75.
The company’s “quick ratio” (Current Assets (excluding stock) divided by Current
Liabilities) is 1.47:1
The company’s “current ratio” (Current Assets divided by Current Liabilities.) is 2.22: 1.
(The calculation are shown in appendix)
v. Using Excel producing an Income Statement for the Sample
Organisation (see Case Study)
This is included within appendix
vi. Using Excel completing the Balance Sheet
6
⊘ This is a preview!⊘
Do you want full access?
Subscribe today to unlock all pages.
Trusted by 1+ million students worldwide
vii. Using the Case study information describing the profitability,
liquidity and efficiency of the company based on the
Profitability Ratio: These are a group of financial metrics that are used to evaluate a
company's potential to generate earnings throughout time in connection to various parts of the
7
liquidity and efficiency of the company based on the
Profitability Ratio: These are a group of financial metrics that are used to evaluate a
company's potential to generate earnings throughout time in connection to various parts of the
7
Paraphrase This Document
Need a fresh take? Get an instant paraphrase of this document with our AI Paraphraser
income statement and balance sheet of a fiscal year based on the company's performance.
Gross profit margin, net profit margin, return on assets, and return on equity are among the
most important profitability measures.
Gross Profit Margin= (Revenue – cost of Sales) / Revenue * 100
= (189,711 – 108,586) / 189,711 * 100 = 42.76%
Net Profit Margin = (Net profit/ Revenue) *100
= (43,057/189,711) * 100 = 22.70%
Interpretation: The above ratios represent the profit percentage as a proportion of
revenue earned, taking into account both operating and non-operating expenditures. The
gross profit margin is the percentage of money left over after expenses are deducted from the
revenue, whereas the net profit margin is the percentage of money left over after expenses are
deducted. The gross profit is 42.76 percent, but the net profit is 22.7 percent, indicating a
profit decrease of around 20%. As a result, the firm must reduce its overhead expenditures,
that are preventing it from generating greater net revenue. It is critical for the investor to
compare earnings with those of other firms in the same industry in order to determine the
company's actual position in the industry (Littlechild, 2018).
2. Efficiency Ratio: This metric assesses how well a corporation manages its assets and
liabilities. It assesses how quickly the company collects payments from consumers
and how long it takes to complete debt payback, as well as the asset and equity
turnover. Asset turnover, stock turnover, receivable turnover, and accounts payable
turnover ratio are the most important ratios.
Asset turnover Ratio= Total Sales/ Total assets = 189,711/153,647 = 1.23
Stock Turnover Ratio = Cost of Sales/ Stock = (108,586/28,571) = 3.8
Accounts receivable Days = 365/ Debtors Turnover Ratio
=365/ 7.19 = 50.77 days
Accounts Payable Days = 365/ Creditors Turnover Ratio
= 365/7.04 = 51.84 days
Interpretation: The average client takes 51 days to pay off their debt, while creditors
take 52 days to collect their money. As a result, the firm pays and receives debts and
payments virtually simultaneously. However, it might be a constraint since if the receivable
days decrease, it can pose problems for the organisation, even if the days are only a few days
apart. The inventory turnover rate is 3.8, which implies that the entire stock investment flows
roughly 4 times every year, or 3 months per year. The total assets turnover ratio of 1.23
8
indicates that the company is performing well and generating enough revenue at the
conclusion of the fiscal year to stay in business.
3. Liquidity Ratio: It assesses a company's capacity to meet its financial obligations and
also informs us about its solvency. Current assets, current liabilities, and stock are used to
calculate these ratios. The current and quick ratios are the most important ratios (Lohaus and
Habermann, 2019).
Current Ratio = Current Assets/ Current Liabilities
= 84,349/ 37,928 = 2.22:1
Quick Ratio = (Current Assets- Stock)/ Current Liabilities
= (84,349 - 28571)/ 37,928 = 1.47:1
Interpretation: The aforementioned ratios provide information regarding the
company's liquidation status. The optimal current-to-quick ratio is 2:1, while the quick-to-
current ratio is 1:1. The current assets to liabilities ratio is 2.22, indicating that the business is
solvent. However, when deducting stock from current assets, the quick ratio remains at 1.47,
indicating that the company has enough cash to pay down its creditors and is doing so
successfully.
Section 4: Using examples from the case study describing and
discussing the processes this business might use to improve their
financial performance.
Since investors opt to invest in a company based on its financial performance,
financial performance is a life-sustaining feature of the firm. As a result, it's critical to make
the right financial judgments when it comes to funding options. Though, because the
company's existence and survival are dependent on earnings, wealth maximisation is the
primary priority. Financial ratios assist managers and financial organisations in making the
best decisions. Based on the computations, it has been determined that:
The current assets to current liabilities ratio has decreased by 82 percent from the
previous year, indicating that the company's cash outflow has increased and it is
losing liquidity.
Since non-operating costs such as administrative expenditures and interest have
decreased, the net profit has increased by 126.77 percent.
Customer satisfaction demonstrates that the company is investing more and
supporting its growth, resulting in a higher staff retention rate.
9
⊘ This is a preview!⊘
Do you want full access?
Subscribe today to unlock all pages.
Trusted by 1+ million students worldwide
Assuming that shareholder equity is increasing, more shares are being sold, revenues
are increasing, and operational expenditures are decreasing.
Improvements that can be done are as follows:
Marketing tactics that may be used to improve the firm include lowering expenses and
making effective use of resources, both of which will help the company generate more
revenue. Presenting on social media, for example, is a better and less expensive means
of reaching the greatest number of people.
Utilization of resources effectively and efficiently, resulting in lower costs and higher
prices, as well as profit leveraging. It will also boost the company's production and
efficiency.
The leverage in working capital requirements may be demonstrated by lowering
inventory and improving inventory turnover.
Conclusion
The report concludes that financial management plays a critical role in the running of
the company. It manages finances, makes business choices, and reports on the profitability,
economic stability, and solvency of the company. The financial accounts are a summary of
the business. Every company must keep these records and have them audited by authorised
individuals both internally and externally. It tells all about the assets, liabilities, shareholder's
equity, profits, revenues, inflow and outflow of cash. Financial ratios help in analyzing the
solvency and the efficiency of the enterprise. Hence, from the above calculate ratios of the
case study, it is analyzed that the company is earning a high net profit but it can lower its
inventory cost which will help in increasing the revenues and also in the net earnings. It
contains information about the company's assets, liabilities, shareholder equity, earnings,
revenues, and cash inflow and outflow. Financial ratios aid in the analysis of a company's
solvency and efficiency. As a result of the case study's calculated ratios, it is determined that
the firm has a high net profit, but it can reduce its inventory costs, which will assist increase
revenues and net earnings.
10
Paraphrase This Document
Need a fresh take? Get an instant paraphrase of this document with our AI Paraphraser
References
Ashley, R., Gersonius, B., Digman, C., Horton, B., Smith, B. and Shaffer, P., 2018. Including
uncertainty in valuing blue and green infrastructure for stormwater
management. Ecosystem services, 33, pp.237-246.
Bano, C., Coffey, D., Al Tawil, K., Karuppaiah, K., Tavakkolizadeh, A., Rose, V.,
Tahmassebi, R. and Colegate-Stone, T., 2021. Management of Open Elbow
Fractures-The Experiences and Outcomes from a UK Major Trauma Centre. Journal
of Shoulder and Elbow Surgery.
Black, K., 2019. Business statistics: for contemporary decision making. John Wiley & Sons.
Büyüközkan, G., Göçer, F. and Karabulut, Y., 2019. A new group decision making approach
with IF AHP and IF VIKOR for selecting hazardous waste
carriers. Measurement, 134, pp.66-82.
Chai, J. and Ngai, E.W., 2020. Decision-making techniques in supplier selection: Recent
accomplishments and what lies ahead. Expert Systems with Applications, 140,
p.112903.
Goodwin, N., Stein, V. and Amelung, V., 2021. What is integrated care?. In Handbook
integrated care (pp. 3-25). Springer, Cham.
Littlechild, S., 2018. Economic regulation of privatised airports: some lessons from UK
experience. Transportation Research Part A: Policy and Practice, 114, pp.100-114.
Lohaus, D. and Habermann, W., 2019. Presenteeism: A review and research
directions. Human Resource Management Review, 29(1), pp.43-58.
11

Shapiro, A.C. and Hanouna, P., 2019. Multinational financial management. John Wiley &
Sons.
Treviño, L.J. and Doh, J.P., 2021. Internationalization of the firm: A discourse-based
view. Journal of International Business Studies, 52(7), pp.1375-1393.
Zachariadis, M., Hileman, G. and Scott, S.V., 2019. Governance and control in distributed
ledgers: Understanding the challenges facing blockchain technology in financial
services. Information and Organization, 29(2), pp.105-117.
12
⊘ This is a preview!⊘
Do you want full access?
Subscribe today to unlock all pages.
Trusted by 1+ million students worldwide
1 out of 14
Related Documents


Your All-in-One AI-Powered Toolkit for Academic Success.
+13062052269
info@desklib.com
Available 24*7 on WhatsApp / Email
![[object Object]](/_next/static/media/star-bottom.7253800d.svg)
Unlock your academic potential
Copyright © 2020–2026 A2Z Services. All Rights Reserved. Developed and managed by ZUCOL.