Business Finance Report: Project Evaluation and Analysis

Verified

Added on  2022/11/14

|9
|1323
|219
Report
AI Summary
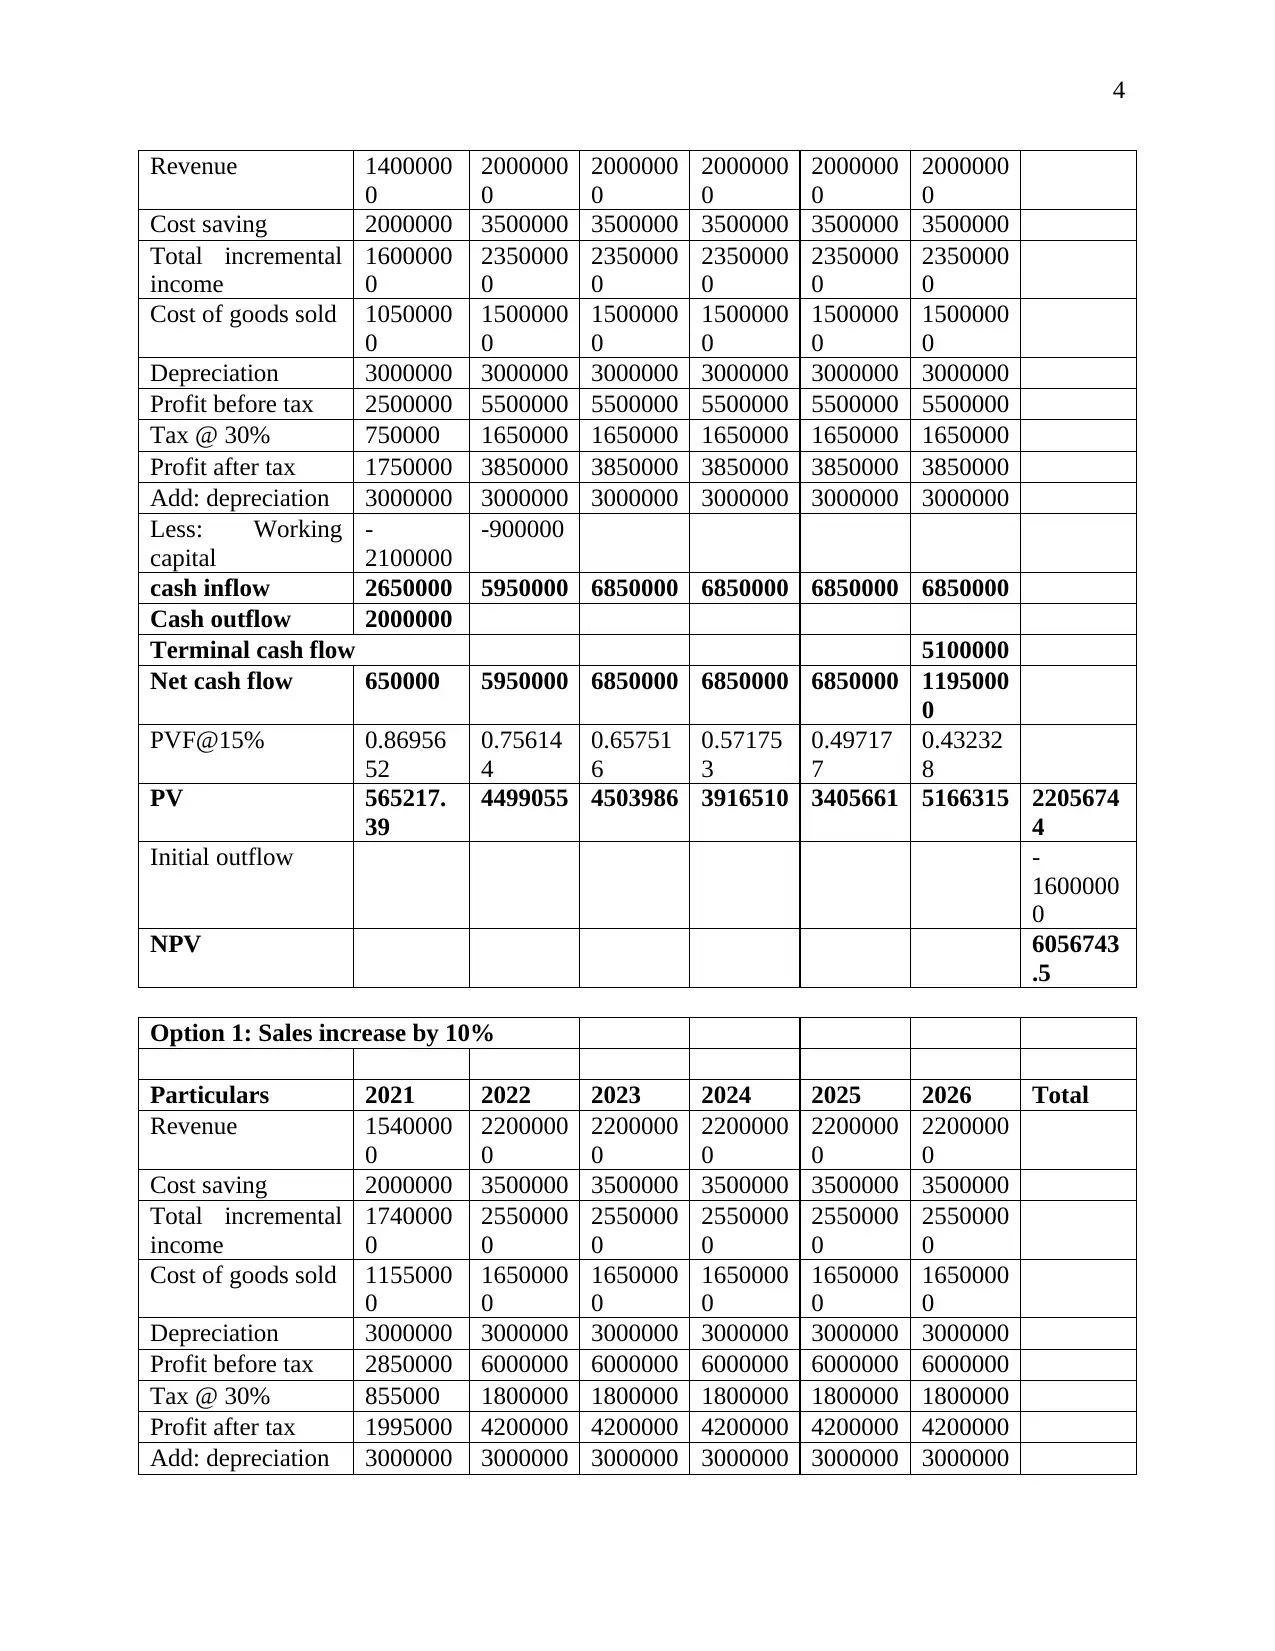
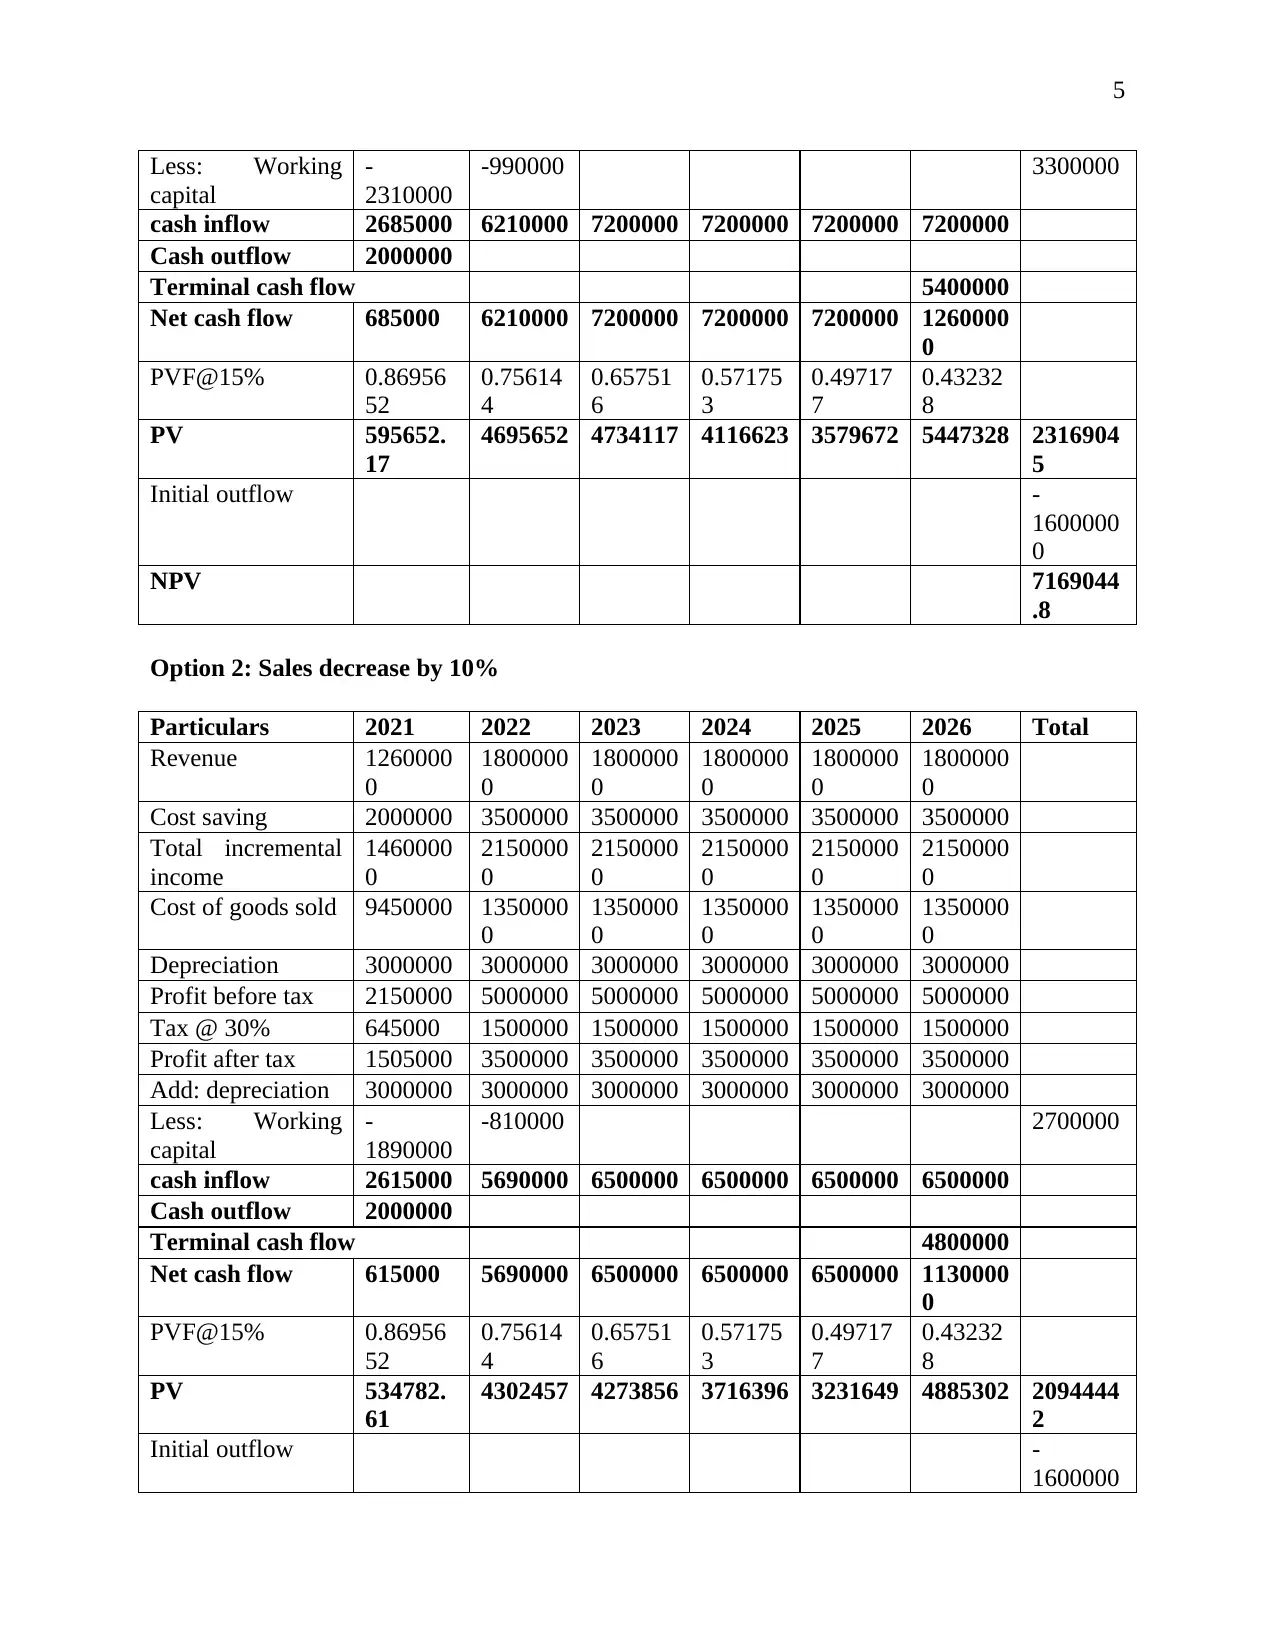
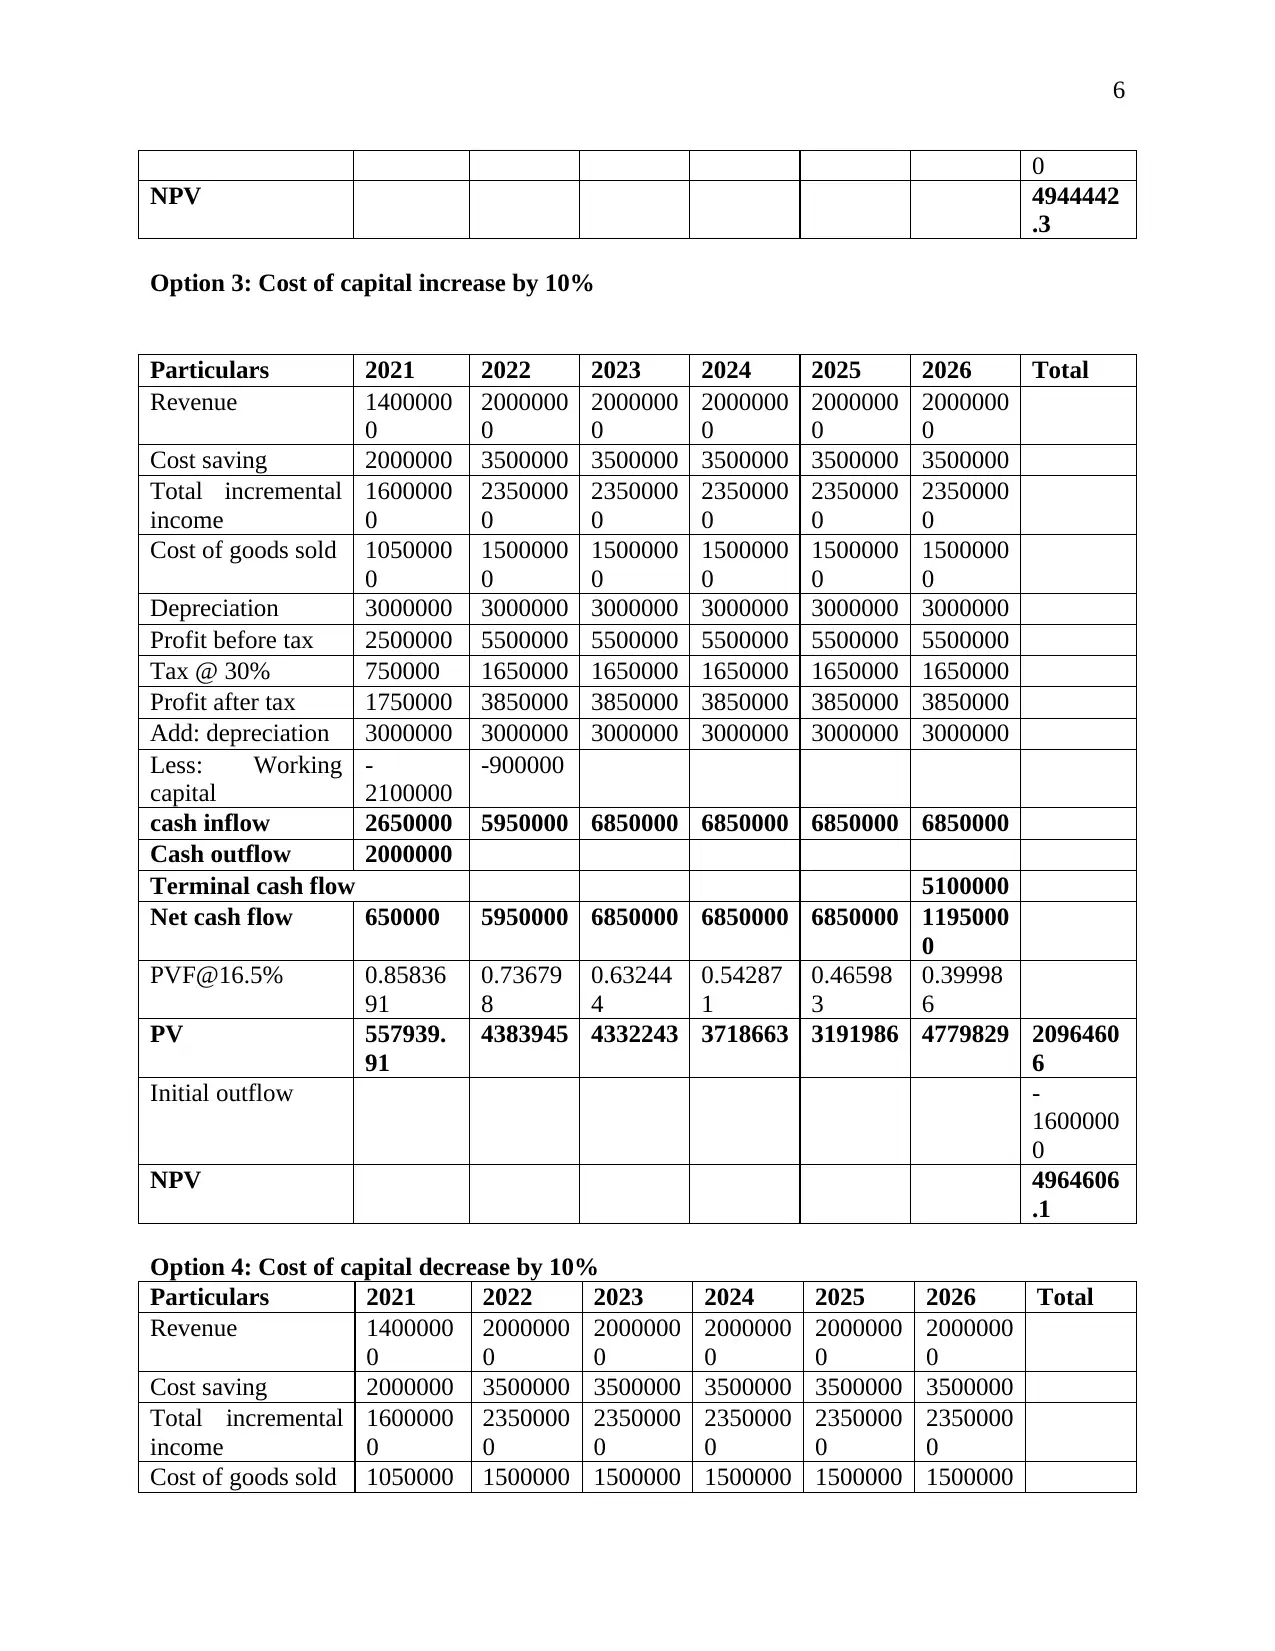
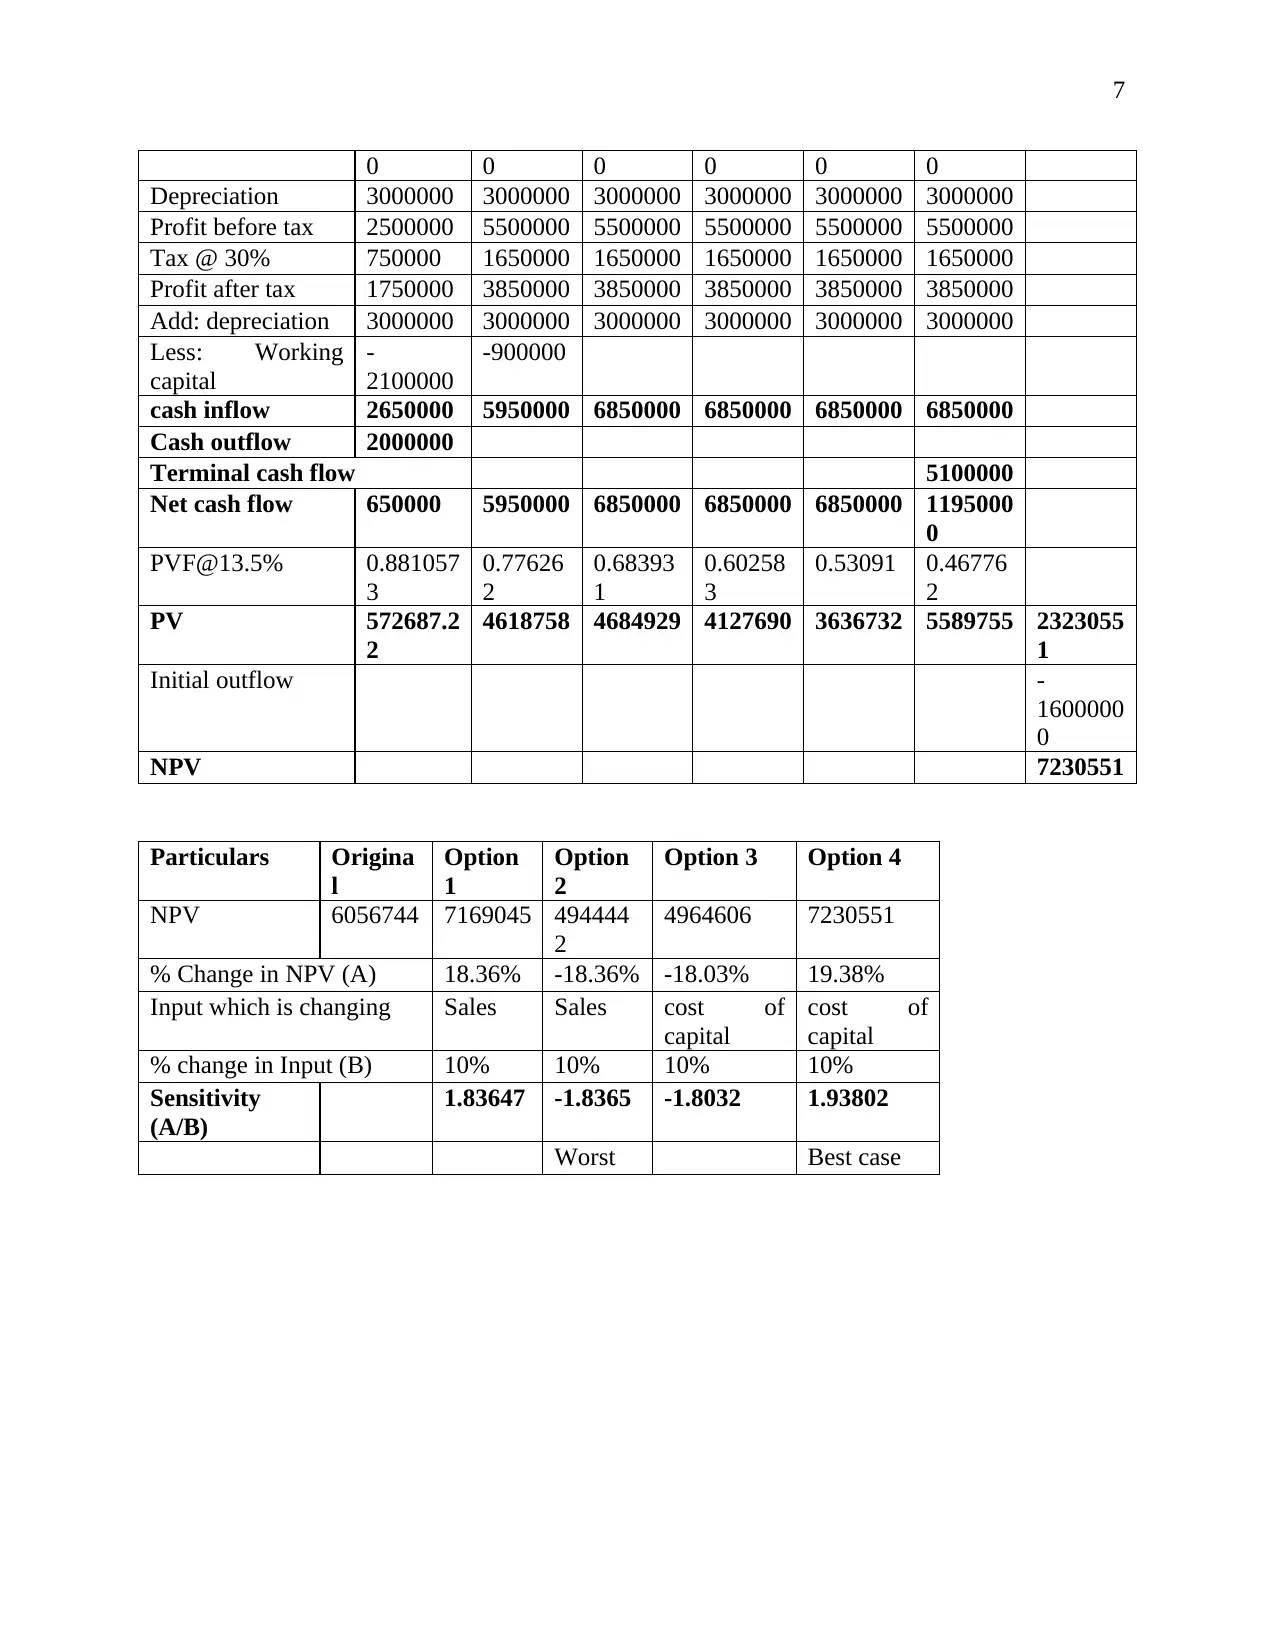
This report provides a detailed analysis of a business finance project, focusing on the evaluation of a project using the hurdle rate. It begins by explaining the concept of the hurdle rate and its limitations compared to the discount rate, highlighting why the company is hesitant to use it. The report then presents a comprehensive cash flow analysis, projecting revenues, costs, and profits over several years. It includes calculations for net present value (NPV) under various scenarios, such as changes in sales, cost of capital, and sensitivity analysis to assess the impact of these changes. The analysis includes detailed tables showing the impact of different scenarios on the project's financial performance. The report also includes references to academic literature supporting the financial concepts discussed.
Document Page
1
Business finance
tabler-icon-diamond-filled.svg

Paraphrase This Document

Need a fresh take? Get an instant paraphrase of this document with our AI Paraphraser
Document Page
2
Table of Contents
b)......................................................................................................................................................3
c)......................................................................................................................................................3
References........................................................................................................................................8
Document Page
3
b)
In the business, there are various investments which are made and in that there is some return
which is made. The rate which will be determining the minimum amount which will be earned is
identified to be the hurdle rate. The rate will be determined after considering all the risks which
are involved in the project (Brunzell, Liljeblom and Vaihekoski, 2013). In the evaluation of the
project there is the use of the discount rate so that the appropriate results are obtained. In the
given case Prescott has used the hurdle rate and this is making them uneasy.
The discount rate is the rate which covers all the elements which are necessary for any business
and after that the rate is established (Yao et al., 2012). By that, there is the determination of the
actual amount which will be gained by the proposal. There will be consideration of the changes
in the discount rate but the same is not done in the hurdle rate as it remains same in all the years
and there is no inclusion of the changes in the business. There are various proposals and all
having different durations but this is not considered in the hurdle rate. Due to this the results
which will be made available will not be providing the proper base for the comparison and
decision making. By the help of the hurdle rate there will be surety regarding the minimum
returns which will be made. In that the requirements and expectation of the company are not
taken into account and that does not provide adequate reasons to take the decision on the basis of
the same.
The company wants to have the proper analyzation of the situation in such manner that the
required return which is expected can be tested and the same will not be happening with the use
of the hurdle rate (Kilic and Kaya, 2015). The results which will be obtained and that is required
are different and so it is not suitable to make the decision according to it. Due to all of these
reasons the company is in doubt regarding the use of the hurdle rate for the evaluation of the
project.
c)
Original
Particulars 2021 2022 2023 2024 2025 2026 Total
Document Page
4
Revenue 1400000
0
2000000
0
2000000
0
2000000
0
2000000
0
2000000
0
Cost saving 2000000 3500000 3500000 3500000 3500000 3500000
Total incremental
income
1600000
0
2350000
0
2350000
0
2350000
0
2350000
0
2350000
0
Cost of goods sold 1050000
0
1500000
0
1500000
0
1500000
0
1500000
0
1500000
0
Depreciation 3000000 3000000 3000000 3000000 3000000 3000000
Profit before tax 2500000 5500000 5500000 5500000 5500000 5500000
Tax @ 30% 750000 1650000 1650000 1650000 1650000 1650000
Profit after tax 1750000 3850000 3850000 3850000 3850000 3850000
Add: depreciation 3000000 3000000 3000000 3000000 3000000 3000000
Less: Working
capital
-
2100000
-900000
cash inflow 2650000 5950000 6850000 6850000 6850000 6850000
Cash outflow 2000000
Terminal cash flow 5100000
Net cash flow 650000 5950000 6850000 6850000 6850000 1195000
0
PVF@15% 0.86956
52
0.75614
4
0.65751
6
0.57175
3
0.49717
7
0.43232
8
PV 565217.
39
4499055 4503986 3916510 3405661 5166315 2205674
4
Initial outflow -
1600000
0
NPV 6056743
.5
Option 1: Sales increase by 10%
Particulars 2021 2022 2023 2024 2025 2026 Total
Revenue 1540000
0
2200000
0
2200000
0
2200000
0
2200000
0
2200000
0
Cost saving 2000000 3500000 3500000 3500000 3500000 3500000
Total incremental
income
1740000
0
2550000
0
2550000
0
2550000
0
2550000
0
2550000
0
Cost of goods sold 1155000
0
1650000
0
1650000
0
1650000
0
1650000
0
1650000
0
Depreciation 3000000 3000000 3000000 3000000 3000000 3000000
Profit before tax 2850000 6000000 6000000 6000000 6000000 6000000
Tax @ 30% 855000 1800000 1800000 1800000 1800000 1800000
Profit after tax 1995000 4200000 4200000 4200000 4200000 4200000
Add: depreciation 3000000 3000000 3000000 3000000 3000000 3000000
tabler-icon-diamond-filled.svg

Paraphrase This Document

Need a fresh take? Get an instant paraphrase of this document with our AI Paraphraser
Document Page
5
Less: Working
capital
-
2310000
-990000 3300000
cash inflow 2685000 6210000 7200000 7200000 7200000 7200000
Cash outflow 2000000
Terminal cash flow 5400000
Net cash flow 685000 6210000 7200000 7200000 7200000 1260000
0
PVF@15% 0.86956
52
0.75614
4
0.65751
6
0.57175
3
0.49717
7
0.43232
8
PV 595652.
17
4695652 4734117 4116623 3579672 5447328 2316904
5
Initial outflow -
1600000
0
NPV 7169044
.8
Option 2: Sales decrease by 10%
Particulars 2021 2022 2023 2024 2025 2026 Total
Revenue 1260000
0
1800000
0
1800000
0
1800000
0
1800000
0
1800000
0
Cost saving 2000000 3500000 3500000 3500000 3500000 3500000
Total incremental
income
1460000
0
2150000
0
2150000
0
2150000
0
2150000
0
2150000
0
Cost of goods sold 9450000 1350000
0
1350000
0
1350000
0
1350000
0
1350000
0
Depreciation 3000000 3000000 3000000 3000000 3000000 3000000
Profit before tax 2150000 5000000 5000000 5000000 5000000 5000000
Tax @ 30% 645000 1500000 1500000 1500000 1500000 1500000
Profit after tax 1505000 3500000 3500000 3500000 3500000 3500000
Add: depreciation 3000000 3000000 3000000 3000000 3000000 3000000
Less: Working
capital
-
1890000
-810000 2700000
cash inflow 2615000 5690000 6500000 6500000 6500000 6500000
Cash outflow 2000000
Terminal cash flow 4800000
Net cash flow 615000 5690000 6500000 6500000 6500000 1130000
0
PVF@15% 0.86956
52
0.75614
4
0.65751
6
0.57175
3
0.49717
7
0.43232
8
PV 534782.
61
4302457 4273856 3716396 3231649 4885302 2094444
2
Initial outflow -
1600000
Document Page
6
0
NPV 4944442
.3
Option 3: Cost of capital increase by 10%
Particulars 2021 2022 2023 2024 2025 2026 Total
Revenue 1400000
0
2000000
0
2000000
0
2000000
0
2000000
0
2000000
0
Cost saving 2000000 3500000 3500000 3500000 3500000 3500000
Total incremental
income
1600000
0
2350000
0
2350000
0
2350000
0
2350000
0
2350000
0
Cost of goods sold 1050000
0
1500000
0
1500000
0
1500000
0
1500000
0
1500000
0
Depreciation 3000000 3000000 3000000 3000000 3000000 3000000
Profit before tax 2500000 5500000 5500000 5500000 5500000 5500000
Tax @ 30% 750000 1650000 1650000 1650000 1650000 1650000
Profit after tax 1750000 3850000 3850000 3850000 3850000 3850000
Add: depreciation 3000000 3000000 3000000 3000000 3000000 3000000
Less: Working
capital
-
2100000
-900000
cash inflow 2650000 5950000 6850000 6850000 6850000 6850000
Cash outflow 2000000
Terminal cash flow 5100000
Net cash flow 650000 5950000 6850000 6850000 6850000 1195000
0
PVF@16.5% 0.85836
91
0.73679
8
0.63244
4
0.54287
1
0.46598
3
0.39998
6
PV 557939.
91
4383945 4332243 3718663 3191986 4779829 2096460
6
Initial outflow -
1600000
0
NPV 4964606
.1
Option 4: Cost of capital decrease by 10%
Particulars 2021 2022 2023 2024 2025 2026 Total
Revenue 1400000
0
2000000
0
2000000
0
2000000
0
2000000
0
2000000
0
Cost saving 2000000 3500000 3500000 3500000 3500000 3500000
Total incremental
income
1600000
0
2350000
0
2350000
0
2350000
0
2350000
0
2350000
0
Cost of goods sold 1050000 1500000 1500000 1500000 1500000 1500000
Document Page
7
0 0 0 0 0 0
Depreciation 3000000 3000000 3000000 3000000 3000000 3000000
Profit before tax 2500000 5500000 5500000 5500000 5500000 5500000
Tax @ 30% 750000 1650000 1650000 1650000 1650000 1650000
Profit after tax 1750000 3850000 3850000 3850000 3850000 3850000
Add: depreciation 3000000 3000000 3000000 3000000 3000000 3000000
Less: Working
capital
-
2100000
-900000
cash inflow 2650000 5950000 6850000 6850000 6850000 6850000
Cash outflow 2000000
Terminal cash flow 5100000
Net cash flow 650000 5950000 6850000 6850000 6850000 1195000
0
PVF@13.5% 0.881057
3
0.77626
2
0.68393
1
0.60258
3
0.53091 0.46776
2
PV 572687.2
2
4618758 4684929 4127690 3636732 5589755 2323055
1
Initial outflow -
1600000
0
NPV 7230551
Particulars Origina
l
Option
1
Option
2
Option 3 Option 4
NPV 6056744 7169045 494444
2
4964606 7230551
% Change in NPV (A) 18.36% -18.36% -18.03% 19.38%
Input which is changing Sales Sales cost of
capital
cost of
capital
% change in Input (B) 10% 10% 10% 10%
Sensitivity
(A/B)
1.83647 -1.8365 -1.8032 1.93802
Worst Best case
tabler-icon-diamond-filled.svg

Paraphrase This Document

Need a fresh take? Get an instant paraphrase of this document with our AI Paraphraser
Document Page
8
References
Brunzell, T., Liljeblom, E. and Vaihekoski, M. (2013) Determinants of capital budgeting
methods and hurdle rates in Nordic firms. Accounting & Finance, 53(1), pp.85-110.
Kilic, M. and Kaya, İ. (2015) Investment project evaluation by a decision-making methodology
based on type-2 fuzzy sets. Applied Soft Computing, 27, pp.399-410.
Yao, S., Mela, C.F., Chiang, J. and Chen, Y. (2012) Determining consumers’ discount rates with
field studies. Journal of Marketing Research, 49(6), pp.822-841.
Document Page
9
chevron_up_icon
1 out of 9
circle_padding
hide_on_mobile
zoom_out_icon