Business Finance Report: Cash Flow and Ratio Analysis of Two Firms
VerifiedAdded on 2020/10/05
|12
|3523
|153
Report
AI Summary
This report provides a detailed analysis of the financial performance of Modern Garden Designs Ltd and GlowSheets Ltd. It begins by defining and explaining key concepts such as profit, cash flow, working capital, receivables, inventory, and payables, including how alterations in working capital impact cash flow. The report then applies these concepts to Modern Garden Designs Ltd, examining its financial results and recommending steps to improve cash flow through better working capital management. Part 2 focuses on GlowSheets Ltd, calculating and analyzing financial ratios, including sales growth, gross profit margin, operating profit margin, and gearing ratio. The analysis reveals trends in financial performance from 20X9 to 20X1, highlighting areas of concern and providing recommendations for improvement. The report concludes by summarizing the key findings and offering insights into the financial health and management strategies of both companies.

BUSINESS FINANCE
Paraphrase This Document
Need a fresh take? Get an instant paraphrase of this document with our AI Paraphraser
EXECUTIVE SUMMARY
Business finance is termed as money and credit which is directly employed in business as
it engages utilization and procurement of funds where various business entities which might be
capable for carrying its operations in efficient aspect. The present report will give brief
discussion about Modern Garden Designs Limited and GlowSheets Ltd on basis of financial
statements and appropriate ratio analysis. By considering Modern Garden Designs Ltd, it has
been suggested that cash flow could be managed easily with reference to better working capital.
In the similar aspect GlowSheets Ltd has to control its operating expense which is giving direct
impact on profitability.
TABLE OF CONTENTS
PART 1 Modern Garden Designs Ltd.............................................................................................1
1.a Explaining meaning of profit and cash flow with its variations............................................1
1.b Explaining working capital, Receivables, Inventory and payables.......................................1
1.c Explaining how alterations in working capital impact cash flow..........................................2
2. Explaining above concepts in Modern Garden Designs Ltd for managing its financial results
......................................................................................................................................................3
3. Analysing and recommending steps for improving cash flow of organization with better
working capital management.......................................................................................................3
PART 2 GlowSheets Ltd.................................................................................................................4
A. Explaining elements of financial performance of each...........................................................4
B. Calculating ratio and changes from year 20X9 to 20X1.........................................................4
C. Analysing changes from year 20X9 to 20X1..........................................................................7
Analysis and recommendation.....................................................................................................8
CONCLUSION................................................................................................................................8
REFERENCES................................................................................................................................9
⊘ This is a preview!⊘
Do you want full access?
Subscribe today to unlock all pages.
Trusted by 1+ million students worldwide
PART 1 Modern Garden Designs Ltd
1.a Explaining meaning of profit and cash flow with its variations
Cash flow is replicated as money which flows out and in to business entity through
financing and operating activities. This is money which is used for accomplishing present and
near term obligations but it must always consider that:
The business could be profitable enough but still with absence of adequate cash flow as
well.
There could be increment in sales simultaneously money could be poured which does not
signifies that profit is created.
Profit is also replicated as net income or what is remained through sales revenue after
deducting each expense of business. It is considered as obvious principal where business could
not sustain unless it is profitable but it could be with context of cash flow, the products' success
could increase its expenses. It might be not apparent on immediate aspect as it is issue. In various
cases, problems could be easily extracted but by decreasing cost of production will help in
restoring profitability for avoiding crisis. Consequently, without appropriate understanding of
relevant data about cost it might not perform effectively and prompt for making business entity
as profitable before it goes out of money (The Critical Differences Between Cash Flow and
Profit, 2018).
1.b Explaining working capital, Receivables, Inventory and payables
Working capital: It is also replicated as net working capital which is difference among
current assets and current liabilities where current assets considers cash, accounts receivables,
inventories of finished goods and raw materials and current liabilities considers accounts payable
and all. It is measure of both organization's short term financial health along with operational
efficiency. If difference is higher on what it own and owe for short term then business is
healthier. If working capital is negative then it is close for being out from business (Yusuf and
Sani, 2018).
Receivables: These are replicated as accounts receivable as well as debts which are
owned through business entity for services and goods which are used or delivered but payment
has been not paid. It is formed through extending credit line to its customers and reported in form
of current assets and in term of required payments which are due with relatively short duration
with range of few days to financial or calendar year. In similar aspect, they are considered as
1
Paraphrase This Document
Need a fresh take? Get an instant paraphrase of this document with our AI Paraphraser
liquid asset as they can be used for purpose of collateral for securing loan to accomplish short
term obligations.
Inventories: It is referred as term for availability of goods for raw materials and sales
which are used for producing goods. Inventory is represented as very important for assets of
business due to its turnover on basis of inventory is termed as primary source for producing
revenue along with subsequent earning for shareholders of organization. It is array of various
finished goods which are used for production which are held through business entity. Generally,
it is classified in balance sheet as current asset. In the similar series, it serves buffer among
manufacturing and fulfilment of order.
Payables: It is an accounting entry which shows obligation of business entity for
repaying its short term debt to its suppliers and creditors. It will appear in balance sheet with
context to current liabilities and its common use has been referred to specific business
department along with division which is responsible for payments which are owned through
company to its suppliers and creditors. These are debit which should be paid within specific
duration for avoiding default. For example at corporate level it refers to short term debt payment
to its suppliers and payable is mandatory for short term informal document through business to
any other organisation (Enow and Kamala, 2018).
1.c Explaining how alterations in working capital impact cash flow
The alteration in working capital would be directly reflected in cash flow statement of
business entity. If there is increment in transactions then current assets and liabilities would raise
by similar amount, so it will not impact working capital. In case organization will purchase fixed
asset like building then cash flow of organization will decrease. In the similar aspect, working
capital of business entity will reduce as portion of cash with context of current assets will be
decreased. However, its current liabilities will not change as it would be long term debt.
Simultaneously, if selling of fixed asset would directly boost working capital along with cash
flow. If organization will purchase inventory through cash then there will be no alteration in
working capital due to cash and inventory both are considered in category of current asset. On
the contrary, cash flow would decrease by inventory purchases (Uwuigbe and et.al., 2018).
In a nutshell, boost in working capital and cash flow might be not good if business entity
will undertake long term debt as it will not generate sufficient cash flow for repaying it.
Consequently, huge decrease in cash flow and working capital which is not bad if company will
2
be using proceeds for investment in fixed assets for long term which will produce earnings in
coming year.
2. Explaining above concepts in Modern Garden Designs Ltd for managing its financial results
The Modern Garden designs limited will be managing its financial outcome as it has
profit of £18 million against sales of £220 million. It has presence of accounts payable with
consignment of £20 million for Brico France which will complete in year 2017 which is not yet
paid as it will led to payment which is withheld during continuation of negotiation among its
lawyers and technical suppliers. With reference to accounts receivable as £8 million as advance
fee through Eastern Fires. Furthermore, on basis of inventory there is requirement with presence
of stock level when dispute is sorted and reluctant to press his key consumers for hard payment.
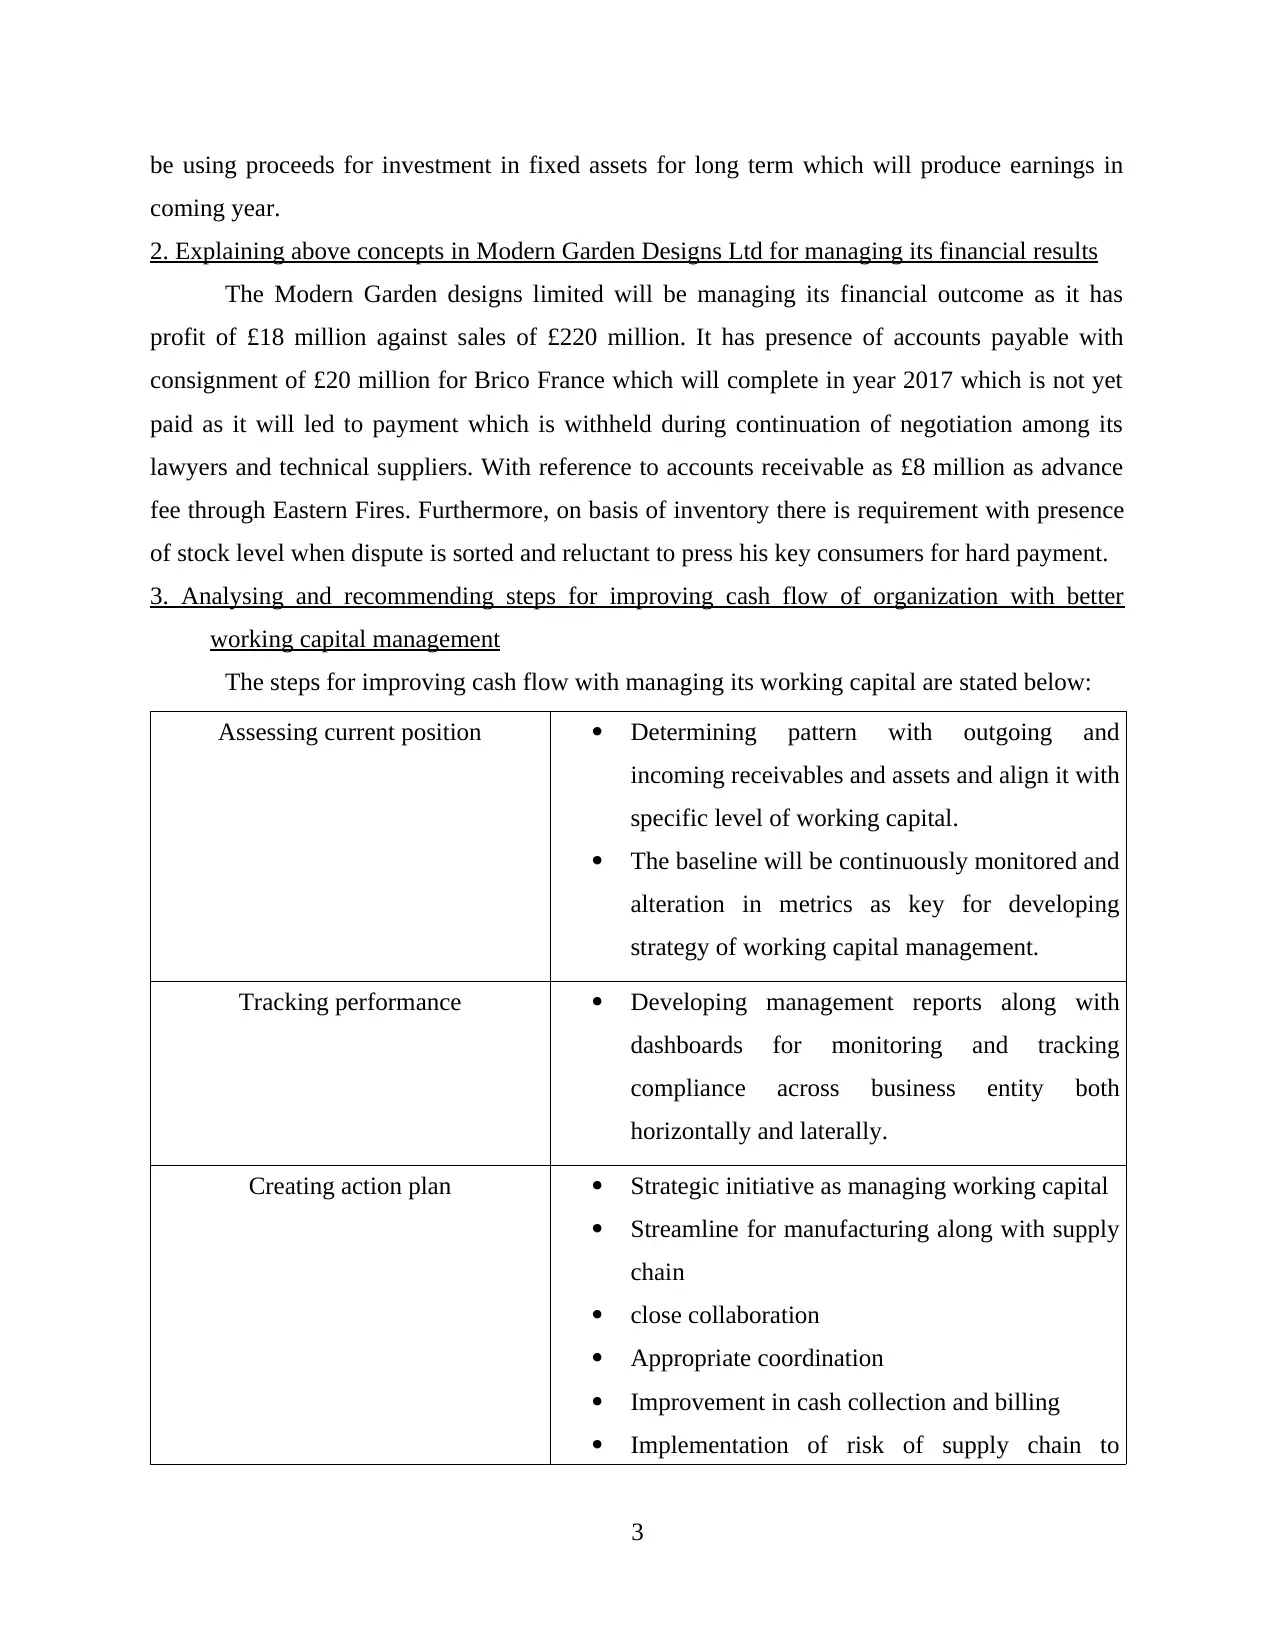
3. Analysing and recommending steps for improving cash flow of organization with better
working capital management
The steps for improving cash flow with managing its working capital are stated below:
Assessing current position Determining pattern with outgoing and
incoming receivables and assets and align it with
specific level of working capital.
The baseline will be continuously monitored and
alteration in metrics as key for developing
strategy of working capital management.
Tracking performance Developing management reports along with
dashboards for monitoring and tracking
compliance across business entity both
horizontally and laterally.
Creating action plan Strategic initiative as managing working capital
Streamline for manufacturing along with supply
chain
close collaboration
Appropriate coordination
Improvement in cash collection and billing
Implementation of risk of supply chain to
3
coming year.
2. Explaining above concepts in Modern Garden Designs Ltd for managing its financial results
The Modern Garden designs limited will be managing its financial outcome as it has
profit of £18 million against sales of £220 million. It has presence of accounts payable with
consignment of £20 million for Brico France which will complete in year 2017 which is not yet
paid as it will led to payment which is withheld during continuation of negotiation among its
lawyers and technical suppliers. With reference to accounts receivable as £8 million as advance
fee through Eastern Fires. Furthermore, on basis of inventory there is requirement with presence
of stock level when dispute is sorted and reluctant to press his key consumers for hard payment.
3. Analysing and recommending steps for improving cash flow of organization with better
working capital management
The steps for improving cash flow with managing its working capital are stated below:
Assessing current position Determining pattern with outgoing and
incoming receivables and assets and align it with
specific level of working capital.
The baseline will be continuously monitored and
alteration in metrics as key for developing
strategy of working capital management.
Tracking performance Developing management reports along with
dashboards for monitoring and tracking
compliance across business entity both
horizontally and laterally.
Creating action plan Strategic initiative as managing working capital
Streamline for manufacturing along with supply
chain
close collaboration
Appropriate coordination
Improvement in cash collection and billing
Implementation of risk of supply chain to
3
⊘ This is a preview!⊘
Do you want full access?
Subscribe today to unlock all pages.
Trusted by 1+ million students worldwide
manage its policies
Continual for improvement Initiative should be sustainable
Continual analysis along with collaboration
PART 2 GlowSheets Ltd
A. Explaining elements of financial performance of each
The elements of financial performance are referred with financial statements which are
stated below:
Revenue: It is referred as income which is earned by business through it normal activities
of business. It is considered as inflow of assets whose outcome is increment in owner's
equity.
Expenses: These are replicated as gross outflow which is incurred through business
entity for producing revenues as it is always charged in Income statement.
Assets: It is legal rights or property which is owned through business by which money
value be directly attached as it is item of economic value which is directly expected for
yield a benefit in coming future. It comprises current and non current assets whereas
current assets could be convertible in cash and non current assets are vice versa.
Liabilities: It is referred as present obligation of business entity which has been arisen
through past events along with settlement which is expected to outcome in outflow
through business entity of its resources for economic benefits. It consists of current and
non current liabilities which are repayable in current financial year and others are due for
payment for long term duration respectively (Zeng and Wudhikarn, 2018).
Equity: It reflects ownership interest in business entity with stock form. In simple words,
it is variation among cost of liabilities and assets value of something owned. Generally,
its residual amount is adjusted through assets against liabilities.
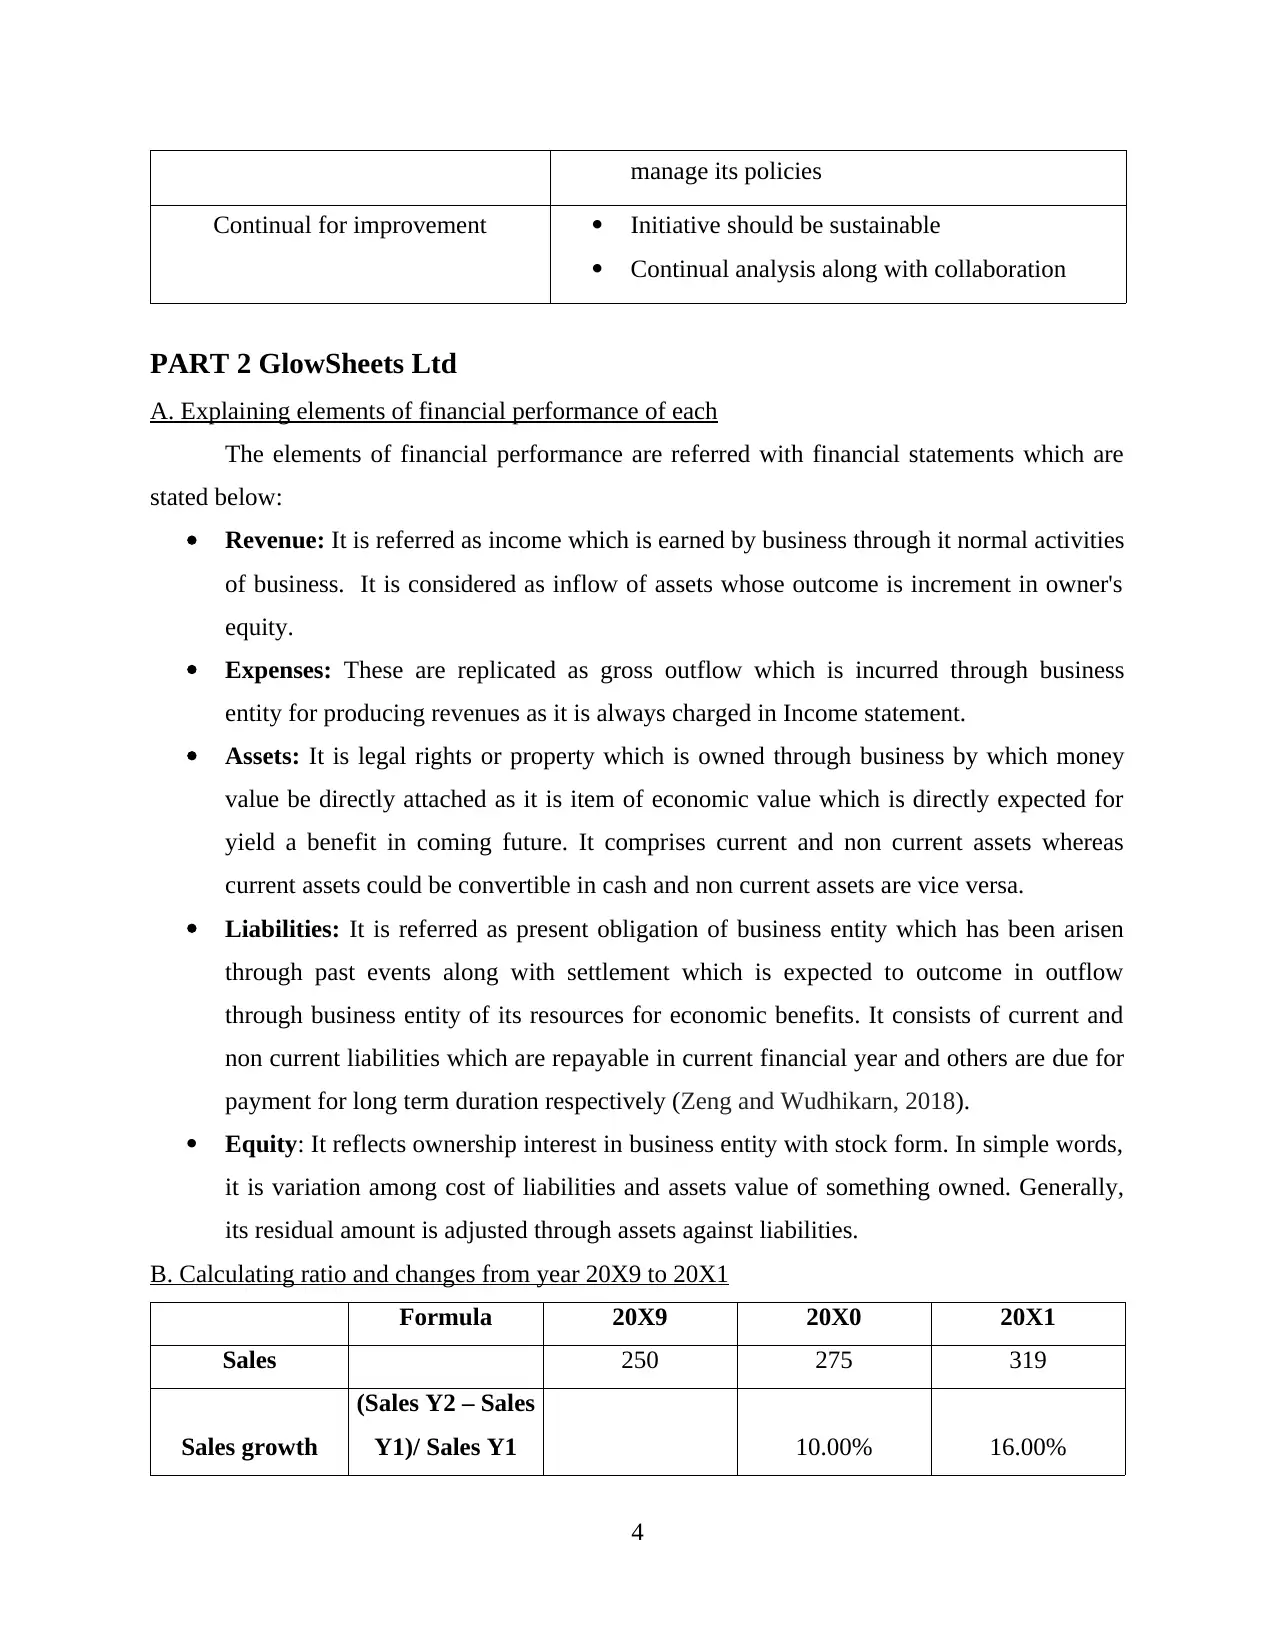
B. Calculating ratio and changes from year 20X9 to 20X1
Formula 20X9 20X0 20X1
Sales 250 275 319
Sales growth
(Sales Y2 – Sales
Y1)/ Sales Y1 10.00% 16.00%
4
Continual for improvement Initiative should be sustainable
Continual analysis along with collaboration
PART 2 GlowSheets Ltd
A. Explaining elements of financial performance of each
The elements of financial performance are referred with financial statements which are
stated below:
Revenue: It is referred as income which is earned by business through it normal activities
of business. It is considered as inflow of assets whose outcome is increment in owner's
equity.
Expenses: These are replicated as gross outflow which is incurred through business
entity for producing revenues as it is always charged in Income statement.
Assets: It is legal rights or property which is owned through business by which money
value be directly attached as it is item of economic value which is directly expected for
yield a benefit in coming future. It comprises current and non current assets whereas
current assets could be convertible in cash and non current assets are vice versa.
Liabilities: It is referred as present obligation of business entity which has been arisen
through past events along with settlement which is expected to outcome in outflow
through business entity of its resources for economic benefits. It consists of current and
non current liabilities which are repayable in current financial year and others are due for
payment for long term duration respectively (Zeng and Wudhikarn, 2018).
Equity: It reflects ownership interest in business entity with stock form. In simple words,
it is variation among cost of liabilities and assets value of something owned. Generally,
its residual amount is adjusted through assets against liabilities.
B. Calculating ratio and changes from year 20X9 to 20X1
Formula 20X9 20X0 20X1
Sales 250 275 319
Sales growth
(Sales Y2 – Sales
Y1)/ Sales Y1 10.00% 16.00%
4
Paraphrase This Document
Need a fresh take? Get an instant paraphrase of this document with our AI Paraphraser
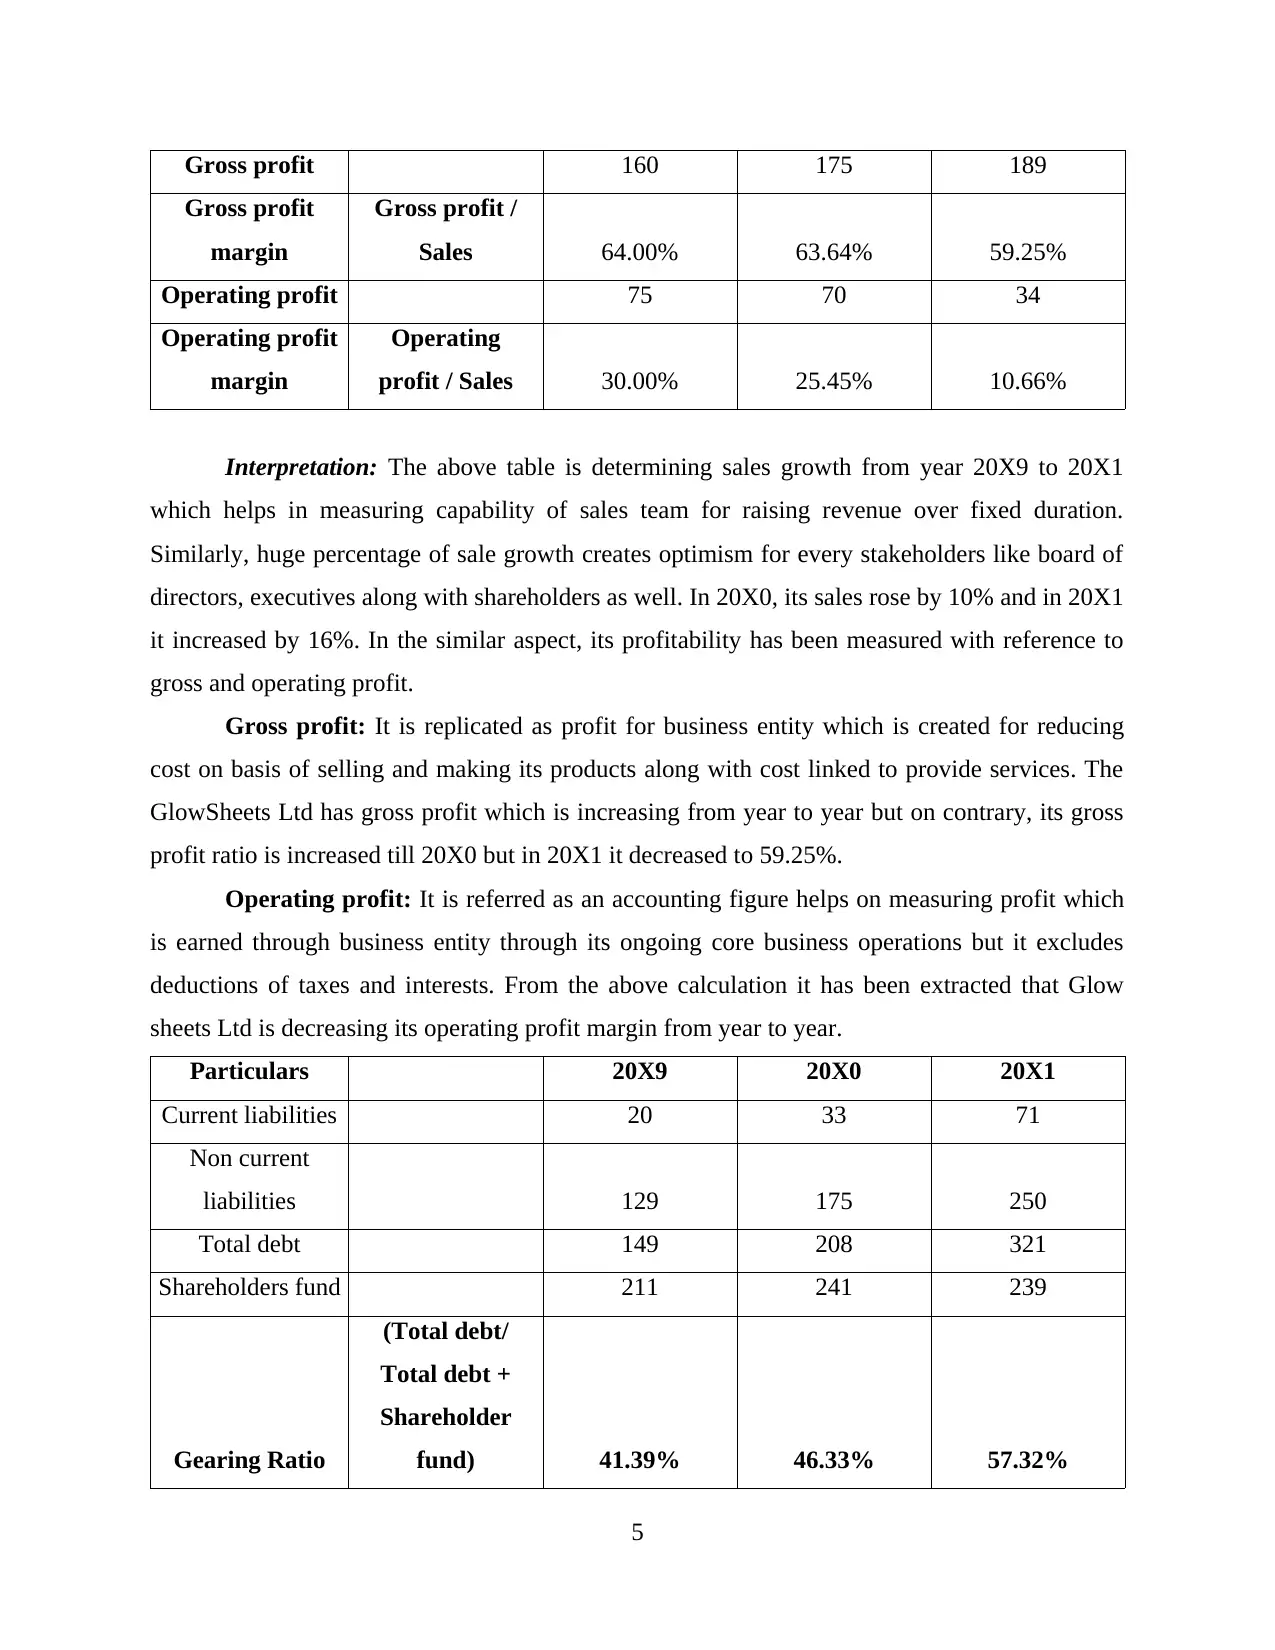
Gross profit 160 175 189
Gross profit
margin
Gross profit /
Sales 64.00% 63.64% 59.25%
Operating profit 75 70 34
Operating profit
margin
Operating
profit / Sales 30.00% 25.45% 10.66%
Interpretation: The above table is determining sales growth from year 20X9 to 20X1
which helps in measuring capability of sales team for raising revenue over fixed duration.
Similarly, huge percentage of sale growth creates optimism for every stakeholders like board of
directors, executives along with shareholders as well. In 20X0, its sales rose by 10% and in 20X1
it increased by 16%. In the similar aspect, its profitability has been measured with reference to
gross and operating profit.
Gross profit: It is replicated as profit for business entity which is created for reducing
cost on basis of selling and making its products along with cost linked to provide services. The
GlowSheets Ltd has gross profit which is increasing from year to year but on contrary, its gross
profit ratio is increased till 20X0 but in 20X1 it decreased to 59.25%.
Operating profit: It is referred as an accounting figure helps on measuring profit which
is earned through business entity through its ongoing core business operations but it excludes
deductions of taxes and interests. From the above calculation it has been extracted that Glow
sheets Ltd is decreasing its operating profit margin from year to year.
Particulars 20X9 20X0 20X1
Current liabilities 20 33 71
Non current
liabilities 129 175 250
Total debt 149 208 321
Shareholders fund 211 241 239
Gearing Ratio
(Total debt/
Total debt +
Shareholder
fund) 41.39% 46.33% 57.32%
5
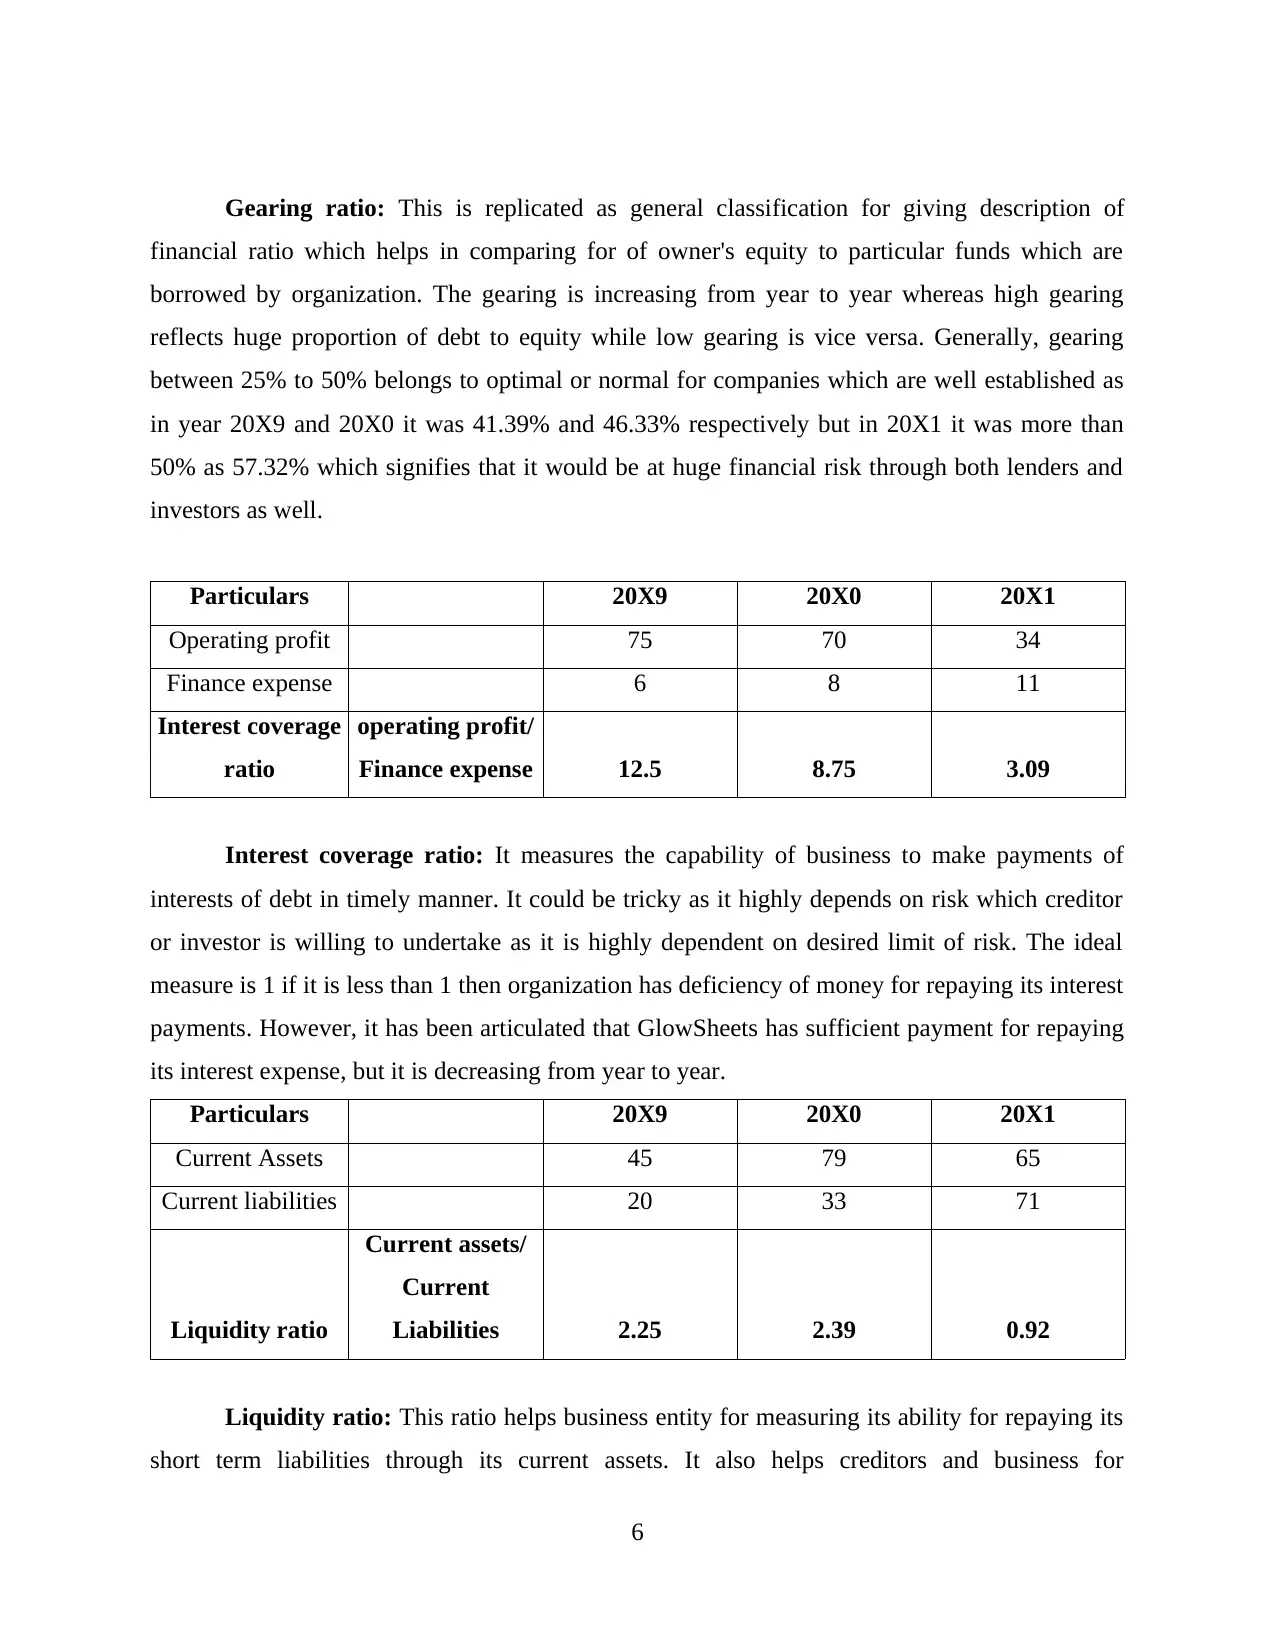
Gearing ratio: This is replicated as general classification for giving description of
financial ratio which helps in comparing for of owner's equity to particular funds which are
borrowed by organization. The gearing is increasing from year to year whereas high gearing
reflects huge proportion of debt to equity while low gearing is vice versa. Generally, gearing
between 25% to 50% belongs to optimal or normal for companies which are well established as
in year 20X9 and 20X0 it was 41.39% and 46.33% respectively but in 20X1 it was more than
50% as 57.32% which signifies that it would be at huge financial risk through both lenders and
investors as well.
Particulars 20X9 20X0 20X1
Operating profit 75 70 34
Finance expense 6 8 11
Interest coverage
ratio
operating profit/
Finance expense 12.5 8.75 3.09
Interest coverage ratio: It measures the capability of business to make payments of
interests of debt in timely manner. It could be tricky as it highly depends on risk which creditor
or investor is willing to undertake as it is highly dependent on desired limit of risk. The ideal
measure is 1 if it is less than 1 then organization has deficiency of money for repaying its interest
payments. However, it has been articulated that GlowSheets has sufficient payment for repaying
its interest expense, but it is decreasing from year to year.
Particulars 20X9 20X0 20X1
Current Assets 45 79 65
Current liabilities 20 33 71
Liquidity ratio
Current assets/
Current
Liabilities 2.25 2.39 0.92
Liquidity ratio: This ratio helps business entity for measuring its ability for repaying its
short term liabilities through its current assets. It also helps creditors and business for
6
⊘ This is a preview!⊘
Do you want full access?
Subscribe today to unlock all pages.
Trusted by 1+ million students worldwide
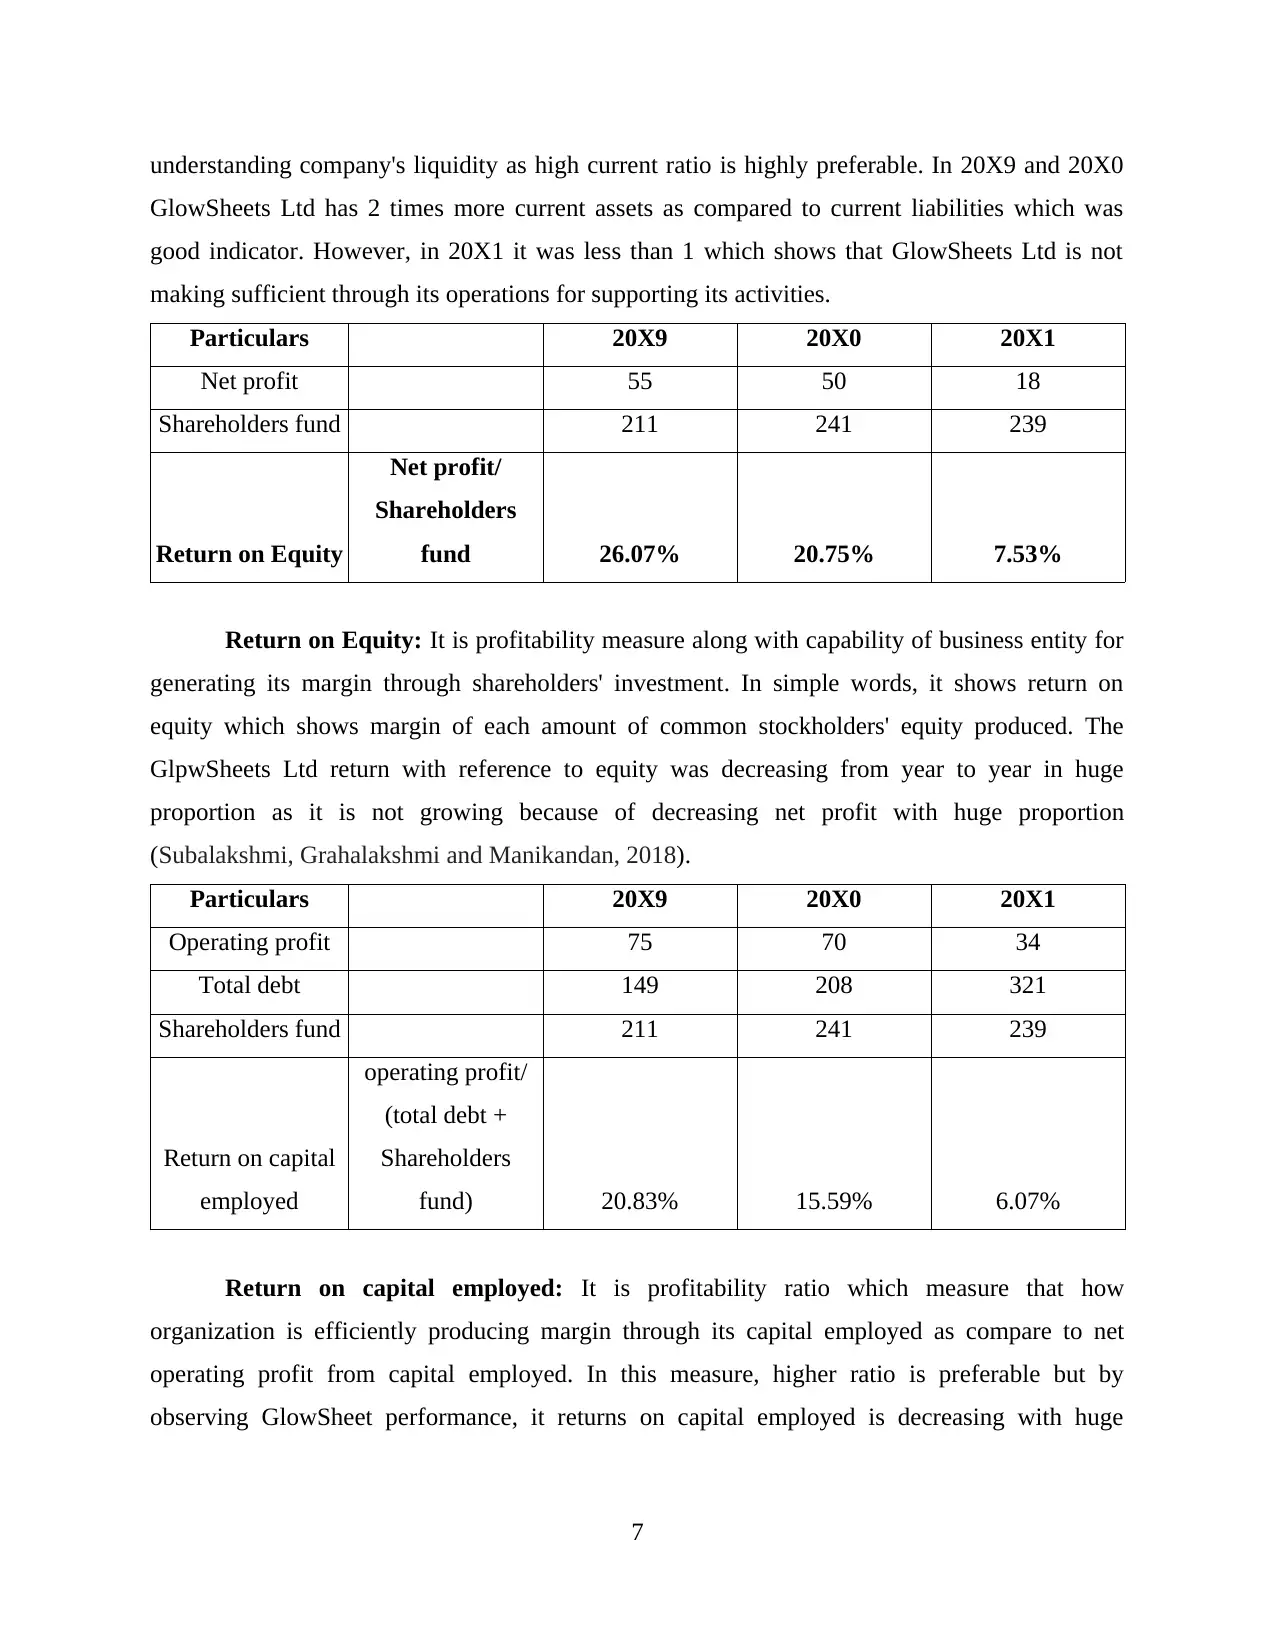
understanding company's liquidity as high current ratio is highly preferable. In 20X9 and 20X0
GlowSheets Ltd has 2 times more current assets as compared to current liabilities which was
good indicator. However, in 20X1 it was less than 1 which shows that GlowSheets Ltd is not
making sufficient through its operations for supporting its activities.
Particulars 20X9 20X0 20X1
Net profit 55 50 18
Shareholders fund 211 241 239
Return on Equity
Net profit/
Shareholders
fund 26.07% 20.75% 7.53%
Return on Equity: It is profitability measure along with capability of business entity for
generating its margin through shareholders' investment. In simple words, it shows return on
equity which shows margin of each amount of common stockholders' equity produced. The
GlpwSheets Ltd return with reference to equity was decreasing from year to year in huge
proportion as it is not growing because of decreasing net profit with huge proportion
(Subalakshmi, Grahalakshmi and Manikandan, 2018).
Particulars 20X9 20X0 20X1
Operating profit 75 70 34
Total debt 149 208 321
Shareholders fund 211 241 239
Return on capital
employed
operating profit/
(total debt +
Shareholders
fund) 20.83% 15.59% 6.07%
Return on capital employed: It is profitability ratio which measure that how
organization is efficiently producing margin through its capital employed as compare to net
operating profit from capital employed. In this measure, higher ratio is preferable but by
observing GlowSheet performance, it returns on capital employed is decreasing with huge
7
Paraphrase This Document
Need a fresh take? Get an instant paraphrase of this document with our AI Paraphraser
proportion as its total debt and shareholders fund is in appropriate position but its operating
profit has decreased from 70 to 34 which is impacting the returns.
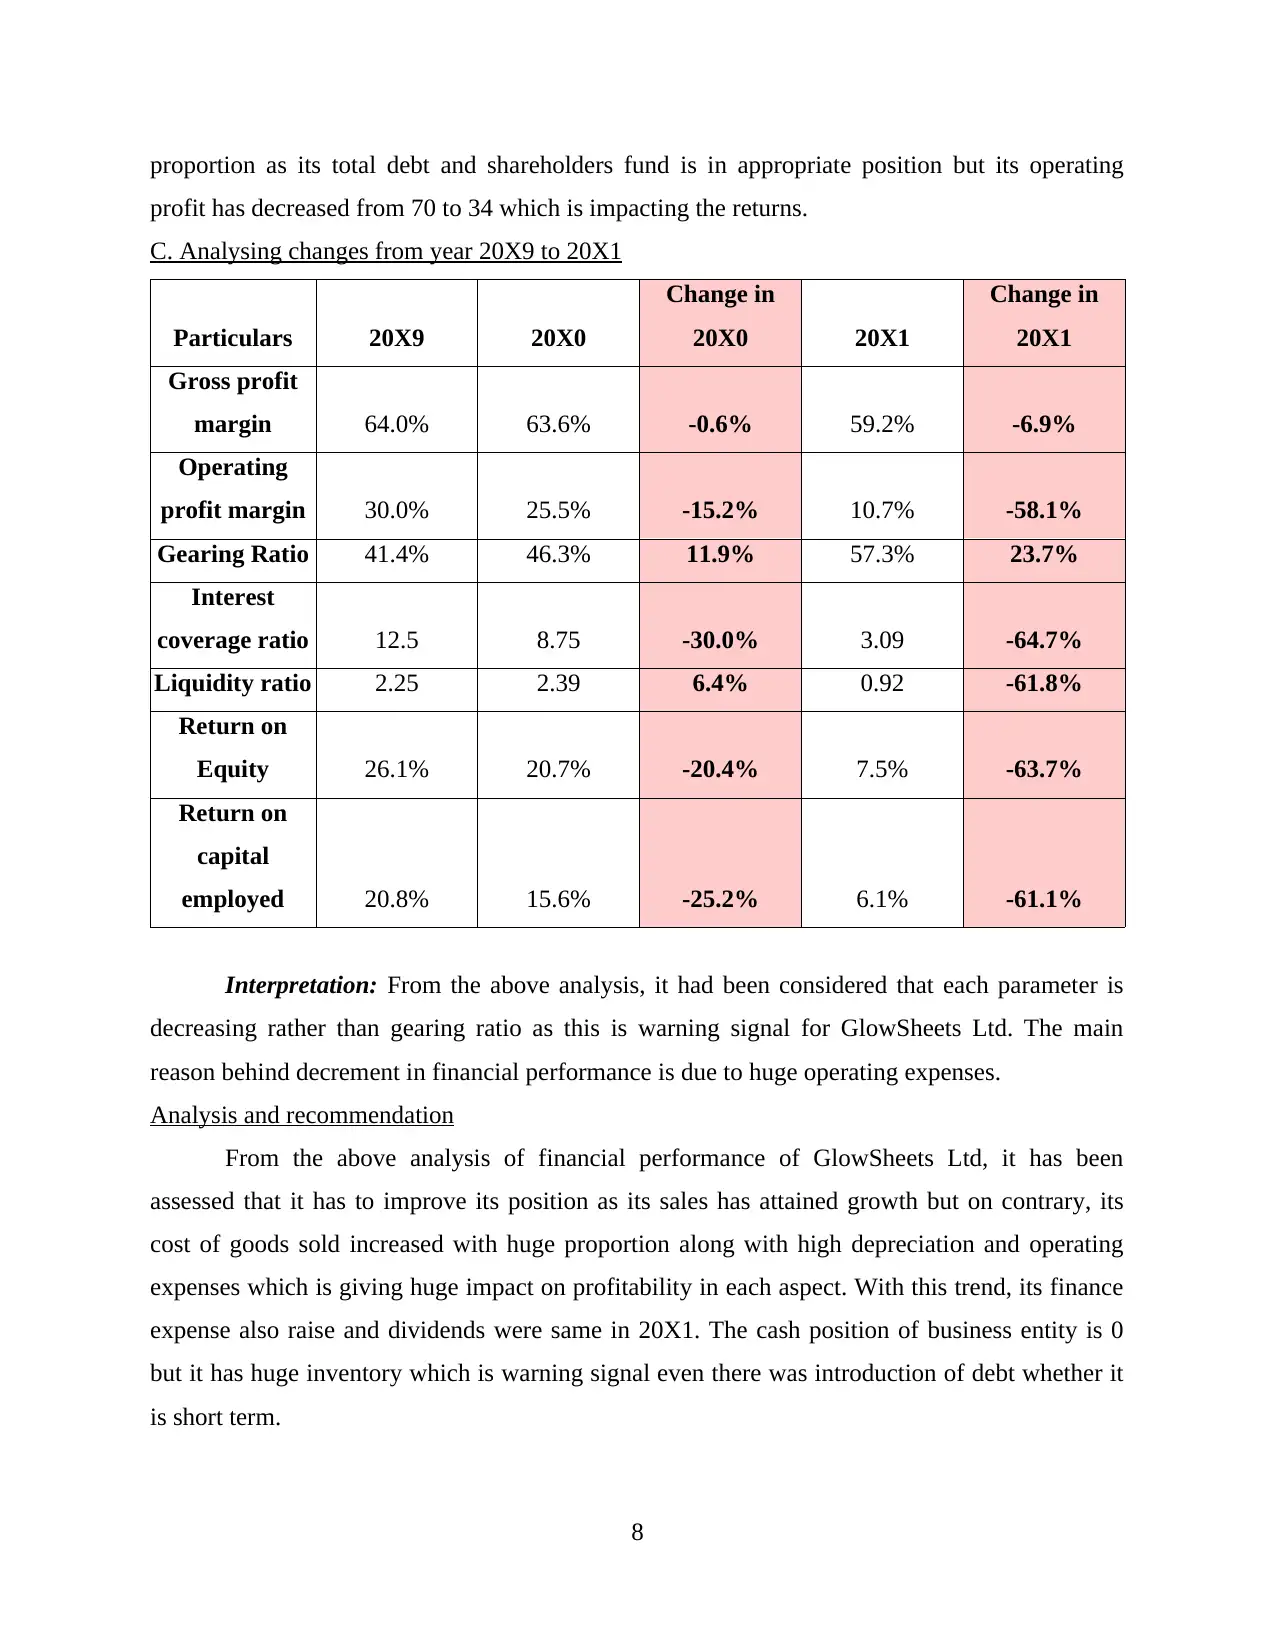
C. Analysing changes from year 20X9 to 20X1
Particulars 20X9 20X0
Change in
20X0 20X1
Change in
20X1
Gross profit
margin 64.0% 63.6% -0.6% 59.2% -6.9%
Operating
profit margin 30.0% 25.5% -15.2% 10.7% -58.1%
Gearing Ratio 41.4% 46.3% 11.9% 57.3% 23.7%
Interest
coverage ratio 12.5 8.75 -30.0% 3.09 -64.7%
Liquidity ratio 2.25 2.39 6.4% 0.92 -61.8%
Return on
Equity 26.1% 20.7% -20.4% 7.5% -63.7%
Return on
capital
employed 20.8% 15.6% -25.2% 6.1% -61.1%
Interpretation: From the above analysis, it had been considered that each parameter is
decreasing rather than gearing ratio as this is warning signal for GlowSheets Ltd. The main
reason behind decrement in financial performance is due to huge operating expenses.
Analysis and recommendation
From the above analysis of financial performance of GlowSheets Ltd, it has been
assessed that it has to improve its position as its sales has attained growth but on contrary, its
cost of goods sold increased with huge proportion along with high depreciation and operating
expenses which is giving huge impact on profitability in each aspect. With this trend, its finance
expense also raise and dividends were same in 20X1. The cash position of business entity is 0
but it has huge inventory which is warning signal even there was introduction of debt whether it
is short term.
8
profit has decreased from 70 to 34 which is impacting the returns.
C. Analysing changes from year 20X9 to 20X1
Particulars 20X9 20X0
Change in
20X0 20X1
Change in
20X1
Gross profit
margin 64.0% 63.6% -0.6% 59.2% -6.9%
Operating
profit margin 30.0% 25.5% -15.2% 10.7% -58.1%
Gearing Ratio 41.4% 46.3% 11.9% 57.3% 23.7%
Interest
coverage ratio 12.5 8.75 -30.0% 3.09 -64.7%
Liquidity ratio 2.25 2.39 6.4% 0.92 -61.8%
Return on
Equity 26.1% 20.7% -20.4% 7.5% -63.7%
Return on
capital
employed 20.8% 15.6% -25.2% 6.1% -61.1%
Interpretation: From the above analysis, it had been considered that each parameter is
decreasing rather than gearing ratio as this is warning signal for GlowSheets Ltd. The main
reason behind decrement in financial performance is due to huge operating expenses.
Analysis and recommendation
From the above analysis of financial performance of GlowSheets Ltd, it has been
assessed that it has to improve its position as its sales has attained growth but on contrary, its
cost of goods sold increased with huge proportion along with high depreciation and operating
expenses which is giving huge impact on profitability in each aspect. With this trend, its finance
expense also raise and dividends were same in 20X1. The cash position of business entity is 0
but it has huge inventory which is warning signal even there was introduction of debt whether it
is short term.
8
Further, it has been recommended that GlowSheets Ltd must control its expenditure
which are incurred with involvement of any activity which is directly linked with productions of
services and goods as they are similar to general, administrative and selling expenses. This action
will give positive impact to the financial performance of GlowSheets Ltd.
CONCLUSION
From the above study it had been concluded that financial statements are very important
for monitoring the performance and to articulate its trends as well. By considering Modern
Garden Designs Ltd, it has been suggested that cash flow could be managed easily with reference
to better working capital. In the similar aspect GlowSheets Ltd has to control its operating
expense which is giving direct impact on profitability.
9
⊘ This is a preview!⊘
Do you want full access?
Subscribe today to unlock all pages.
Trusted by 1+ million students worldwide
1 out of 12
Related Documents


Your All-in-One AI-Powered Toolkit for Academic Success.
+13062052269
info@desklib.com
Available 24*7 on WhatsApp / Email
![[object Object]](/_next/static/media/star-bottom.7253800d.svg)
Unlock your academic potential
Copyright © 2020–2026 A2Z Services. All Rights Reserved. Developed and managed by ZUCOL.