Financing Business Initiatives Report - Finance, DCF and LBO Analysis
VerifiedAdded on 2020/02/12
|23
|5549
|88
Report
AI Summary
This report provides a comprehensive analysis of financing business initiatives, utilizing both the Discounted Cash Flow (DCF) and Leveraged Buyout (LBO) models. It begins with an overview of the finance domain, discussing the acquisition of firms and the importance of financial modeling tools. The report applies the Porter five forces model to the cloud computing industry, assessing the threats and opportunities for potential acquisitions. It then identifies and explains the characteristics of a good LBO candidate, followed by an examination of how a Private Equity (PE) firm can align its interests with the managers of a target company. The report details various debt structures and sources of finance, and includes a detailed DCF model with calculations to determine the intrinsic value of shares. Furthermore, an LBO model is applied to evaluate potential investments, covering exit strategies and private equity fund structures. The analysis includes tables illustrating financial data, such as free cash flow calculations, cost sheets, terminal values, equity values, and debt structures, providing a thorough understanding of the financial aspects of business initiatives.
FINANCING BUSINESS
INITIATIVES
INITIATIVES
Paraphrase This Document
Need a fresh take? Get an instant paraphrase of this document with our AI Paraphraser
TABLE OF CONTENTS
INTRODUCTION...........................................................................................................................1
Question 1Porter five forces model on cloud computing industry.............................................1
Question 2 Identification and explanation of characteristics of good LBO candidate................2
Question 3 Ways in which PE firm 3M can align its interests to mangers of relevant company 2
Question 4Debt structures and sources of finance......................................................................3
Question 5DCF model and explanation on calculations ............................................................3
LBO model..................................................................................................................................6
Question 7 Exit strategies in LBO ...........................................................................................10
Question 8 Private equity fund structures, fund terms, economic terms and corporate governance terms used by PE firms 11
Reflective.......................................................................................................................................12
CONCLUSION..............................................................................................................................13
REFERENCES..............................................................................................................................14
Index of Tables
Table 1Calculation of free cash flow...............................................................................................6
Table 2Cost sheet.............................................................................................................................7
Table 3PV at 10% WACC...............................................................................................................7
Table 4Terminal values....................................................................................................................7
Table 5Equity value.........................................................................................................................8
Table 6Intrinsic value of shares.......................................................................................................8
Table 7Financing structure of LBO.................................................................................................9
Table 8Implied debt burden table....................................................................................................9
Table 9Debt split of overall debt amount across years....................................................................9
Table 10Interest rate......................................................................................................................10
Table 11Calculation.......................................................................................................................10
Table 12Calculation of free cash flow...........................................................................................10
Table 13Cash flows calculation.....................................................................................................11
Table 14Cash conversion table......................................................................................................11
Table 15EBITDA and FCF............................................................................................................11
Table 16Debt pay down table........................................................................................................11
Table 17Cash flow available for debt repayment..........................................................................12
Table 18IRR table..........................................................................................................................12
⊘ This is a preview!⊘
Do you want full access?
Subscribe today to unlock all pages.
Trusted by 1+ million students worldwide
INTRODUCTION
Finance is the vast domain and number of things are performed under it. Every year number of firms acquired other one across
the globe. There are number of tools that are used by these firms to make decisions like discounted cash flow model and leverage
buyout model. There is great use of both models for the firms. In case of discounted cash flow model real value of shares is computed
and on that basis it is identified whether shares are available at higher or low price. Apart from this, in the report leverage buyout
model is applied on cash flows and on that basis it is identified whether investment must be made in the firm. It can be said that
complex calculations are performed and interpreted in current report.
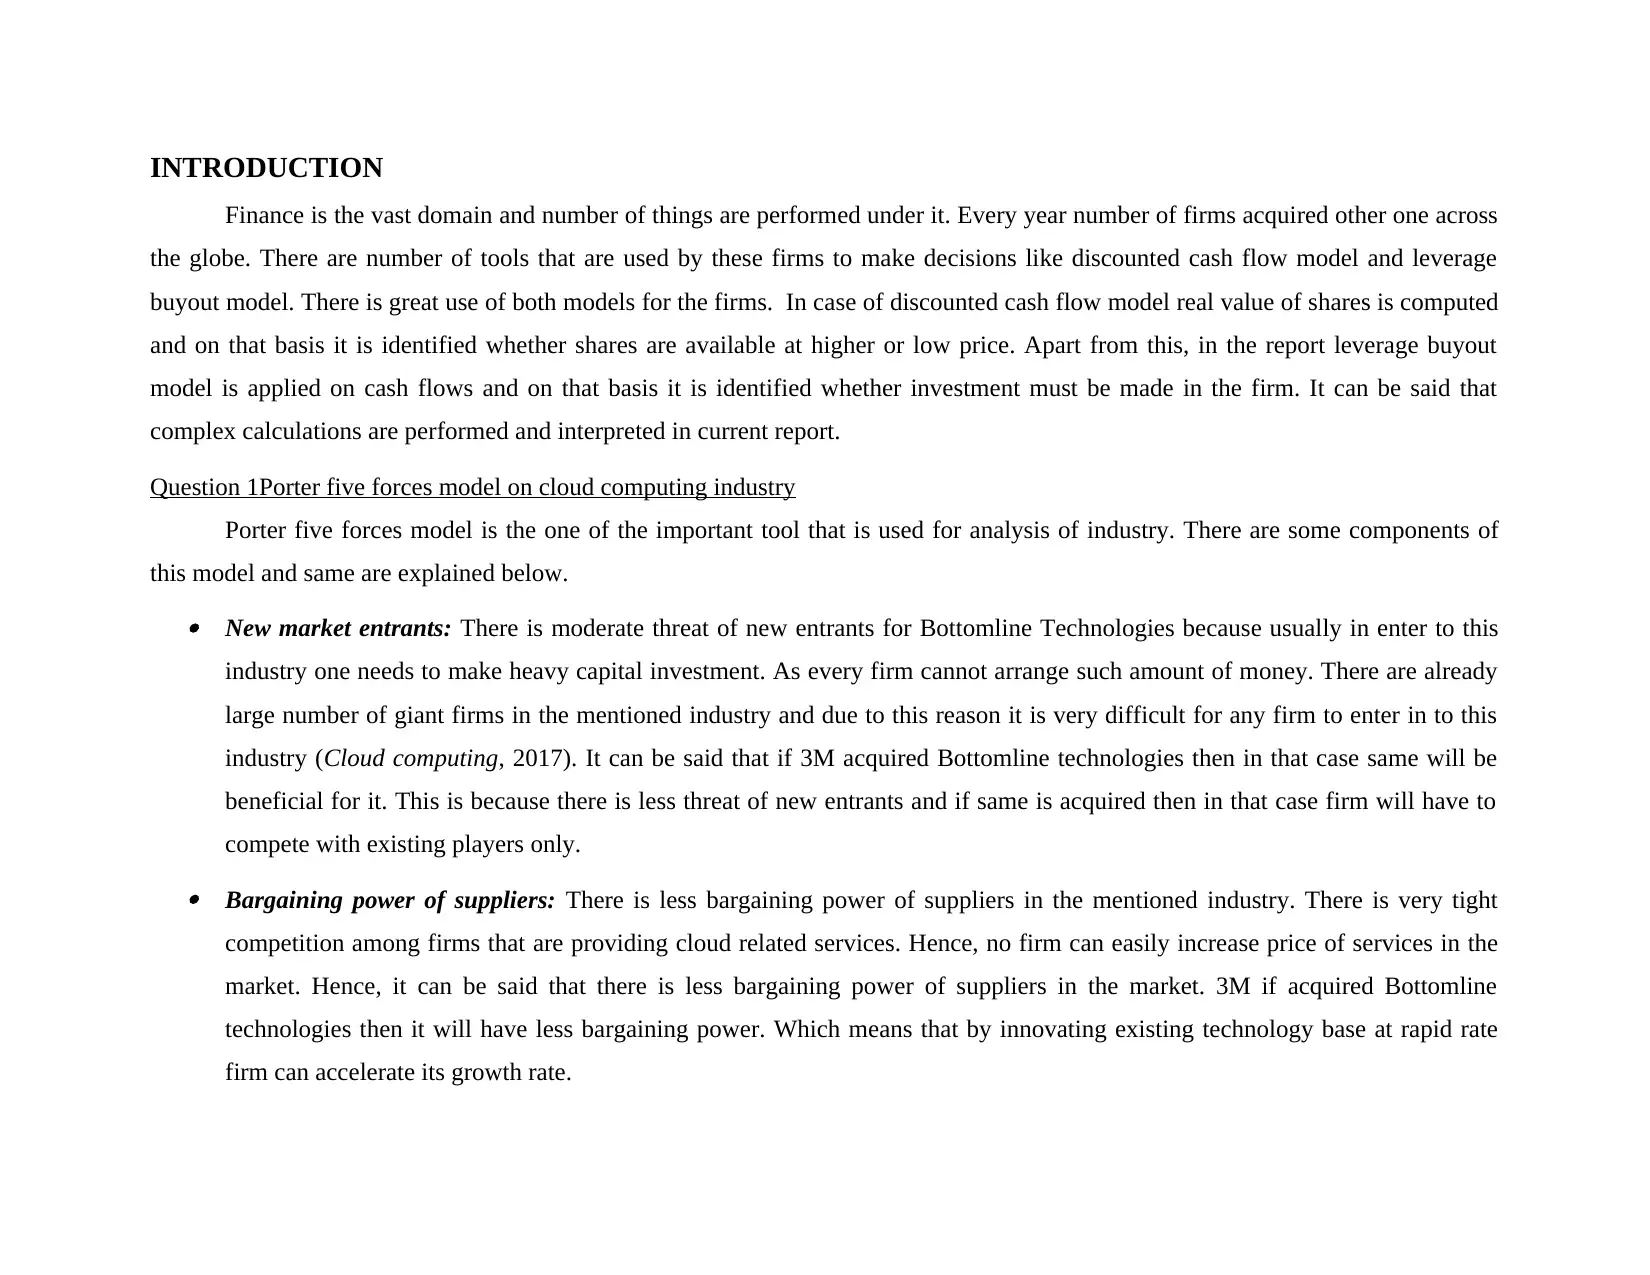
Question 1Porter five forces model on cloud computing industry
Porter five forces model is the one of the important tool that is used for analysis of industry. There are some components of
this model and same are explained below. New market entrants: There is moderate threat of new entrants for Bottomline Technologies because usually in enter to this
industry one needs to make heavy capital investment. As every firm cannot arrange such amount of money. There are already
large number of giant firms in the mentioned industry and due to this reason it is very difficult for any firm to enter in to this
industry (Cloud computing, 2017). It can be said that if 3M acquired Bottomline technologies then in that case same will be
beneficial for it. This is because there is less threat of new entrants and if same is acquired then in that case firm will have to
compete with existing players only. Bargaining power of suppliers: There is less bargaining power of suppliers in the mentioned industry. There is very tight
competition among firms that are providing cloud related services. Hence, no firm can easily increase price of services in the
market. Hence, it can be said that there is less bargaining power of suppliers in the market. 3M if acquired Bottomline
technologies then it will have less bargaining power. Which means that by innovating existing technology base at rapid rate
firm can accelerate its growth rate.
Finance is the vast domain and number of things are performed under it. Every year number of firms acquired other one across
the globe. There are number of tools that are used by these firms to make decisions like discounted cash flow model and leverage
buyout model. There is great use of both models for the firms. In case of discounted cash flow model real value of shares is computed
and on that basis it is identified whether shares are available at higher or low price. Apart from this, in the report leverage buyout
model is applied on cash flows and on that basis it is identified whether investment must be made in the firm. It can be said that
complex calculations are performed and interpreted in current report.
Question 1Porter five forces model on cloud computing industry
Porter five forces model is the one of the important tool that is used for analysis of industry. There are some components of
this model and same are explained below. New market entrants: There is moderate threat of new entrants for Bottomline Technologies because usually in enter to this
industry one needs to make heavy capital investment. As every firm cannot arrange such amount of money. There are already
large number of giant firms in the mentioned industry and due to this reason it is very difficult for any firm to enter in to this
industry (Cloud computing, 2017). It can be said that if 3M acquired Bottomline technologies then in that case same will be
beneficial for it. This is because there is less threat of new entrants and if same is acquired then in that case firm will have to
compete with existing players only. Bargaining power of suppliers: There is less bargaining power of suppliers in the mentioned industry. There is very tight
competition among firms that are providing cloud related services. Hence, no firm can easily increase price of services in the
market. Hence, it can be said that there is less bargaining power of suppliers in the market. 3M if acquired Bottomline
technologies then it will have less bargaining power. Which means that by innovating existing technology base at rapid rate
firm can accelerate its growth rate.
Paraphrase This Document
Need a fresh take? Get an instant paraphrase of this document with our AI Paraphraser

Bargaining power of buyers: There is high bargaining power of buyers because they have options and on the basis of quality
of service they can switch to any supplier of services. Hence, it can be said that there is high bargaining power of buyers in the
cloud computing market. There is risk in acquisition of Bottomline technologies as number of alternatives are available to the
customers and they can switch anytime to any product. It can be said that it will be very difficult task for the firm to retain its
customers. Threat from substitutes: There is less threat from substitutes in the market because alternatives of the product are not so
available in the market. Means that in large number alternatives of the product are not available in the market. It can be said
that varied firms are making available almost same services in the market. Technology is not changing at very fast rate and due
to this reason there is no substitute of the current services (Latham and Braun, 2011). This is positive point for 3M and by
considering this factor it can take decision to purchase Bottomline technologies.
Threat from new competitors: There is less competition to the existing firms from the newly entered company. This is because
firms that are operating from three or four years have strong infrastructure then those newly enter in the market. It is the
second risk that is associated with the acquisition of Bottomline technologies. In case rivals innovate their services it become
difficult for 3M to gain benefits from LBO deal.
Question 2 Identification and explanation of characteristics of good LBO candidate
Characteristics for good LBO candidate is given below. Consistency in cash flows: If firm to which any company wants to acquire have elevation in cash flows in previous years
consistently. Then in that case relevant firm is good candidate (Ivashina and Kovner 2011). Large amount of tangible assets: Bottomline technologies must be large amount of assets in its business to become best
candidate of LBO for 3M. Assets of purchased company are kept as collateral by 3M while taking loan from market. In case
there are large assets then some of its portion will remain completely in hands of firm by selling which it can good amount of
revenue.
Limited working capital requirements: If in any business working capital requirement is less than it is best candidate because
with small amount same can be operated by any company.
Question 3 Ways in which PE firm 3M can align its interests to mangers of relevant company
There are many ways in which 3M can align its interest with managers of Bottomline technology and under this it can
communicate them that they wants to sale a firm stake so that money can be received for investment in the business. In order to
improve business performance firm needs intellectual capital that invest money in right way (Turco 2010). That capital can be
invested in prudent manner by receiving guidance from the PE firm. Thus, in this way 3M can align its interests with the Bottomline
technology. Apart from this providing a reasonable amount of money to firm in LBO is another incentive that can be provided to
target company managers.
Question 4Debt structures and sources of finance Revolving credit facility (Revolver): Under this approach firm can take debt up to certain limit as specified by the bank and
repay the debt amount when it have surplus cash in its business. This method is used to finance LBO deals at large scale by the
business firms. Bank debt: Debt is also taken from the banks and other financial institutions and under this at specific rate debt is available
which is used to purchase debt of the target bank under LBO deal (Kim and McCue 2012). It is the commonly used source of
finance under LBO deals.
Mezzanine: It is also known as subordinated debt and under this debt is raised from the market in conjunction to senior debt
and it have features of both debt and equity. Along with above it is third alternative that is quite popular among firms.
⊘ This is a preview!⊘
Do you want full access?
Subscribe today to unlock all pages.
Trusted by 1+ million students worldwide
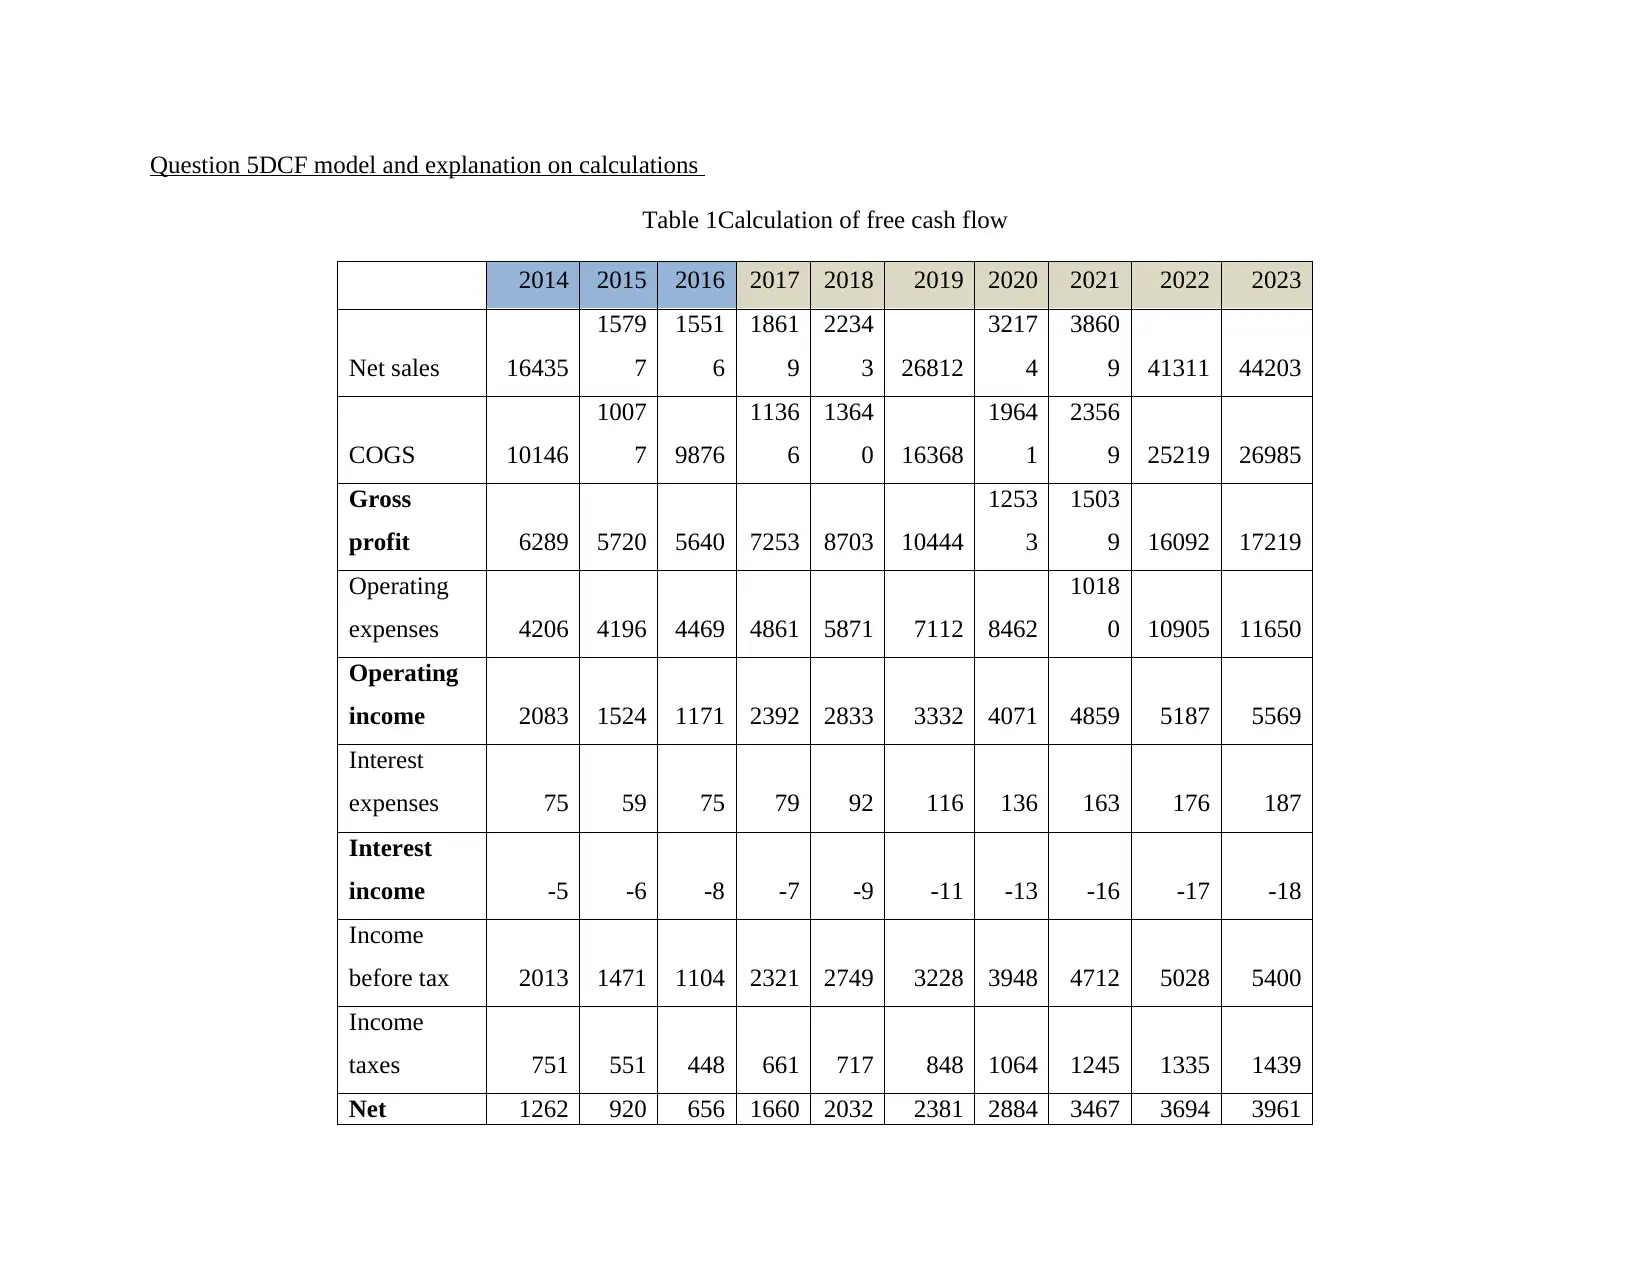
Question 5DCF model and explanation on calculations
Table 1Calculation of free cash flow
2014 2015 2016 2017 2018 2019 2020 2021 2022 2023
Net sales 16435
1579
7
1551
6
1861
9
2234
3 26812
3217
4
3860
9 41311 44203
COGS 10146
1007
7 9876
1136
6
1364
0 16368
1964
1
2356
9 25219 26985
Gross
profit 6289 5720 5640 7253 8703 10444
1253
3
1503
9 16092 17219
Operating
expenses 4206 4196 4469 4861 5871 7112 8462
1018
0 10905 11650
Operating
income 2083 1524 1171 2392 2833 3332 4071 4859 5187 5569
Interest
expenses 75 59 75 79 92 116 136 163 176 187
Interest
income -5 -6 -8 -7 -9 -11 -13 -16 -17 -18
Income
before tax 2013 1471 1104 2321 2749 3228 3948 4712 5028 5400
Income
taxes 751 551 448 661 717 848 1064 1245 1335 1439
Net 1262 920 656 1660 2032 2381 2884 3467 3694 3961
Paraphrase This Document
Need a fresh take? Get an instant paraphrase of this document with our AI Paraphraser
operating
profit after
tax
Depreciatio
n and
amortizatio
n 593 593 593 712 849 1023 1226 1470 1575 1684
Working
capital
change 821.75
789.
85
775.
8 931 1117 1341 1609 1930 2066 2210
Operating
cash flow
1033.2
5
723.
15
473.
2 1440 1764 2063 2502 3007 3203 3435
CAPEX 714 726 524 764 900 1029 1284 1525 1622 1748
Free cash
flow 319.25 -2.85 -50.8
675.
8731
3
864.
5392
1034.
21456
1217
.968
1481.
5846
1580.
89456
1687.0
5489
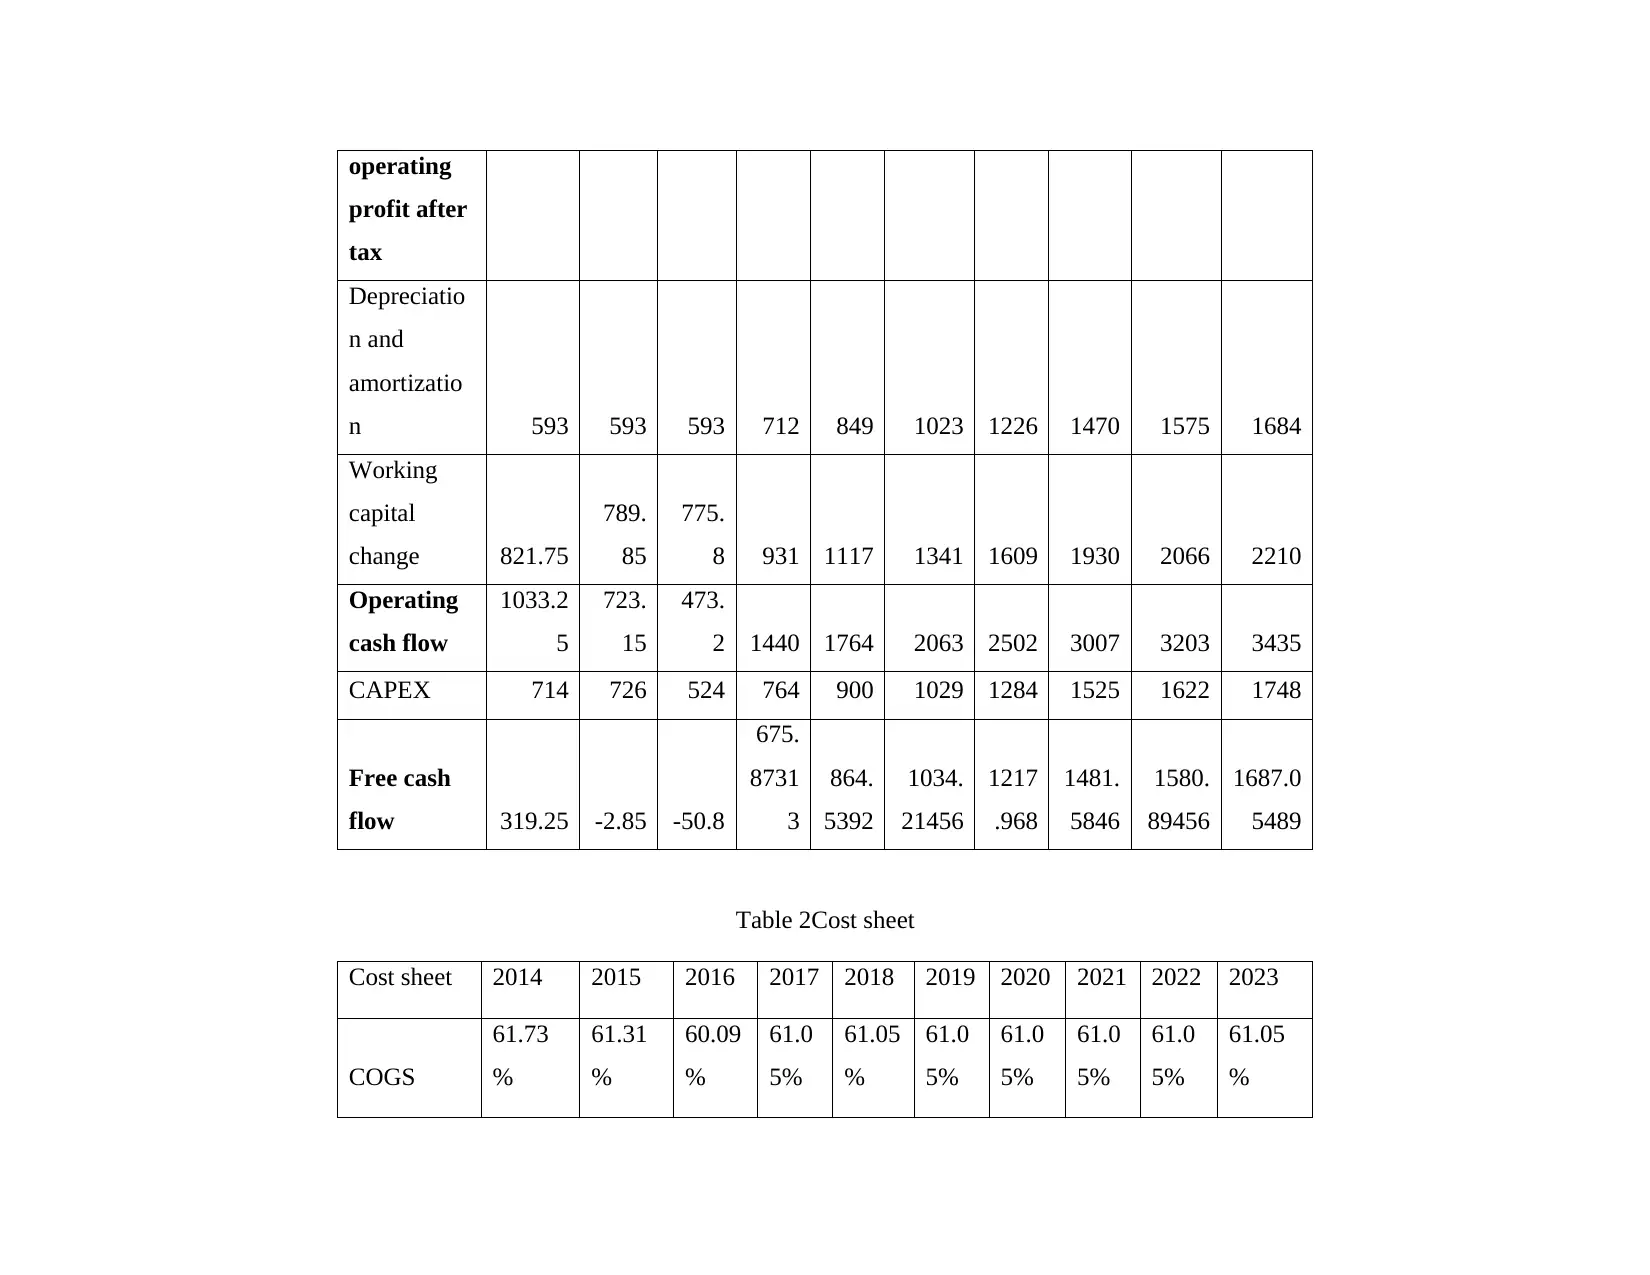
Table 2Cost sheet
Cost sheet 2014 2015 2016 2017 2018 2019 2020 2021 2022 2023
COGS
61.73
%
61.31
%
60.09
%
61.0
5%
61.05
%
61.0
5%
61.0
5%
61.0
5%
61.0
5%
61.05
%
profit after
tax
Depreciatio
n and
amortizatio
n 593 593 593 712 849 1023 1226 1470 1575 1684
Working
capital
change 821.75
789.
85
775.
8 931 1117 1341 1609 1930 2066 2210
Operating
cash flow
1033.2
5
723.
15
473.
2 1440 1764 2063 2502 3007 3203 3435
CAPEX 714 726 524 764 900 1029 1284 1525 1622 1748
Free cash
flow 319.25 -2.85 -50.8
675.
8731
3
864.
5392
1034.
21456
1217
.968
1481.
5846
1580.
89456
1687.0
5489
Table 2Cost sheet
Cost sheet 2014 2015 2016 2017 2018 2019 2020 2021 2022 2023
COGS
61.73
%
61.31
%
60.09
%
61.0
5%
61.05
%
61.0
5%
61.0
5%
61.0
5%
61.0
5%
61.05
%
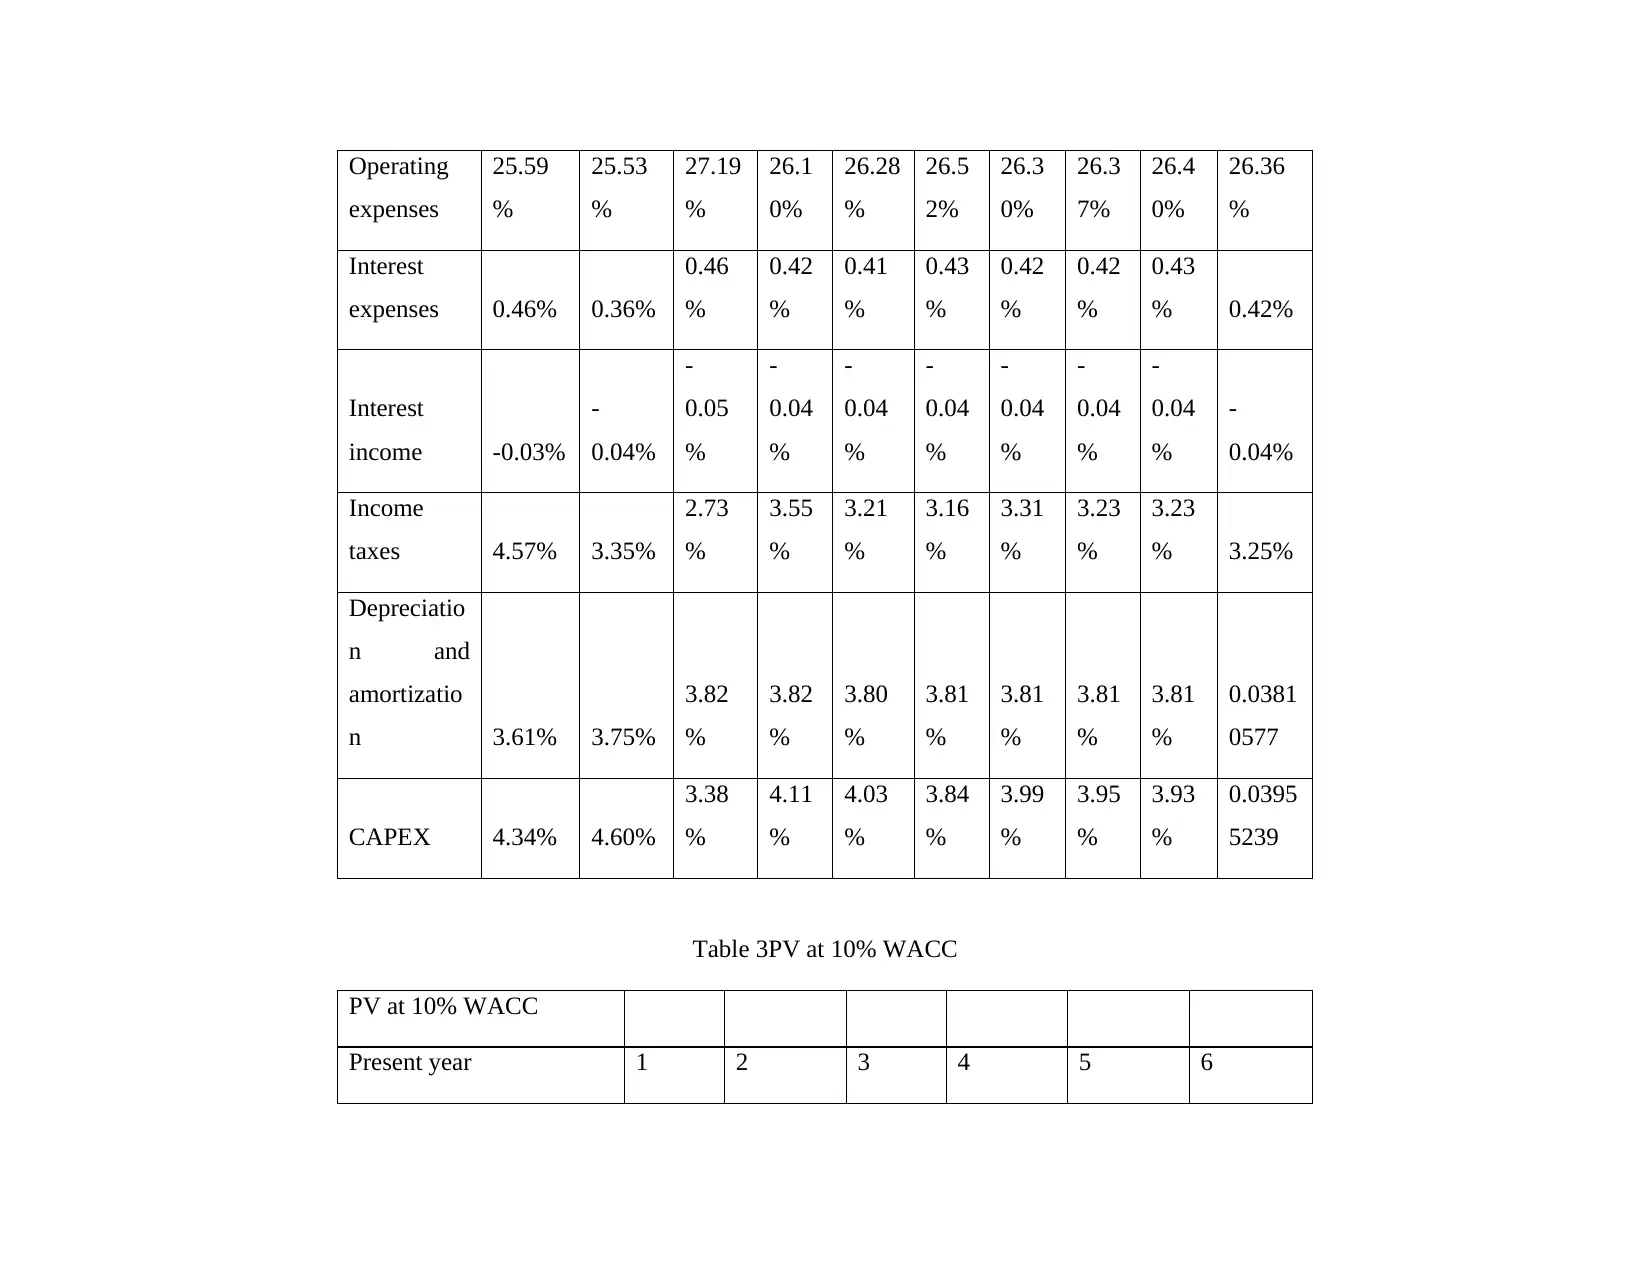
Operating
expenses
25.59
%
25.53
%
27.19
%
26.1
0%
26.28
%
26.5
2%
26.3
0%
26.3
7%
26.4
0%
26.36
%
Interest
expenses 0.46% 0.36%
0.46
%
0.42
%
0.41
%
0.43
%
0.42
%
0.42
%
0.43
% 0.42%
Interest
income -0.03%
-
0.04%
-
0.05
%
-
0.04
%
-
0.04
%
-
0.04
%
-
0.04
%
-
0.04
%
-
0.04
%
-
0.04%
Income
taxes 4.57% 3.35%
2.73
%
3.55
%
3.21
%
3.16
%
3.31
%
3.23
%
3.23
% 3.25%
Depreciatio
n and
amortizatio
n 3.61% 3.75%
3.82
%
3.82
%
3.80
%
3.81
%
3.81
%
3.81
%
3.81
%
0.0381
0577
CAPEX 4.34% 4.60%
3.38
%
4.11
%
4.03
%
3.84
%
3.99
%
3.95
%
3.93
%
0.0395
5239
Table 3PV at 10% WACC
PV at 10% WACC
Present year 1 2 3 4 5 6
⊘ This is a preview!⊘
Do you want full access?
Subscribe today to unlock all pages.
Trusted by 1+ million students worldwide
Discounting factor
0.9090
91
0.826446
28
0.7513
15
0.683013
46
0.620921
32
0.564473
93
PV of cash flows
614.43
01
714.4952
11
777.02
07
831.8882
37
919.9474
7
892.3737
65
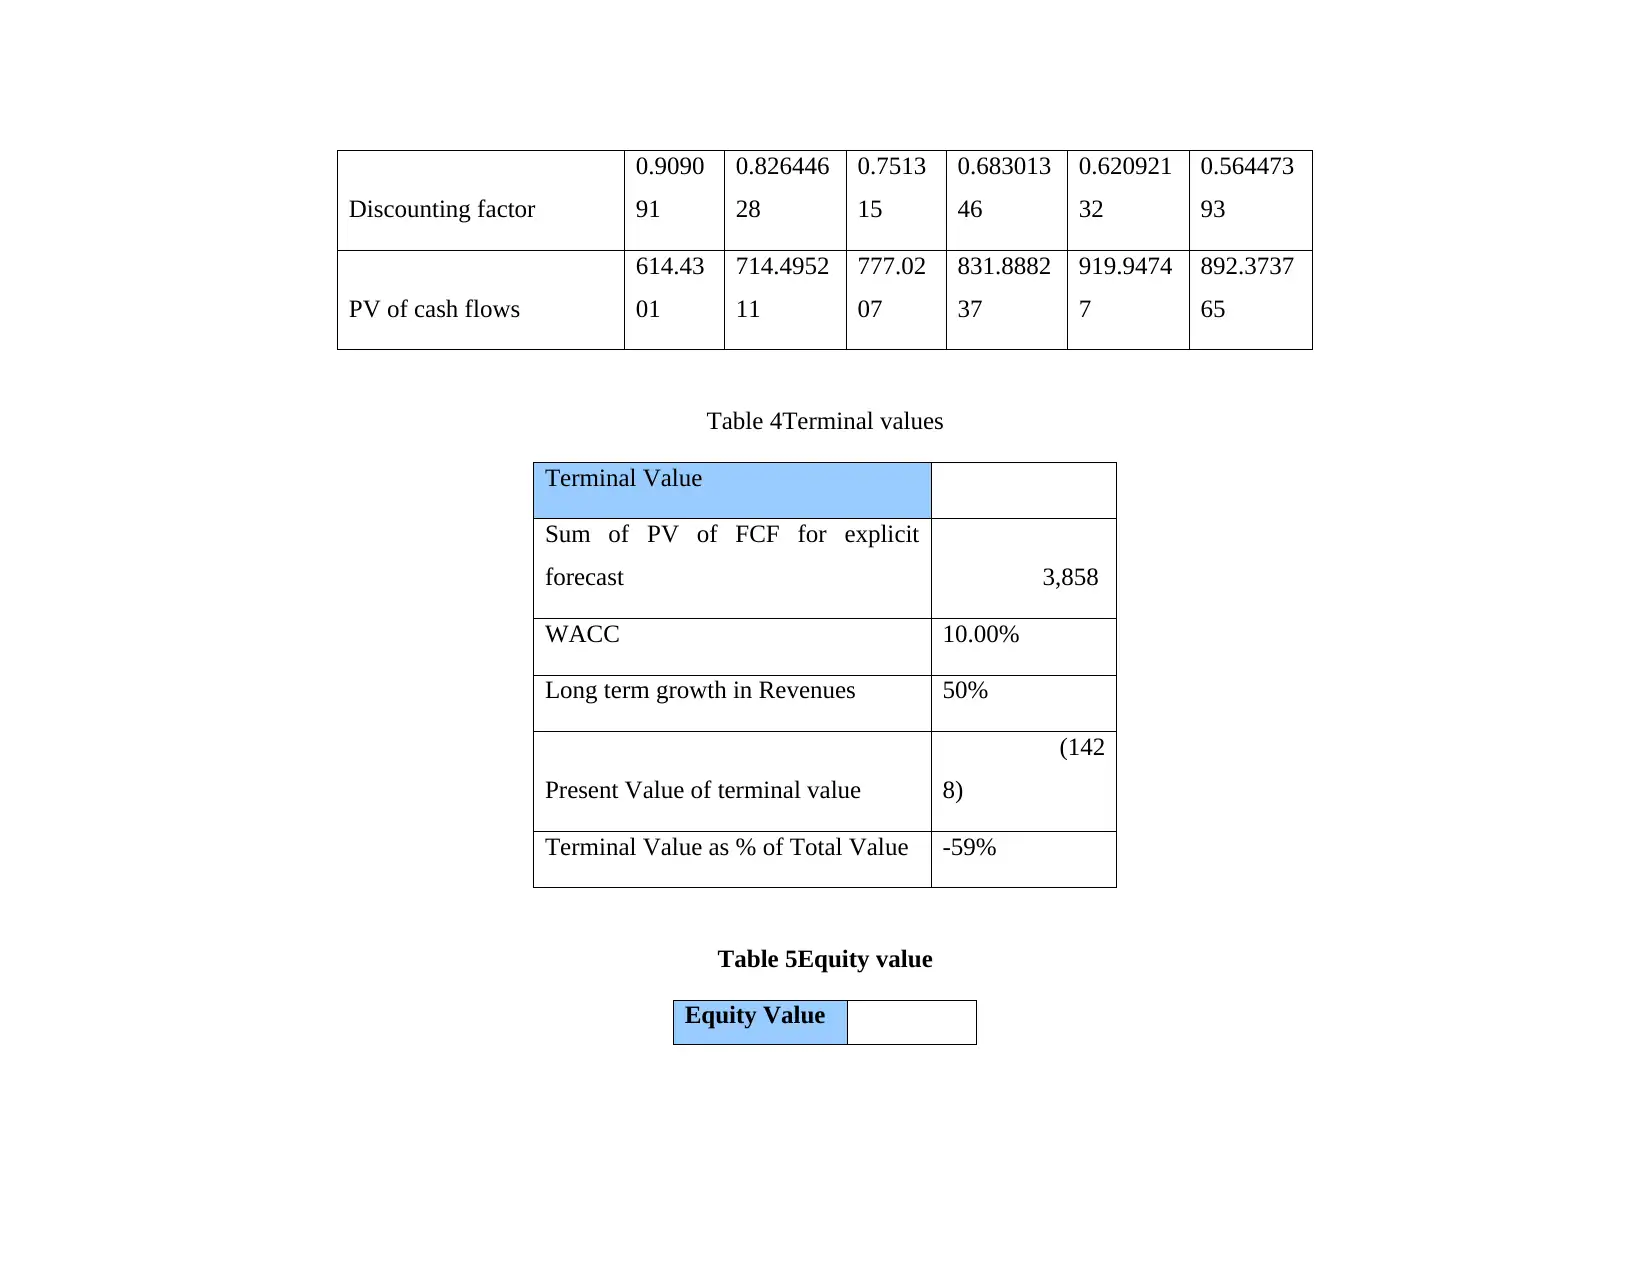
Table 4Terminal values
Terminal Value
Sum of PV of FCF for explicit
forecast 3,858
WACC 10.00%
Long term growth in Revenues 50%
Present Value of terminal value
(142
8)
Terminal Value as % of Total Value -59%
Table 5Equity value
Equity Value
0.9090
91
0.826446
28
0.7513
15
0.683013
46
0.620921
32
0.564473
93
PV of cash flows
614.43
01
714.4952
11
777.02
07
831.8882
37
919.9474
7
892.3737
65
Table 4Terminal values
Terminal Value
Sum of PV of FCF for explicit
forecast 3,858
WACC 10.00%
Long term growth in Revenues 50%
Present Value of terminal value
(142
8)
Terminal Value as % of Total Value -59%
Table 5Equity value
Equity Value
Paraphrase This Document
Need a fresh take? Get an instant paraphrase of this document with our AI Paraphraser
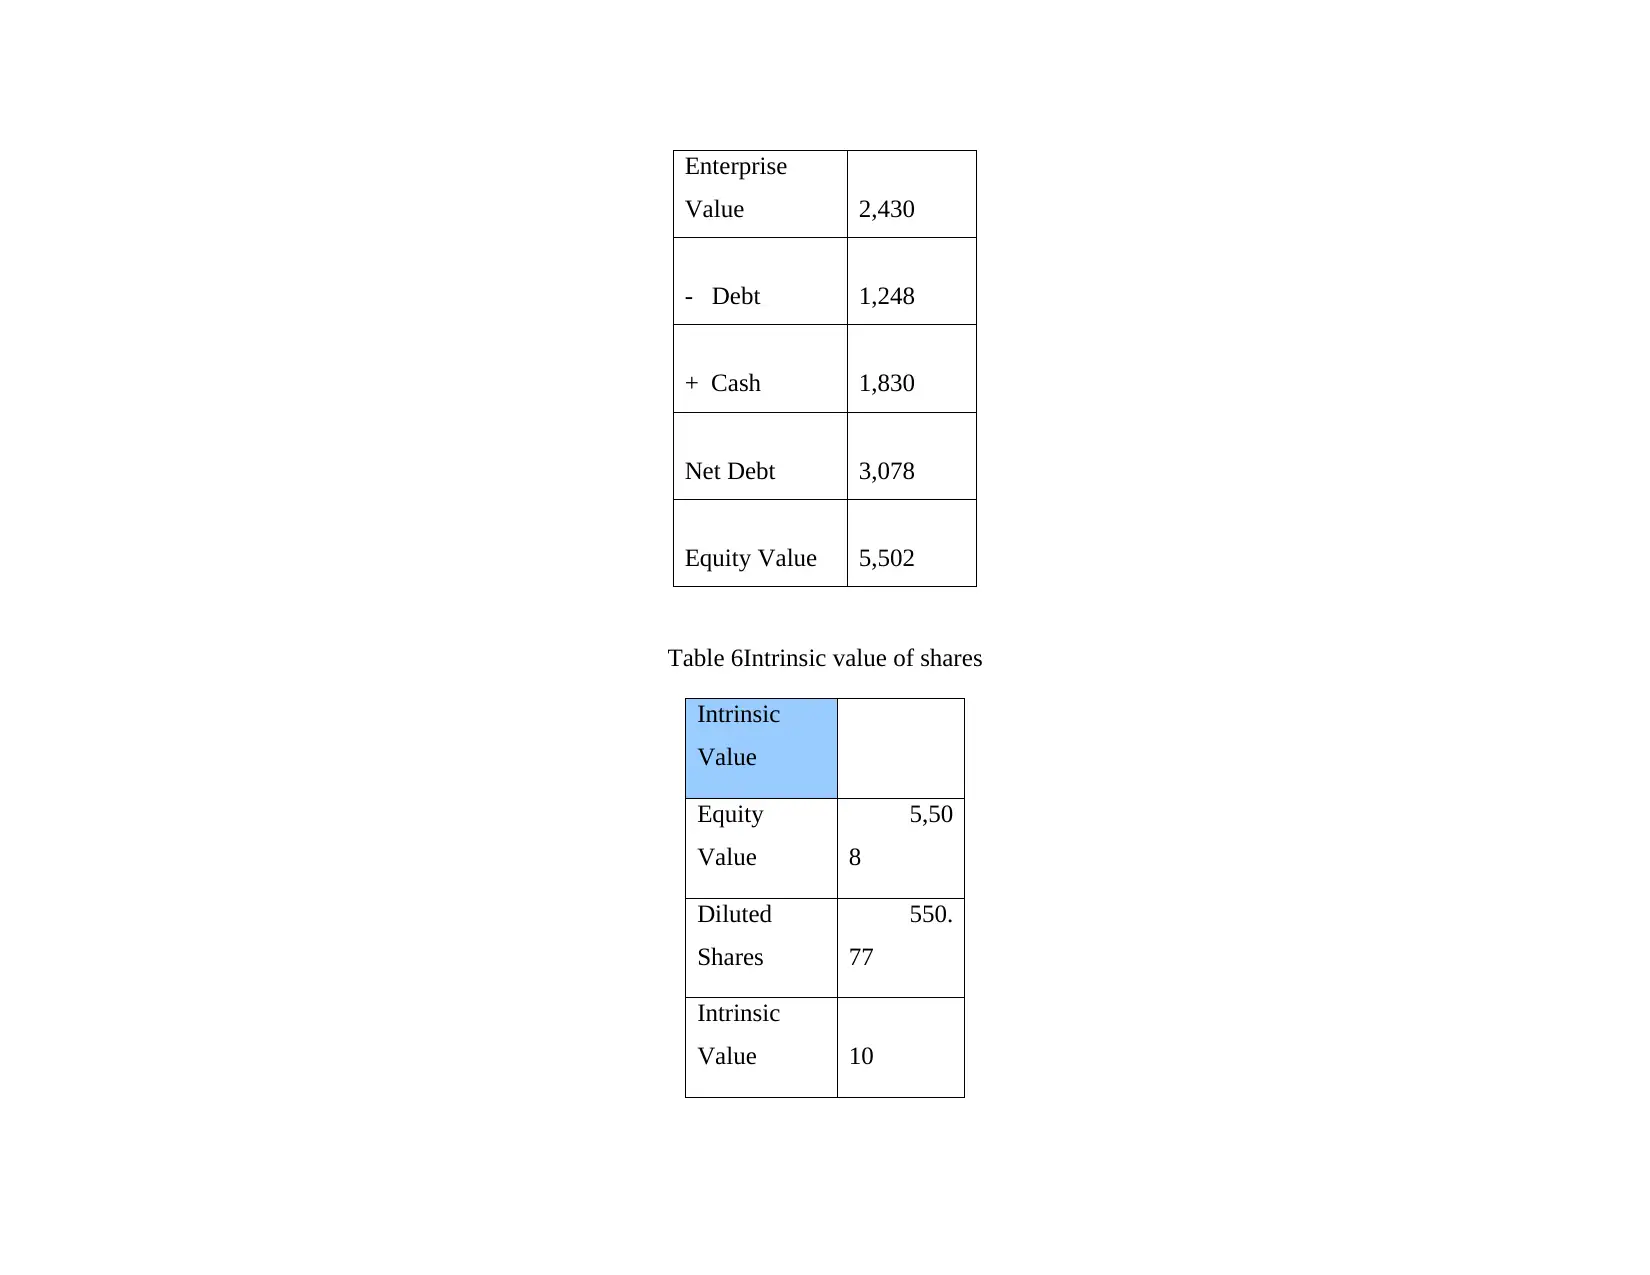
Enterprise
Value 2,430
- Debt 1,248
+ Cash 1,830
Net Debt 3,078
Equity Value 5,502
Table 6Intrinsic value of shares
Intrinsic
Value
Equity
Value
5,50
8
Diluted
Shares
550.
77
Intrinsic
Value 10
Value 2,430
- Debt 1,248
+ Cash 1,830
Net Debt 3,078
Equity Value 5,502
Table 6Intrinsic value of shares
Intrinsic
Value
Equity
Value
5,50
8
Diluted
Shares
550.
77
Intrinsic
Value 10
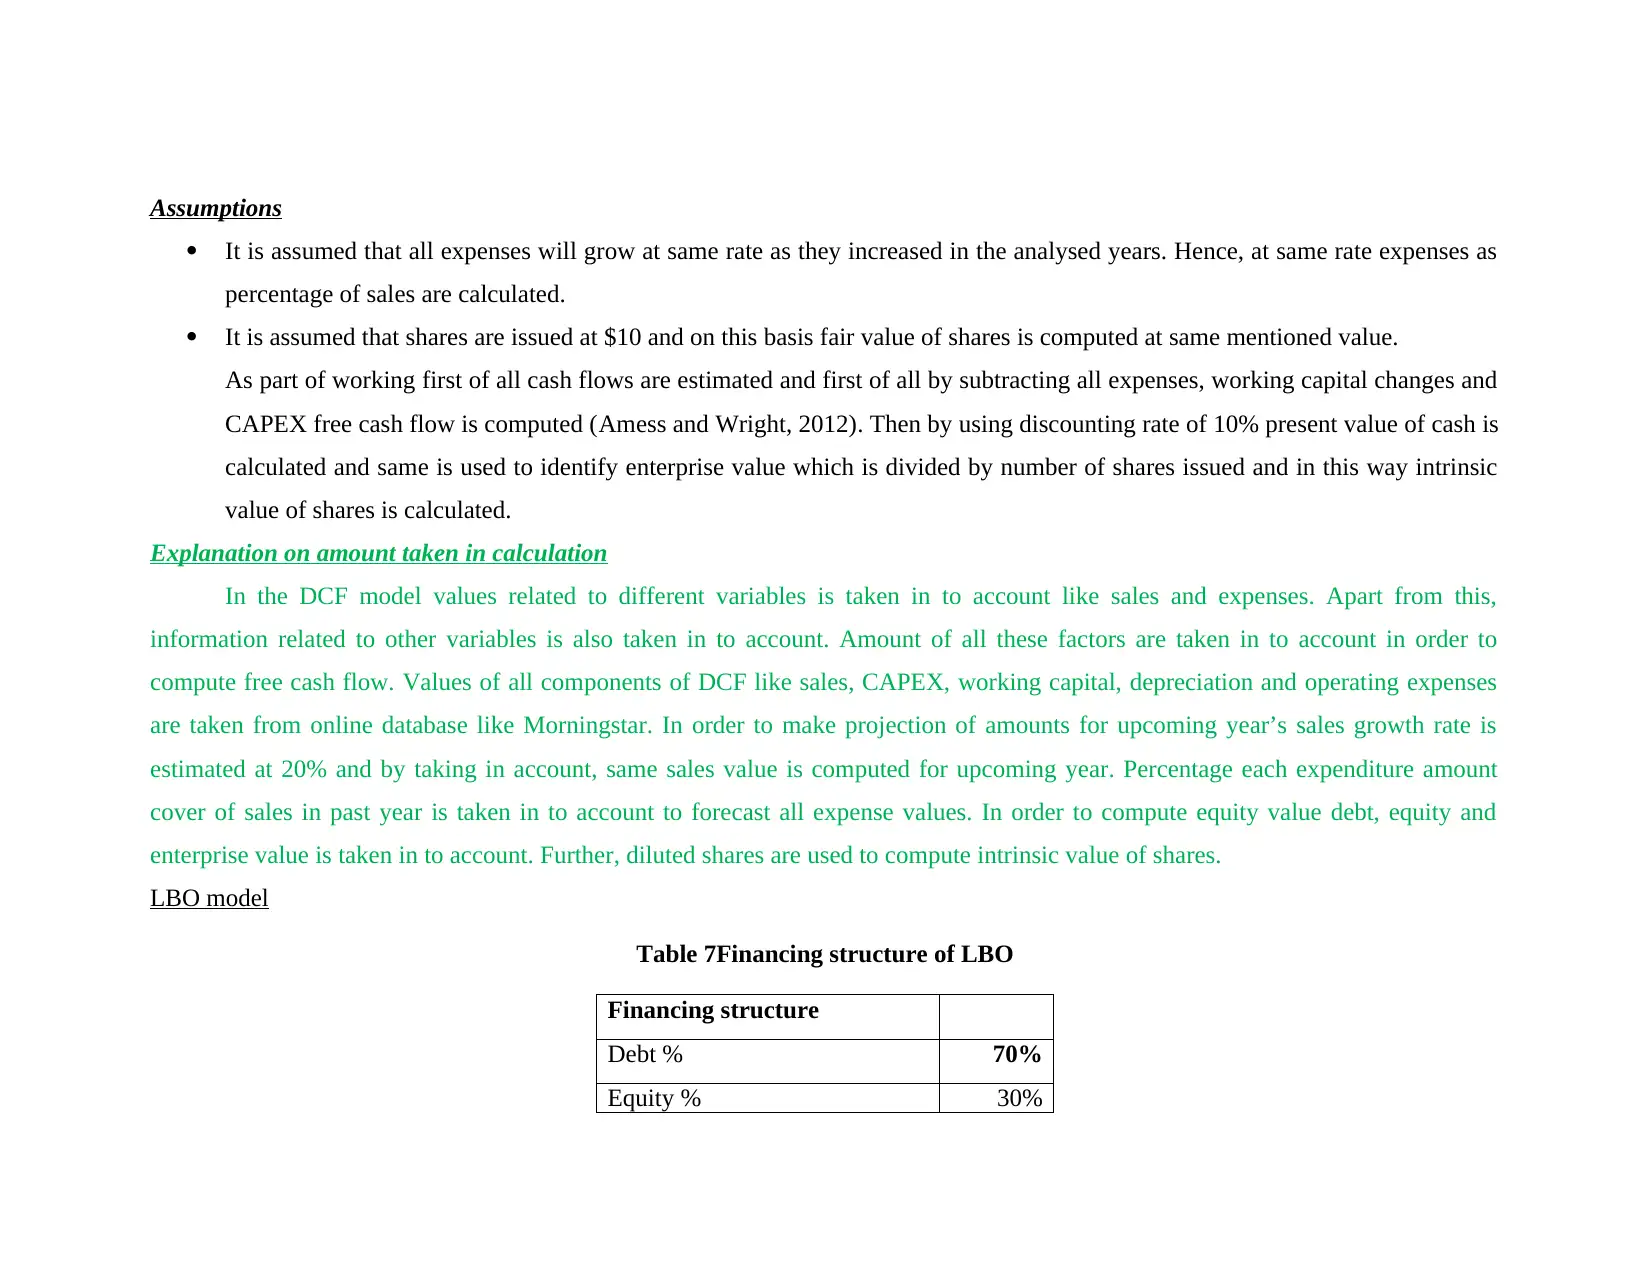
Assumptions
It is assumed that all expenses will grow at same rate as they increased in the analysed years. Hence, at same rate expenses as
percentage of sales are calculated.
It is assumed that shares are issued at $10 and on this basis fair value of shares is computed at same mentioned value.
As part of working first of all cash flows are estimated and first of all by subtracting all expenses, working capital changes and
CAPEX free cash flow is computed (Amess and Wright, 2012). Then by using discounting rate of 10% present value of cash is
calculated and same is used to identify enterprise value which is divided by number of shares issued and in this way intrinsic
value of shares is calculated.
Explanation on amount taken in calculation
In the DCF model values related to different variables is taken in to account like sales and expenses. Apart from this,
information related to other variables is also taken in to account. Amount of all these factors are taken in to account in order to
compute free cash flow. Values of all components of DCF like sales, CAPEX, working capital, depreciation and operating expenses
are taken from online database like Morningstar. In order to make projection of amounts for upcoming year’s sales growth rate is
estimated at 20% and by taking in account, same sales value is computed for upcoming year. Percentage each expenditure amount
cover of sales in past year is taken in to account to forecast all expense values. In order to compute equity value debt, equity and
enterprise value is taken in to account. Further, diluted shares are used to compute intrinsic value of shares.
LBO model
Table 7Financing structure of LBO
Financing structure
Debt % 70%
Equity % 30%
⊘ This is a preview!⊘
Do you want full access?
Subscribe today to unlock all pages.
Trusted by 1+ million students worldwide
1 out of 23
Related Documents


Your All-in-One AI-Powered Toolkit for Academic Success.
+13062052269
info@desklib.com
Available 24*7 on WhatsApp / Email
![[object Object]](/_next/static/media/star-bottom.7253800d.svg)
Unlock your academic potential
Copyright © 2020–2026 A2Z Services. All Rights Reserved. Developed and managed by ZUCOL.