Business Finance: Performance Analysis and Financial Statements Review
VerifiedAdded on 2022/12/30
|12
|3339
|66
Report
AI Summary
This report provides a comprehensive analysis of T-Shirt Ltd's financial performance for the years 2018 and 2019. It begins with an examination of the statement of profit or loss, utilizing ratio analysis to assess the company's liquidity, profitability, and efficiency. Key ratios such as current ratio, quick ratio, gross profit margin, net profit margin, and return on assets are calculated and interpreted, highlighting significant declines in several areas. The report then proceeds to analyze the statement of financial position, evaluating ratios like debt-to-equity, proprietary ratio, asset turnover, and inventory turnover, revealing further challenges in the company's financial health. Part 2 delves into the concepts of accrual accounting versus cash accounting, outlining their benefits and limitations, followed by a discussion on the differences between profit and cash flow. Finally, Part 3 defines the purpose of budgeting and the benefits of forming a limited company and listing it on the stock exchange. The report emphasizes the need for T-Shirt Ltd to implement strategies to improve its financial performance and sustain its brand image.

Business Finance
Paraphrase This Document
Need a fresh take? Get an instant paraphrase of this document with our AI Paraphraser
Table of Contents
Part 1: Business Performance Analysis......................................................................................2
1.1 Statement of Profit or Loss..............................................................................................2
1.2 Statement of Financial Position.......................................................................................3
PART- 2.....................................................................................................................................5
2.1 Concept of accrual accounting versus cash accounting with benefits as well as
limitation................................................................................................................................5
2.2 Profit and cash Flow and the way they are different........................................................6
PART-3......................................................................................................................................7
3.1 Define budget and purpose of preparing a budget...........................................................7
3.2 Main benefits of forming a limited company and listing it on stock exchange...............7
REFERENCES...........................................................................................................................9
Appendix..............................................................................................................................10
Part 1: Business Performance Analysis
1.1 Statement of Profit or Loss
In order to determine the financial performance of a company it is necessary for the
business to use ratio analysis by using different ratios. Through this, T- Shirt Ltd will
examine the performance of a firm by comparing the ratios to previous year. Hence, different
ratios are as mention below:
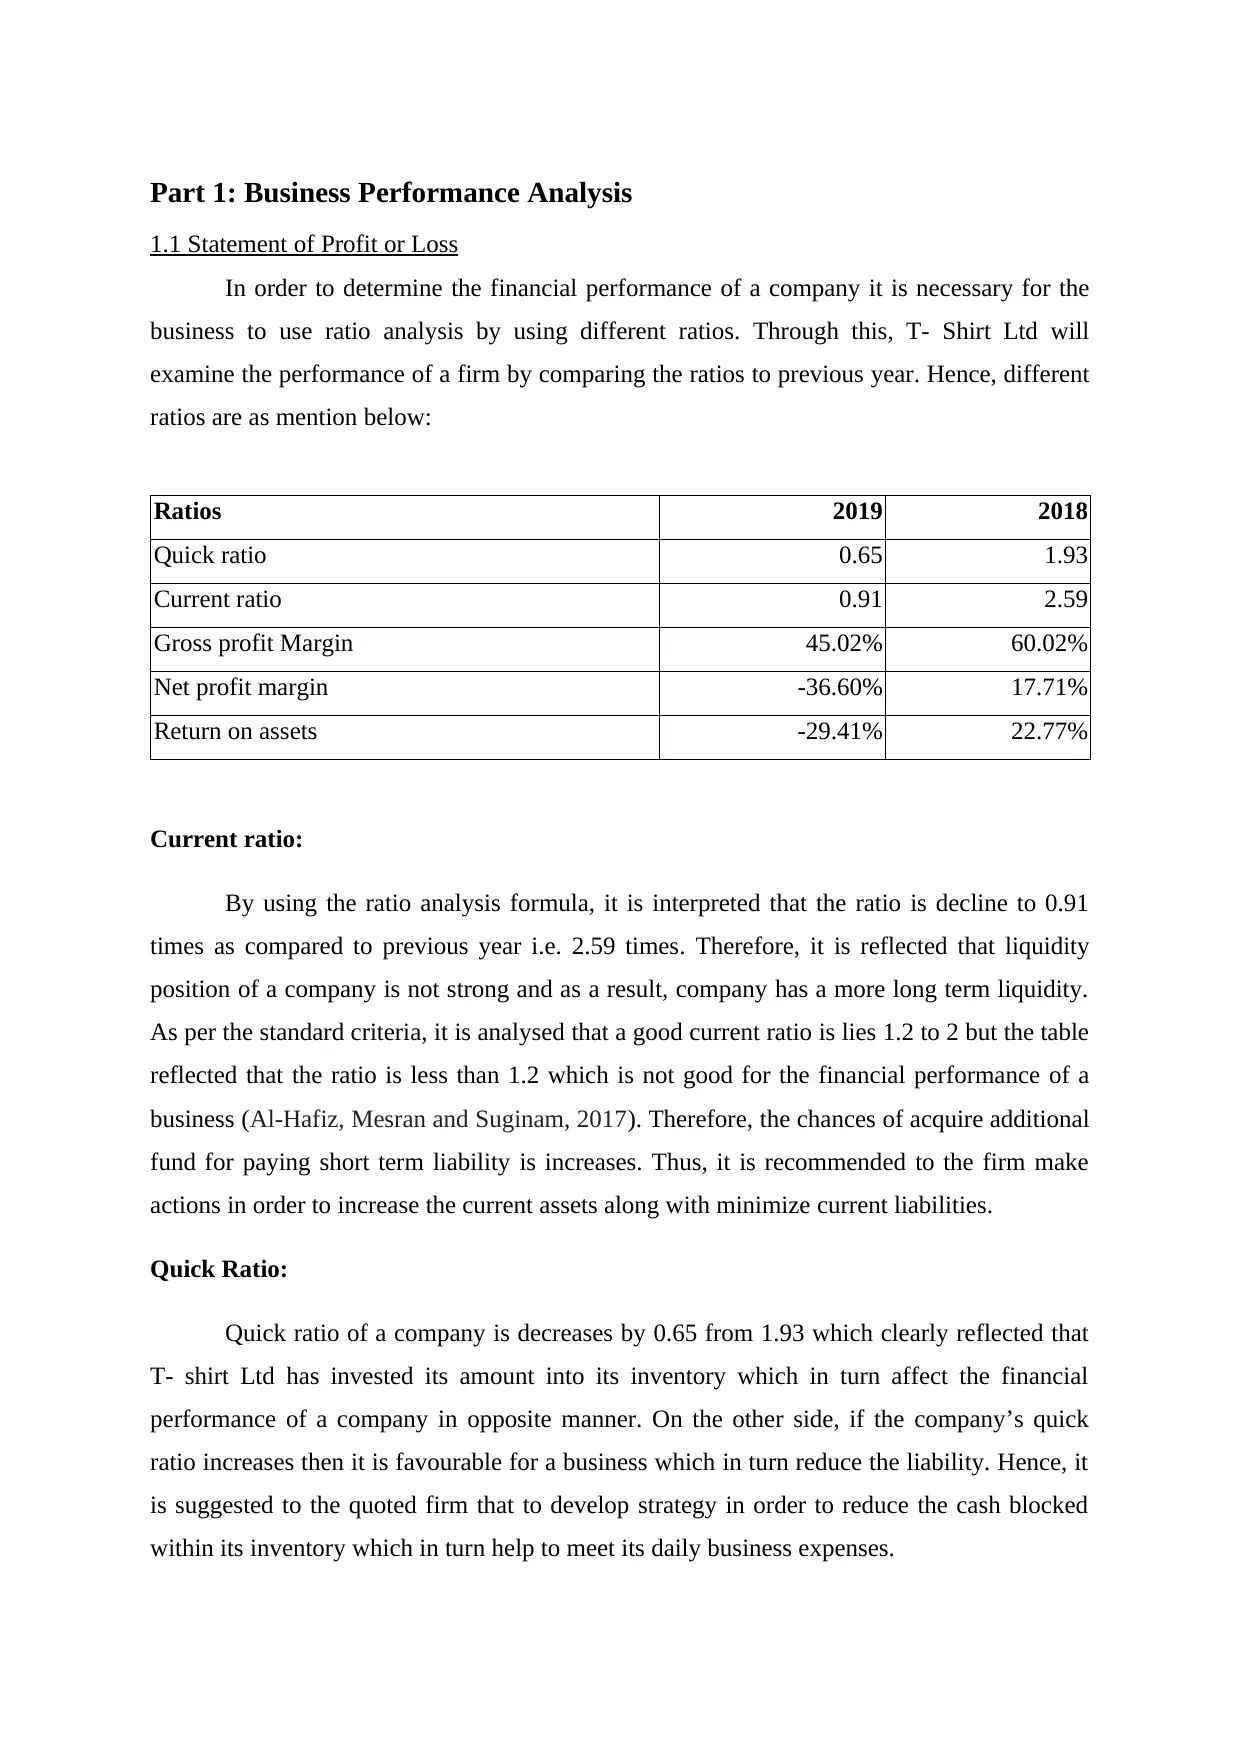
Ratios 2019 2018
Quick ratio 0.65 1.93
Current ratio 0.91 2.59
Gross profit Margin 45.02% 60.02%
Net profit margin -36.60% 17.71%
Return on assets -29.41% 22.77%
Current ratio:
By using the ratio analysis formula, it is interpreted that the ratio is decline to 0.91
times as compared to previous year i.e. 2.59 times. Therefore, it is reflected that liquidity
position of a company is not strong and as a result, company has a more long term liquidity.
As per the standard criteria, it is analysed that a good current ratio is lies 1.2 to 2 but the table
reflected that the ratio is less than 1.2 which is not good for the financial performance of a
business (Al-Hafiz, Mesran and Suginam, 2017). Therefore, the chances of acquire additional
fund for paying short term liability is increases. Thus, it is recommended to the firm make
actions in order to increase the current assets along with minimize current liabilities.
Quick Ratio:
Quick ratio of a company is decreases by 0.65 from 1.93 which clearly reflected that
T- shirt Ltd has invested its amount into its inventory which in turn affect the financial
performance of a company in opposite manner. On the other side, if the company’s quick
ratio increases then it is favourable for a business which in turn reduce the liability. Hence, it
is suggested to the quoted firm that to develop strategy in order to reduce the cash blocked
within its inventory which in turn help to meet its daily business expenses.
1.1 Statement of Profit or Loss
In order to determine the financial performance of a company it is necessary for the
business to use ratio analysis by using different ratios. Through this, T- Shirt Ltd will
examine the performance of a firm by comparing the ratios to previous year. Hence, different
ratios are as mention below:
Ratios 2019 2018
Quick ratio 0.65 1.93
Current ratio 0.91 2.59
Gross profit Margin 45.02% 60.02%
Net profit margin -36.60% 17.71%
Return on assets -29.41% 22.77%
Current ratio:
By using the ratio analysis formula, it is interpreted that the ratio is decline to 0.91
times as compared to previous year i.e. 2.59 times. Therefore, it is reflected that liquidity
position of a company is not strong and as a result, company has a more long term liquidity.
As per the standard criteria, it is analysed that a good current ratio is lies 1.2 to 2 but the table
reflected that the ratio is less than 1.2 which is not good for the financial performance of a
business (Al-Hafiz, Mesran and Suginam, 2017). Therefore, the chances of acquire additional
fund for paying short term liability is increases. Thus, it is recommended to the firm make
actions in order to increase the current assets along with minimize current liabilities.
Quick Ratio:
Quick ratio of a company is decreases by 0.65 from 1.93 which clearly reflected that
T- shirt Ltd has invested its amount into its inventory which in turn affect the financial
performance of a company in opposite manner. On the other side, if the company’s quick
ratio increases then it is favourable for a business which in turn reduce the liability. Hence, it
is suggested to the quoted firm that to develop strategy in order to reduce the cash blocked
within its inventory which in turn help to meet its daily business expenses.
⊘ This is a preview!⊘
Do you want full access?
Subscribe today to unlock all pages.
Trusted by 1+ million students worldwide

Gross Profit Margin:
Through the table it is reflected that the GP ratio of a firm is also decline such that in
2018, it is 60.02% while in 2019 it is 45.02% and the reason behind the same is to decrease in
its sales revenue. Hence, T-shirt Ltd has to develop strategy in order to increases its sales by
focusing upon the credit policy. Such that company may review its pricing strategy which
help to improve the overall financial performance of a company which in turn increase the
sales that further increases the GP ratio as well (Camin and et.al., 2016). For example,
company is deal with credit policy then it change its policy tenure by 30 days instead of 60.
Net Profit Margin:
Calculation in appendix shows that the net profit ratio is changes to negative from
positive i.e 17.71% to -36.60%. The reason behind the same is to decrease in GP and sales
along with enhancing company’s operating and non-operating expenses. Further, there is a
need to manage the business and that is why, it must focused upon the costs as well as other
financial obligations too.
Return on asset ratio:
There is a greater reduction in the Return on Asset ratio i.e. from 22.77% to -29.41%.
This is a clear indication that business has a financial loss and there is no specific period of
time of any investment. Hence, company did not uses its assets effectively in order to
generate income and that is why, it is suggested to the company to develop right strategy in
order to make the situation favourable and increase its financial performance as well.
1.2 Statement of Financial Position
Ratios 2019 2018
Debt to equity ratio 4.48 1.02
Proprietary ratio 18.24% 49.57%
Asset Turnover ratio 0.82 1.29
Inventory Turnover ratio 1.93 9.44
Debt to equity ratio:
There is an increase of debt to equity ratio from 2018 to 2019 i.e. 1.02 to 4.48 which
is clearly reflected that company has more debt. This is further resulted into increase in risk
Paraphrase This Document
Need a fresh take? Get an instant paraphrase of this document with our AI Paraphraser
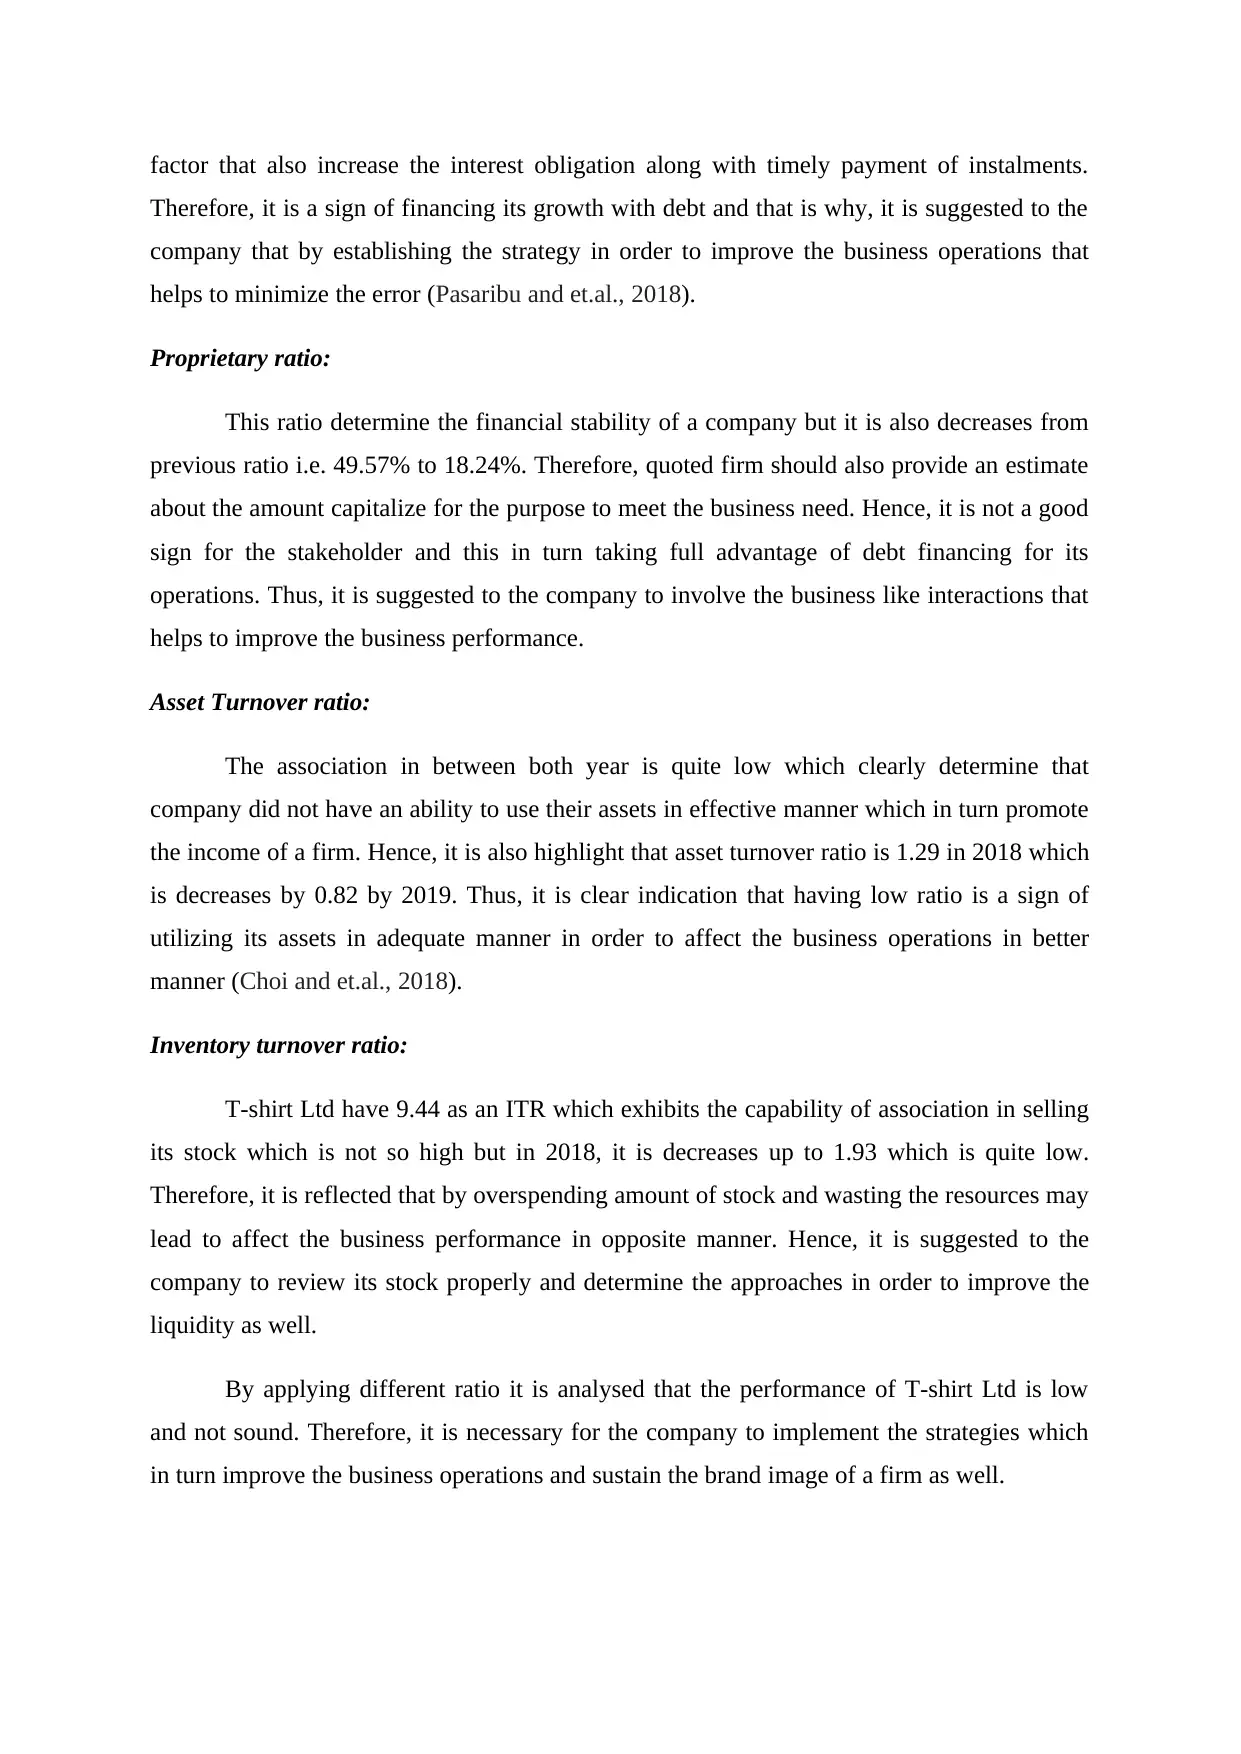
factor that also increase the interest obligation along with timely payment of instalments.
Therefore, it is a sign of financing its growth with debt and that is why, it is suggested to the
company that by establishing the strategy in order to improve the business operations that
helps to minimize the error (Pasaribu and et.al., 2018).
Proprietary ratio:
This ratio determine the financial stability of a company but it is also decreases from
previous ratio i.e. 49.57% to 18.24%. Therefore, quoted firm should also provide an estimate
about the amount capitalize for the purpose to meet the business need. Hence, it is not a good
sign for the stakeholder and this in turn taking full advantage of debt financing for its
operations. Thus, it is suggested to the company to involve the business like interactions that
helps to improve the business performance.
Asset Turnover ratio:
The association in between both year is quite low which clearly determine that
company did not have an ability to use their assets in effective manner which in turn promote
the income of a firm. Hence, it is also highlight that asset turnover ratio is 1.29 in 2018 which
is decreases by 0.82 by 2019. Thus, it is clear indication that having low ratio is a sign of
utilizing its assets in adequate manner in order to affect the business operations in better
manner (Choi and et.al., 2018).
Inventory turnover ratio:
T-shirt Ltd have 9.44 as an ITR which exhibits the capability of association in selling
its stock which is not so high but in 2018, it is decreases up to 1.93 which is quite low.
Therefore, it is reflected that by overspending amount of stock and wasting the resources may
lead to affect the business performance in opposite manner. Hence, it is suggested to the
company to review its stock properly and determine the approaches in order to improve the
liquidity as well.
By applying different ratio it is analysed that the performance of T-shirt Ltd is low
and not sound. Therefore, it is necessary for the company to implement the strategies which
in turn improve the business operations and sustain the brand image of a firm as well.
PART- 2
2.1 Concept of accrual accounting versus cash accounting with benefits as well as limitation
Accrual accounting is an fundamental principle of accounting that illustrated that company
needs to records all possible and existing loss while record revenue that are only earned
during the years. In another words it can be stated that entries or record are maintained in
books of accounts on the basis of transaction made rather than actual payment made or
received during particular year. Therefore, in order to understand the concept of accrual
accounting, first the meaning of word need to be understands “accrual” that means particular
transaction has occurred or accrual without any exchanged of payment or cash (Showalter,
2018). So, accrual concept of accounting is most suitable and fruitful for businesses that
have most of the transaction or sales on credit basis rather than on cash. In this concept it is
expected that money will be paid in future by customers so goods and services are delivered
to client on credit basis. On the other hand, in cash accounting concept, transaction are only
recorded when actual purchase of products and services has been made or expense are bear
by company. So, it include all relevant information related to the cash transaction rather than
credit as entry is only made when cash is received by the organisation (Semenova, 2018).
Therefore key difference between the both the term is that in accrual accounting entries are
made as products are sold or expense are made irrespective of cash received or paid while in
context of cash accounting, entries are specially made when actual cash in gained or paid by
company. For example: In the above case study, T-shirt Plc in order to attract more customers
range have extend its credit validity from 30 to 60 days. So, in this transaction has been made
30 or 60 days before but cash is paid to company afterwards so it is accrual transaction
concept. While if the company make entries at time customers make payment that is between
30 to 60 days that is known as cash accounting concept. Thus, Benefits and limitations of
both concept such as accrual accounting and cash accounting are discussed as follows:
Accrual accounting
Advantages
Shows accurate cash flow of business: There are huge numbers of business transaction in
particular month so it contributes in recording each transaction and transferring it to next
month or even longer.
⊘ This is a preview!⊘
Do you want full access?
Subscribe today to unlock all pages.
Trusted by 1+ million students worldwide
Most of the investors prefer accrual accounting: Another advantage is that it is more
permanent and better method so investors prefer it most.
Limitation
Tax: Company needs to pay tax as it is record that income is earned but in reality no cash has
been received.
Cash accounting
Advantages
Single entry system: It is an easy process as involve single entry thus chance of errors and
mistake are minimised to large extend (Taskforce, 2018).
Limitation
Does not show the true picture: The biggest limitation of cash accounting system is that it
show limited looks at both expense and income of enterprise.
2.2 Profit and cash Flow and the way they are different
Profit and cash flow are two important financial metrics that have wide difference
between each others that need to be understood for effective decision making for good
financial health and business performance. Profit represents overall revenue earned by
company during particular year by selling products and services to end customers in best
possible manner. Or it state net income that company earned by subtracting total cost
incurred to manufacture products with that are sold to specific customers. While cash flow
represent in and out flow of money from different activities such as finance, operation and
investing (Heil, 2017). So, it is money or cash through which company is able to meet its
existing or future obligation by making their payments. Therefore, key difference between
cash flow and profit is that one indicates about the money which is left after meeting all
expenses related to sales of products and services. While the cash flow specific net cash flow
during particular years so that investors or other key stakeholders can take accurate and
correct decision to be part of firm or not in longer term.
Paraphrase This Document
Need a fresh take? Get an instant paraphrase of this document with our AI Paraphraser
PART-3
3.1 Define budget and purpose of preparing a budget
Budget refers to a specific amount decided to have revenue and expenses in a period of time.
This is the plan which can be estimated or framed for a person, groups, businesses,
institutions etc. which helps in spending the money. As planning is the first step which
everyone needs to perform and execute in appropriate manner to come over the positive
results in the work process. Purposes of preparing budget are as follows:
Increase savings: Budget plays a major role in savings of human life. As it is spend in a
planned manner in a particular period of time. Every budget set some saving as expenses and
revenues are being calculated and evaluated through experiences. This is done to increase the
saving and occur expenses in a desired manner.
Control over finance: It helps in controlling the feeling of spending Money on useless things
in the market. Budget has a control over the expenses which aren't necessary in the current
situations. As control over finance refers to check over the actual plan end planned plan. If
any diversion occurs then it needs to be rectified and work over the planned plan.
Achieving financial goals: Everyone starts budget with some financial goals keeping in mind
in order to achieve positive results in the work process (He, Jansen and Zarges, 2019).
Budget helps in achieving financial goals as it’s helped in controlling and monitoring over the
expenses and revenues occurred in day today time of life.
Debt free: Budget also helps in coming out from heavy debt which has been occurred during
a period of time. It helps in repayment of debt, rent, interests etc. through a specific financial
plan thus helped in attainment of end goals in limited time frame.
Reduce financial stress: It can be stated that preparation of budget in advance contributed in
reducing large amount of stress of business. It helps in resolving about issue related to
monthly expenses such as rent, wages to employees and fixed cost incurred in order to
delivered products and services to end customers. Therefore, budget in advance helps in
reducing all such financial stress and contributes in smooth achievements of company goals.
3.2 Main benefits of forming a limited company and listing it on stock exchange
Limited company is an type of organisation that has limited the amount of liability or its
shareholders, investors are limited liable to invested money so they cannot be forced to pay
extra in case of more loss. Thus, their liability is limited to their stake in the organisation in
terms of total investment made thereby there are several benefits or advantages of forming
limited company which can be illustrated as follows:
Minimising personal liability: The greatest advantage of limited company is that personal is
not entitled to sells is personal asset or give money in order to pay liabilities or remaining
debt of organisation. It also stated that company is separate legal entity from individuals so it
has its personal rights on its assets thereby any type of losses is solely responsibility of
company rather than owner or stakeholders.
Professional status: Another benefit of limited company is that professional image and status
improved or enhanced as all function are effectively organised or well structured. All
operation are rigorously monitored and controlled so that no major loss can be caused in any
circumstances (Mancuso, 2019). At the same time there are more complex accounting
procedure, statutory compliance obligation and reporting requirements that need to be
fulfilled by company so that chance of loss can be minimised thus helps in attracting
investors.
Tax efficiency and planning: It can be stated that currently, company operating as Limited
liability in UK needs to pay 19% corporate tax on total profit earned as compared to other
sole trader that have to pay around 20-45%. Thus, Limited Liability Company also enjoys
flexibility of tax planning or saving as compared to other organisation.
There are numerous benefits of listing company in stock exchange
Access to capital for growth: Limited Company through listing on stock exchange can
easily increase number of shareholders base and its credibility in the external market.
Organisation always required capital or fund in order to further grow or diversify business
operation so listing contribute in effecting raising of funds.
Liquidity: Another benefits is that it give chance to shareholder to realise their value of
investment made and take active part in risk sharing or enjoying benefits of organisation.
Enhance visibility: It is also one of the major benefits of listing limited company on stock
exchanged as it helps in increasing visibility or awareness among maximum individuals.
Moreover it clearly show that company has complied to all legal regulators and norms thus it
is more transparent while performing its different function in order to attain end objectives.
⊘ This is a preview!⊘
Do you want full access?
Subscribe today to unlock all pages.
Trusted by 1+ million students worldwide

Paraphrase This Document
Need a fresh take? Get an instant paraphrase of this document with our AI Paraphraser
REFERENCES
Books and Journals
Chambost, I., Lenglet, M. and Tadjeddine, Y. eds., 2018. The Making of Finance:
Perspectives from the social sciences. Routledge.
Heil, M., 2017. Finance and productivity.
Mancuso, A., 2019. Your limited liability company: an operating manual. Nolo.
Semenova, S., 2018. Cash flow optimization and accounting in the enterprise. Social and
Legal Sciences, 1(2). pp.57-69.
Showalter, D. S., 2018. Increasing the Value of Accrual Accounting: Lessons from around
the World. The Journal of Government Financial Management, 67(3). p.56.
Taskforce, B. F., 2018. Better finance, better world. Consultation Paper.
Al-Hafiz, N.W., Mesran, M. and Suginam, S., 2017. Sistem Pendukung Keputusan
Penentukan Kredit Pemilikan Rumah Menerapkan Multi-Objective Optimization On
The Basis Of Ratio Analysis (Moora). KOMIK (Konferensi Nasional Teknologi
Informasi dan Komputer). 1(1).
Camin, F. and et.al., 2016. Stable isotope ratio analysis for assessing the authenticity of food
of animal origin. Comprehensive Reviews in Food Science and Food Safety. 15(5).
pp.868-877.
Pasaribu, S.W. and et.al., 2018. Implementasi Multi-Objective Optimization On The Basis Of
Ratio Analysis (MOORA) Untuk Menentukan Kualitas Buah Mangga
Terbaik. JURIKOM (Jurnal Riset Komputer). 5(1). pp.50-55.
Choi, K.B. and et.al., 2018. Amplification ratio analysis of a bridge-type mechanical
amplification mechanism based on a fully compliant model. Mechanism and Machine
Theory. 121. pp.355-372.
He, J., Jansen, T. and Zarges, C., 2019, July. Unlimited budget analysis. In Proceedings of the
Genetic and Evolutionary Computation Conference Companion (pp. 427-428).
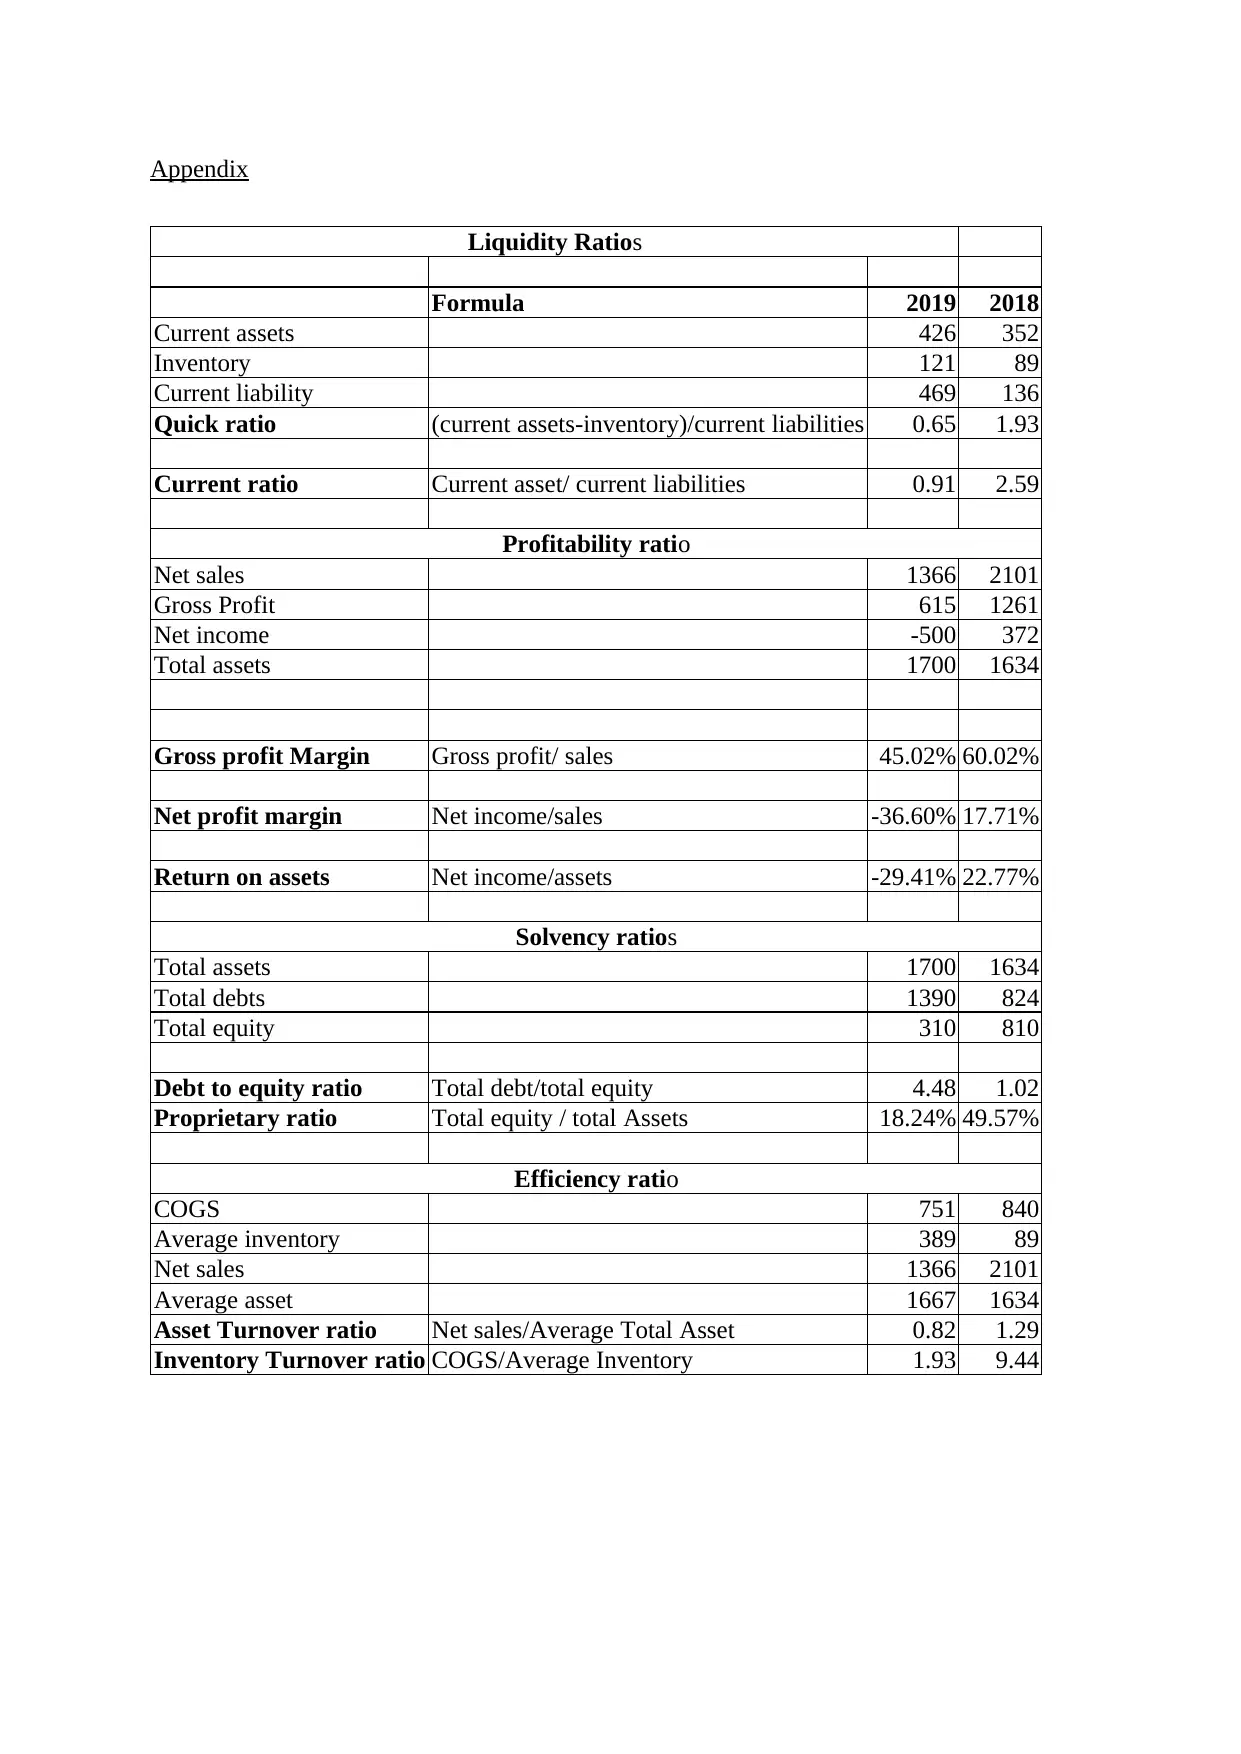
Appendix
Liquidity Ratios
Formula 2019 2018
Current assets 426 352
Inventory 121 89
Current liability 469 136
Quick ratio (current assets-inventory)/current liabilities 0.65 1.93
Current ratio Current asset/ current liabilities 0.91 2.59
Profitability ratio
Net sales 1366 2101
Gross Profit 615 1261
Net income -500 372
Total assets 1700 1634
Gross profit Margin Gross profit/ sales 45.02% 60.02%
Net profit margin Net income/sales -36.60% 17.71%
Return on assets Net income/assets -29.41% 22.77%
Solvency ratios
Total assets 1700 1634
Total debts 1390 824
Total equity 310 810
Debt to equity ratio Total debt/total equity 4.48 1.02
Proprietary ratio Total equity / total Assets 18.24% 49.57%
Efficiency ratio
COGS 751 840
Average inventory 389 89
Net sales 1366 2101
Average asset 1667 1634
Asset Turnover ratio Net sales/Average Total Asset 0.82 1.29
Inventory Turnover ratio COGS/Average Inventory 1.93 9.44
⊘ This is a preview!⊘
Do you want full access?
Subscribe today to unlock all pages.
Trusted by 1+ million students worldwide
1 out of 12
Related Documents


Your All-in-One AI-Powered Toolkit for Academic Success.
+13062052269
info@desklib.com
Available 24*7 on WhatsApp / Email
![[object Object]](/_next/static/media/star-bottom.7253800d.svg)
Unlock your academic potential
Copyright © 2020–2026 A2Z Services. All Rights Reserved. Developed and managed by ZUCOL.