FIN205 Business Finance Report: Stock Price Forecasting and Strategy
VerifiedAdded on 2022/10/16
|10
|1499
|372
Report
AI Summary
This report provides a detailed analysis of the stock prices of five companies: AGL Energy Limited, Australia and New Zealand Banking Group, National Australia Bank Limited, Qantas Airways, and Westpac Corporation. The analysis focuses on determining stock performance and valuation based on market factors. Key elements include the calculation of average returns, volatility using standard deviation, and beta values for each company, along with an assessment of associated risks. The report also presents a forecast of share prices and recommends investment strategies, emphasizing the importance of risk management tools like standard deviation and beta in making informed investment decisions. The study concludes with investment recommendations, highlighting Qantas as a top performer and suggesting an equally weighted portfolio strategy for diversified returns.

Running head: BUSINESS FINANCE 1
BUSINESS FINANCE
BUSINESS FINANCE
Paraphrase This Document
Need a fresh take? Get an instant paraphrase of this document with our AI Paraphraser
Running head: BUSINESS FINANCE
Contents
Overview.....................................................................................................................................................3
Part 1.......................................................................................................................................................3
A) Average returns............................................................................................................................3
B) Equally weighted portfolio..........................................................................................................4
Part 2: Volatility......................................................................................................................................4
B).............................................................................................................................................................5
C).............................................................................................................................................................5
Part 3: Beta..............................................................................................................................................5
A).............................................................................................................................................................5
B).............................................................................................................................................................6
Part 4:......................................................................................................................................................6
A Forecast and investment strategy.........................................................................................................6
B Recommendation.................................................................................................................................7
References...................................................................................................................................................8
Appendix 1................................................................................................................................................10
Running head: BUSINESS FINANCE
Overview
In this present case study the stock prices of the five companies namely AGL Energy Limited,
Australia and New Zealand Banking group, National Australia Bank Limited, Qantas Airways
and Westpac Corporation, have been analyzed in detail in order to figure out which stock is
performing well and whether it is undervalued or overvalued in terms of the market factors and
prices prevailing. At times it becomes imperative for the investors to give an overall outlook of
the stocks over the period of the last two years, in order to make sure the returns that have been
analyzed are nearby to the accurate figures. In the present study, the steps that have been
followed to prepare the report is the average returns, the volatility metric that has been
considered where the value of the standard deviation has been calculated. Further, the beta value
of each company has also been evaluated and the reasons for the risk have also been figured out.
Lastly, the forecast of the share price and which investment strategy shall be followed has also
been discussed (Boguth, Carlson, Fisher and Simutin, 2016).
Part 1
A) Average returns
The average returns are the returns which have been calculated over the period of last two years
in case of all the five companies. The average returns have been calculated using the formula
determined below (Chi, Qiao, Yan and Deng, 2019).
Returnt = Pt −Pt−1
Pt−1
×100 ,
⊘ This is a preview!⊘
Do you want full access?
Subscribe today to unlock all pages.
Trusted by 1+ million students worldwide
Running head: BUSINESS FINANCE
Jan-15
Apr-15
Jul-15
Oct-15
Jan-16
Apr-16
Jul-16
Oct-16
Jan-17
Apr-17
Jul-17
Oct-17
-25%
-20%
-15%
-10%
-5%
0%
5%
10%
15%
20%
25%
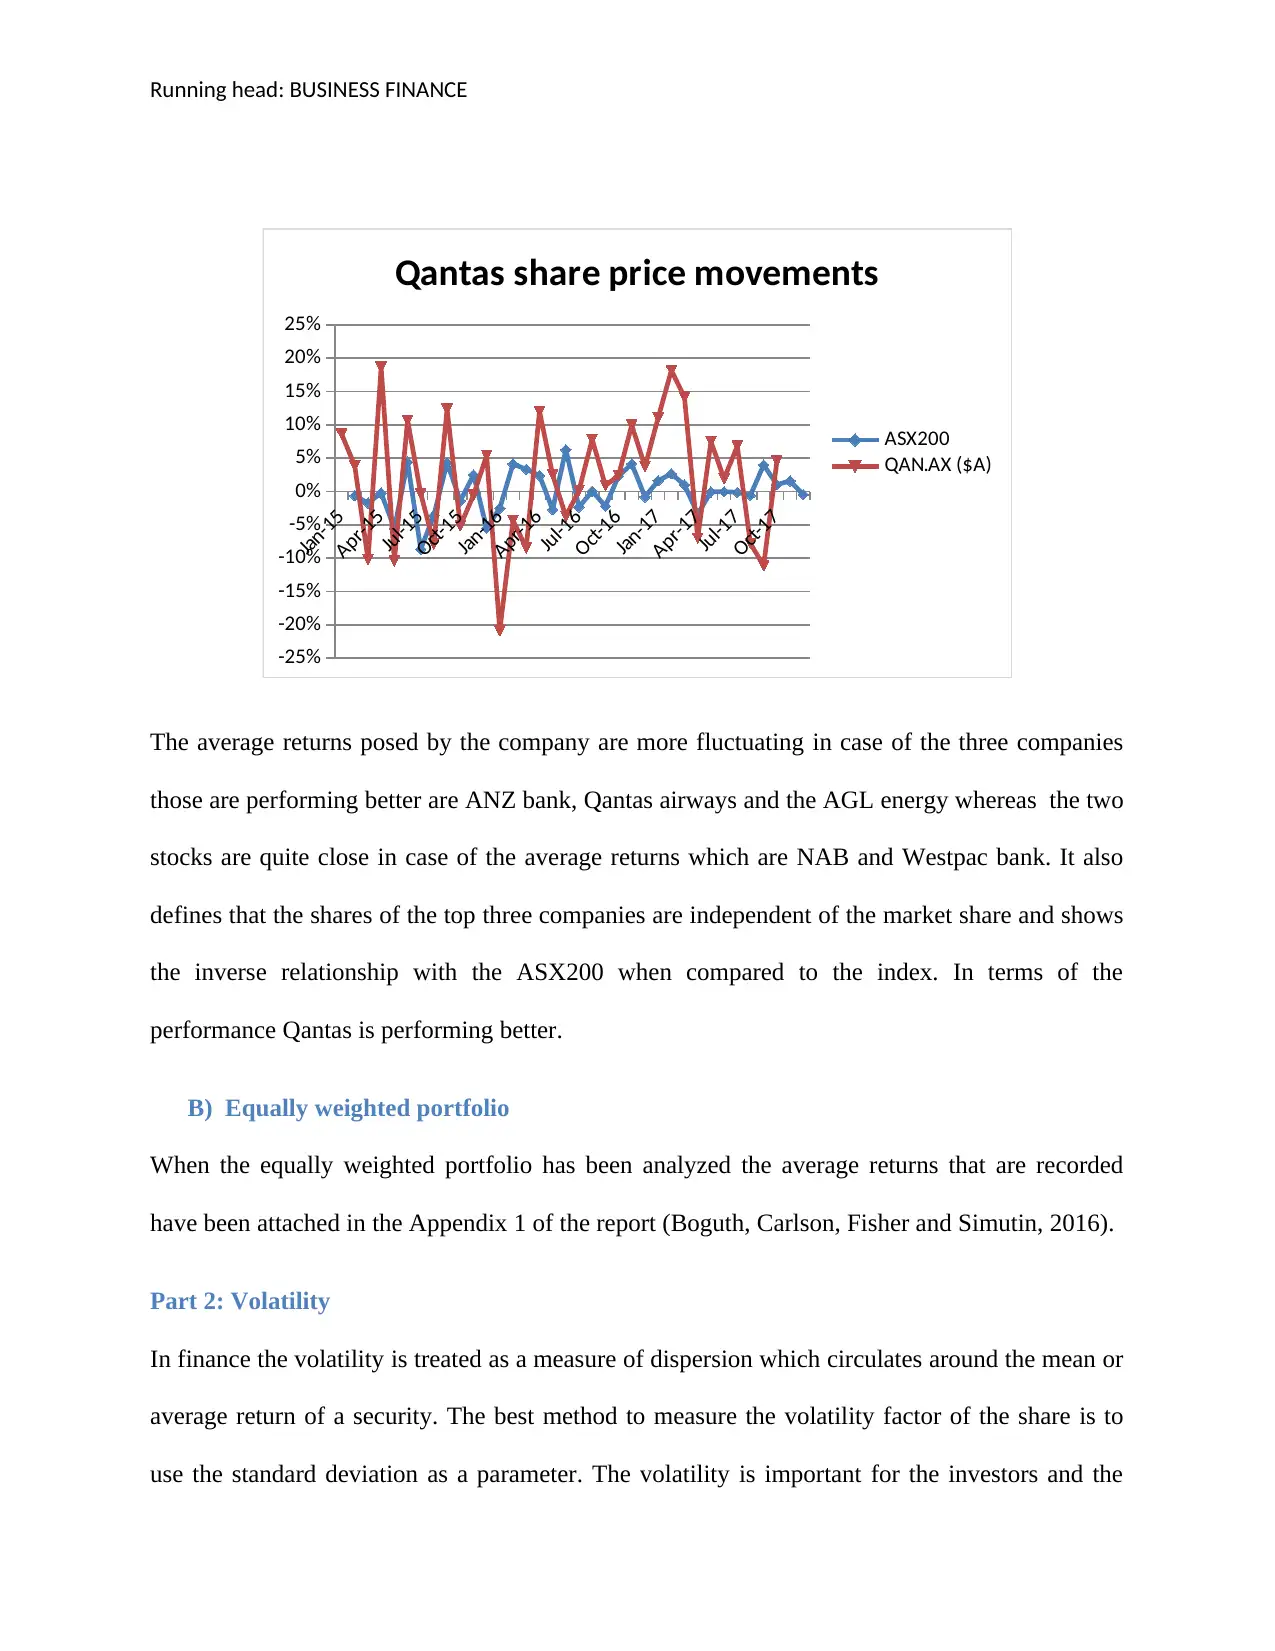
Qantas share price movements
ASX200
QAN.AX ($A)
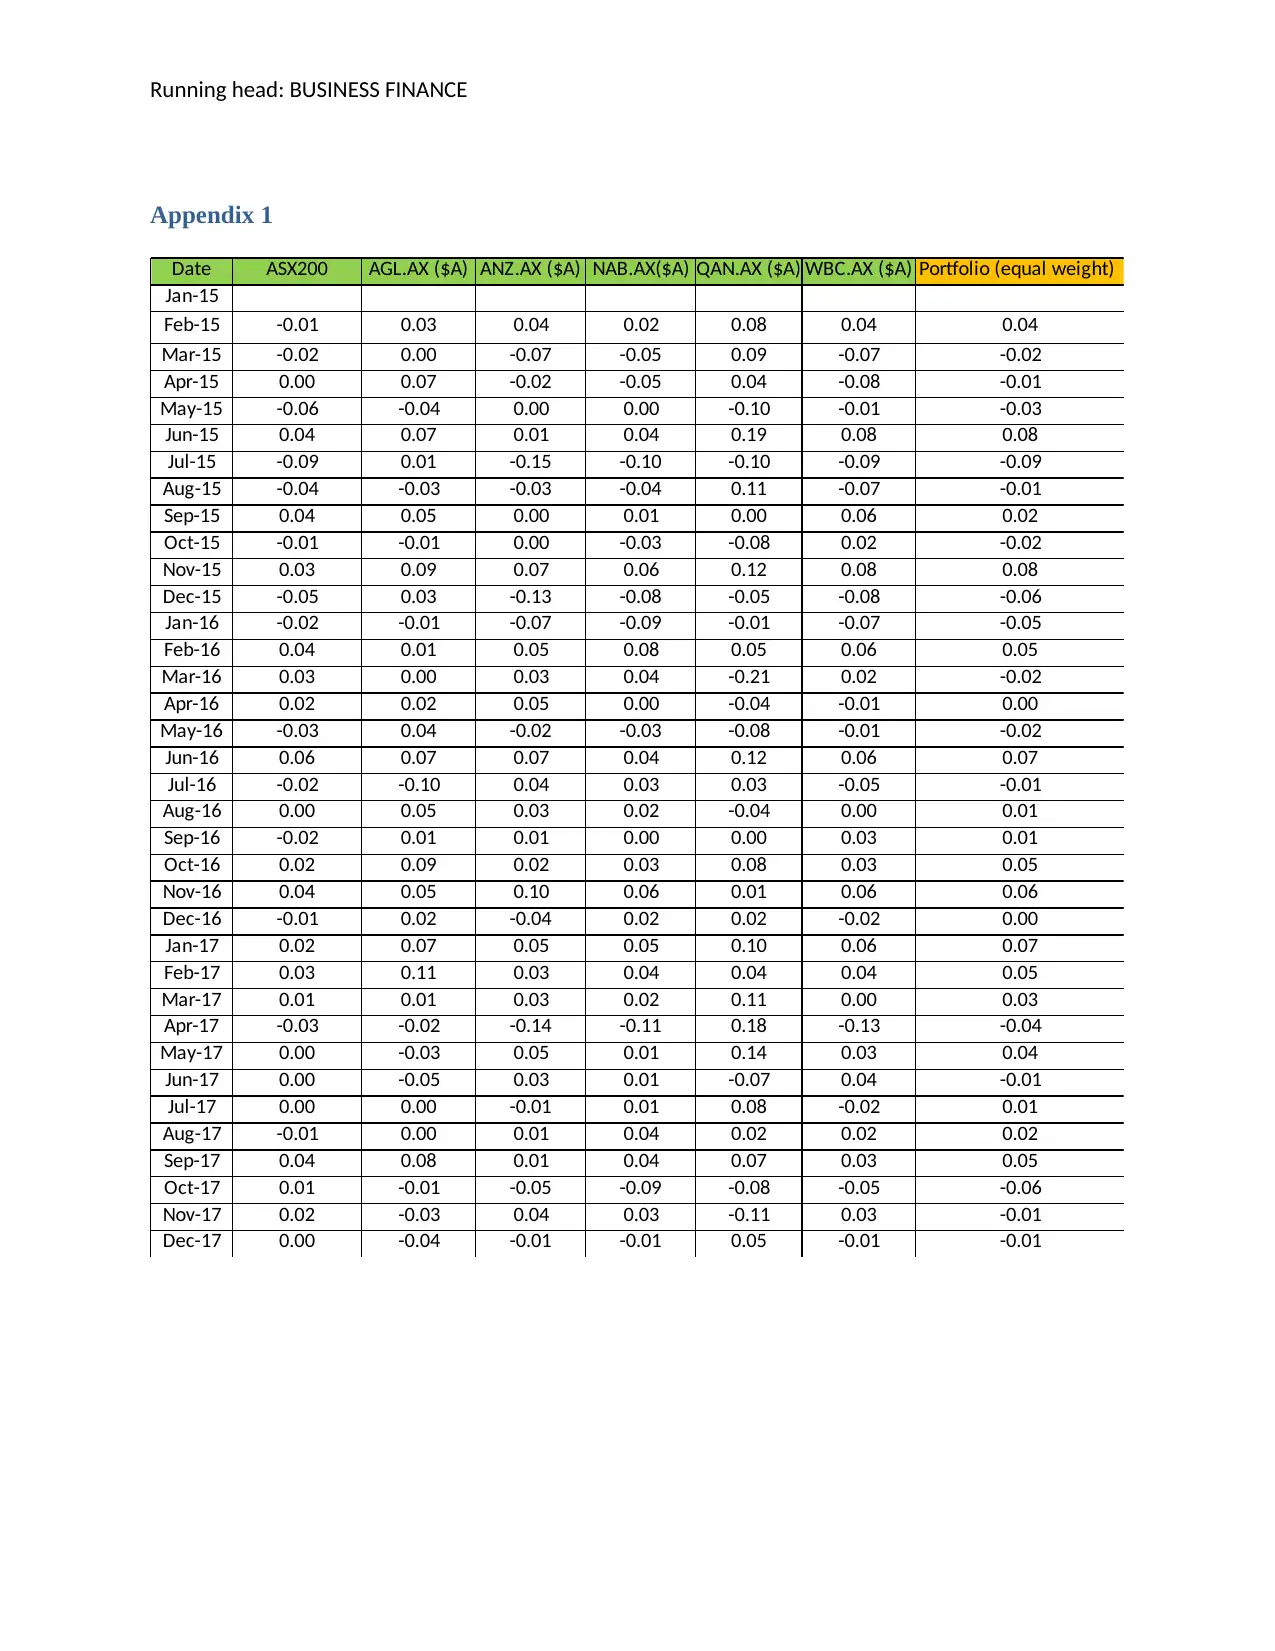
The average returns posed by the company are more fluctuating in case of the three companies
those are performing better are ANZ bank, Qantas airways and the AGL energy whereas the two
stocks are quite close in case of the average returns which are NAB and Westpac bank. It also
defines that the shares of the top three companies are independent of the market share and shows
the inverse relationship with the ASX200 when compared to the index. In terms of the
performance Qantas is performing better.
B) Equally weighted portfolio
When the equally weighted portfolio has been analyzed the average returns that are recorded
have been attached in the Appendix 1 of the report (Boguth, Carlson, Fisher and Simutin, 2016).
Part 2: Volatility
In finance the volatility is treated as a measure of dispersion which circulates around the mean or
average return of a security. The best method to measure the volatility factor of the share is to
use the standard deviation as a parameter. The volatility is important for the investors and the
Jan-15
Apr-15
Jul-15
Oct-15
Jan-16
Apr-16
Jul-16
Oct-16
Jan-17
Apr-17
Jul-17
Oct-17
-25%
-20%
-15%
-10%
-5%
0%
5%
10%
15%
20%
25%
Qantas share price movements
ASX200
QAN.AX ($A)
The average returns posed by the company are more fluctuating in case of the three companies
those are performing better are ANZ bank, Qantas airways and the AGL energy whereas the two
stocks are quite close in case of the average returns which are NAB and Westpac bank. It also
defines that the shares of the top three companies are independent of the market share and shows
the inverse relationship with the ASX200 when compared to the index. In terms of the
performance Qantas is performing better.
B) Equally weighted portfolio
When the equally weighted portfolio has been analyzed the average returns that are recorded
have been attached in the Appendix 1 of the report (Boguth, Carlson, Fisher and Simutin, 2016).
Part 2: Volatility
In finance the volatility is treated as a measure of dispersion which circulates around the mean or
average return of a security. The best method to measure the volatility factor of the share is to
use the standard deviation as a parameter. The volatility is important for the investors and the
Paraphrase This Document
Need a fresh take? Get an instant paraphrase of this document with our AI Paraphraser
Running head: BUSINESS FINANCE
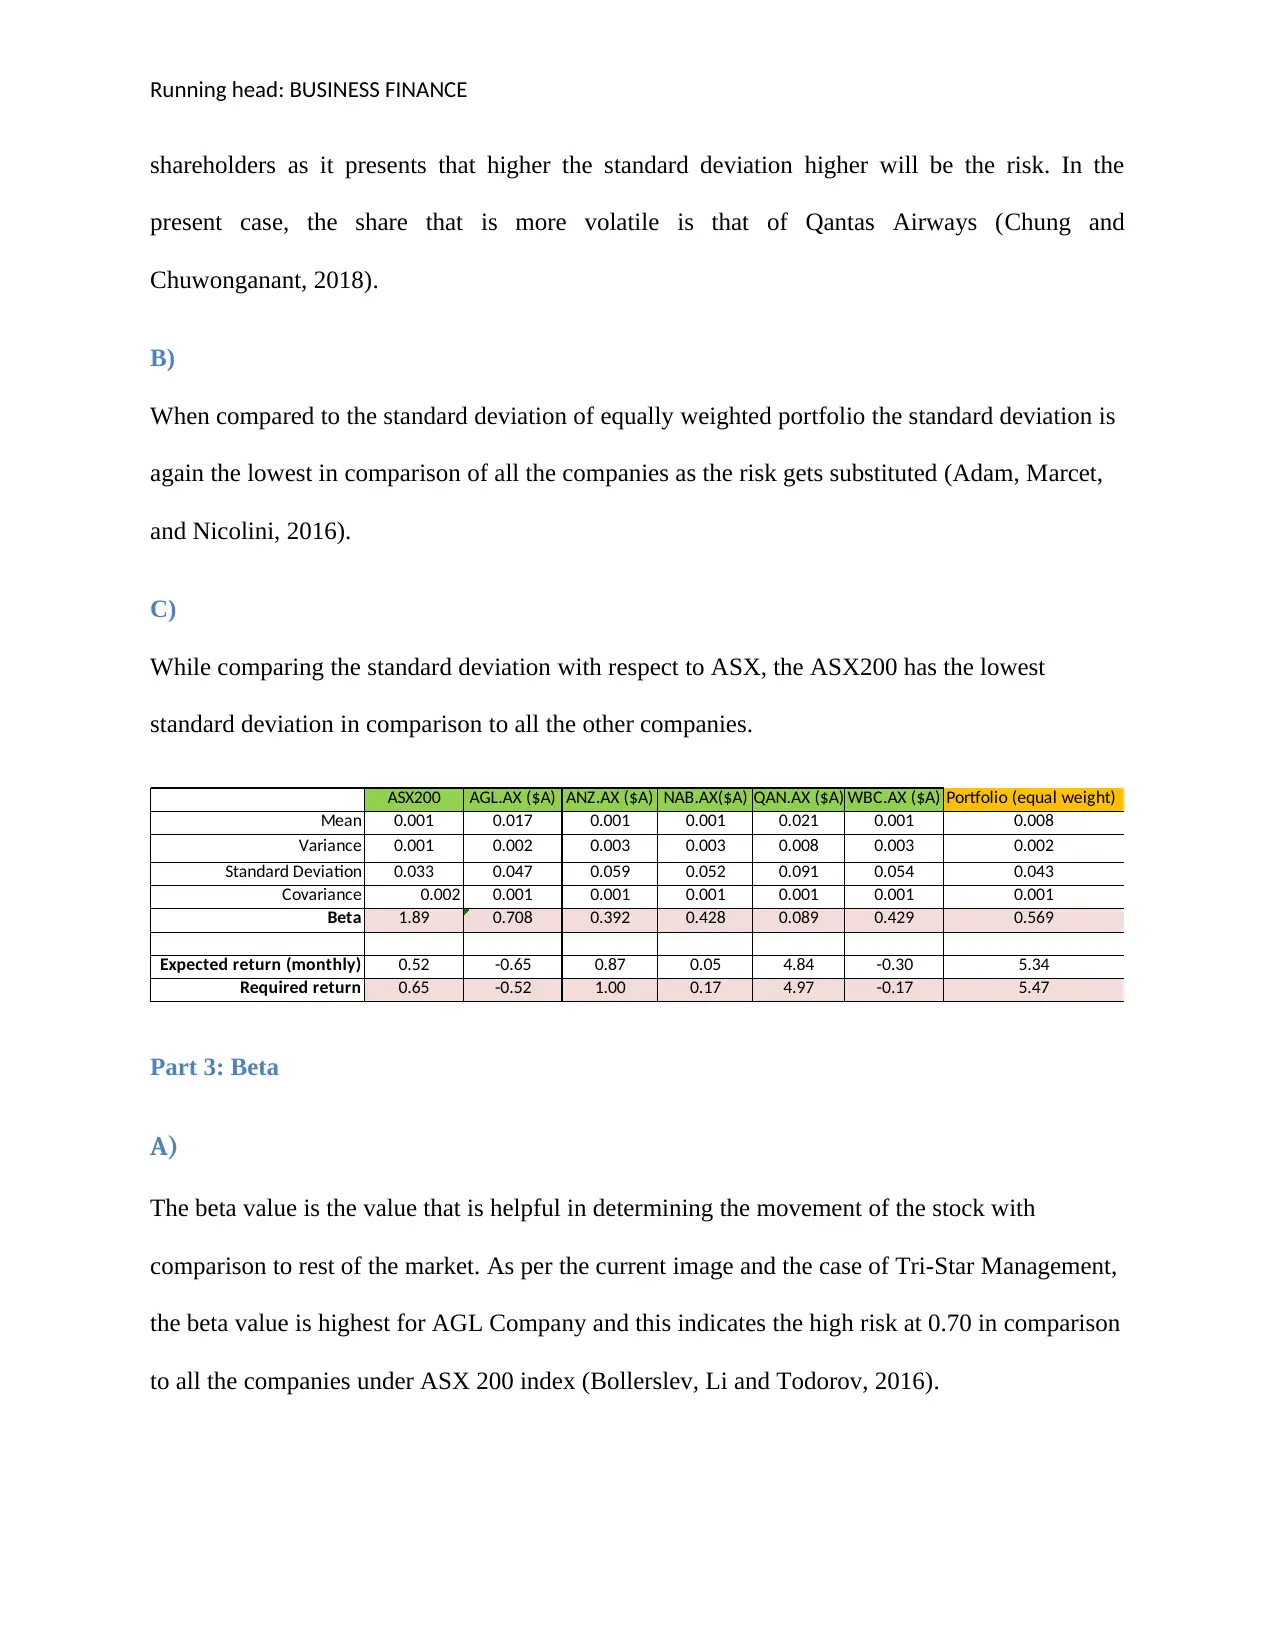
shareholders as it presents that higher the standard deviation higher will be the risk. In the
present case, the share that is more volatile is that of Qantas Airways (Chung and
Chuwonganant, 2018).
B)
When compared to the standard deviation of equally weighted portfolio the standard deviation is
again the lowest in comparison of all the companies as the risk gets substituted (Adam, Marcet,
and Nicolini, 2016).
C)
While comparing the standard deviation with respect to ASX, the ASX200 has the lowest
standard deviation in comparison to all the other companies.
ASX200 AGL.AX ($A) ANZ.AX ($A) NAB.AX($A) QAN.AX ($A) WBC.AX ($A) Portfolio (equal weight)
Mean 0.001 0.017 0.001 0.001 0.021 0.001 0.008
Variance 0.001 0.002 0.003 0.003 0.008 0.003 0.002
Standard Deviation 0.033 0.047 0.059 0.052 0.091 0.054 0.043
Covariance 0.002 0.001 0.001 0.001 0.001 0.001 0.001
Beta 1.89 0.708 0.392 0.428 0.089 0.429 0.569
Expected return (monthly) 0.52 -0.65 0.87 0.05 4.84 -0.30 5.34
Required return 0.65 -0.52 1.00 0.17 4.97 -0.17 5.47
Part 3: Beta
A)
The beta value is the value that is helpful in determining the movement of the stock with
comparison to rest of the market. As per the current image and the case of Tri-Star Management,
the beta value is highest for AGL Company and this indicates the high risk at 0.70 in comparison
to all the companies under ASX 200 index (Bollerslev, Li and Todorov, 2016).
Running head: BUSINESS FINANCE
B)
The values of the companies fluctuate due to the market factors and also according to the rule the
beta values less than 1 are less risky. The major changes are taking place because of the
fluctuation in the variance and the covariance of the companies (Ahn, Horenstein and Wang,
2018).
Part 4:
A Forecast and investment strategy
A) Risk Measurement: Generally each and every share is associated with some kind of the
risk and there are several factors due to which the share price of any company fluctuates.
Risk management of the shares is one of the crucial processes to deal with and therefore
different key drivers are taken into consideration to value the risk of the share. Such
elements are standard deviation, the beta of the share, variance and covariance. All these
metrics are used so that it becomes beneficial for the investors to deal make the
investment decisions. In the present case study the high risky share is AGL energy as its
beta value is 0.70 whereas the lowest risk can be found in the share of Qantas Airways
(Lahmiri, 2016).
B) Evaluation: The share prices of the five companies have been estimated by Tri Star
Management where it has been compared against the market prices and to be precise the
current trading value have been taken into consideration. The shares of AGL, ANZ and
Qantas are overvalued in terms of the market price whereas the shares of Westpac and
NAB are undervalued (Higgins, 2018).
⊘ This is a preview!⊘
Do you want full access?
Subscribe today to unlock all pages.
Trusted by 1+ million students worldwide
Running head: BUSINESS FINANCE
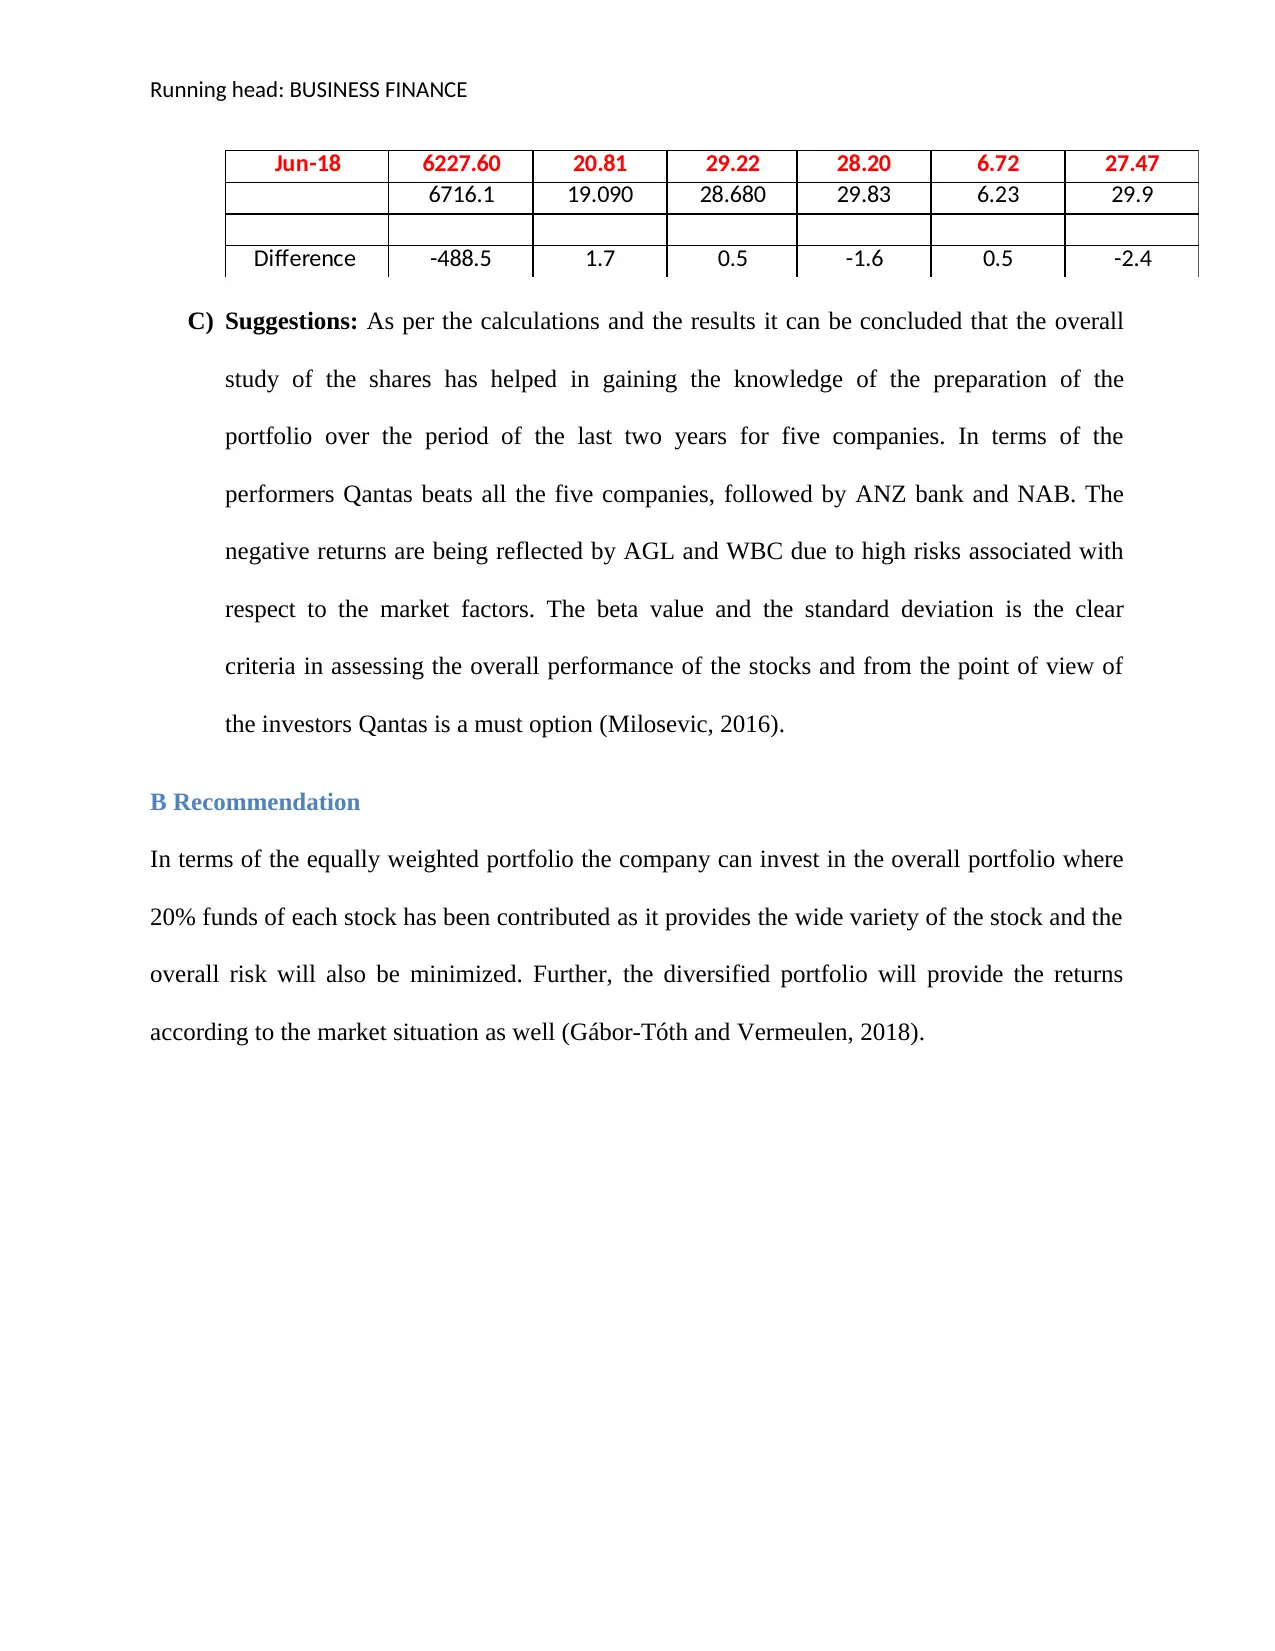
Jun-18 6227.60 20.81 29.22 28.20 6.72 27.47
6716.1 19.090 28.680 29.83 6.23 29.9
Difference -488.5 1.7 0.5 -1.6 0.5 -2.4
C) Suggestions: As per the calculations and the results it can be concluded that the overall
study of the shares has helped in gaining the knowledge of the preparation of the
portfolio over the period of the last two years for five companies. In terms of the
performers Qantas beats all the five companies, followed by ANZ bank and NAB. The
negative returns are being reflected by AGL and WBC due to high risks associated with
respect to the market factors. The beta value and the standard deviation is the clear
criteria in assessing the overall performance of the stocks and from the point of view of
the investors Qantas is a must option (Milosevic, 2016).
B Recommendation
In terms of the equally weighted portfolio the company can invest in the overall portfolio where
20% funds of each stock has been contributed as it provides the wide variety of the stock and the
overall risk will also be minimized. Further, the diversified portfolio will provide the returns
according to the market situation as well (Gábor-Tóth and Vermeulen, 2018).
Paraphrase This Document
Need a fresh take? Get an instant paraphrase of this document with our AI Paraphraser
Running head: BUSINESS FINANCE
References
Adam, K., Marcet, A. and Nicolini, J.P., 2016. Stock market volatility and learning. The Journal
of Finance, 71(1), pp.33-82.
Ahn, S.C., Horenstein, A.R. and Wang, N., 2018. Beta matrix and common factors in stock
returns. Journal of Financial and Quantitative Analysis, 53(3), pp.1417-1440.
Boguth, O., Carlson, M., Fisher, A. and Simutin, M., 2016. Horizon effects in average returns:
The role of slow information diffusion. The Review of Financial Studies, 29(8), pp.2241-2281.
Bollerslev, T., Li, S.Z. and Todorov, V., 2016. Roughing up beta: Continuous versus
discontinuous betas and the cross section of expected stock returns. Journal of Financial
Economics, 120(3), pp.464-490.
Chi, Y., Qiao, X., Yan, S. and Deng, B., 2019. Volatility and Returns: Evidence from
China. Available at SSRN 3430143.
Chung, K.H. and Chuwonganant, C., 2018. Market volatility and stock returns: The role of
liquidity providers. Journal of Financial Markets, 37, pp.17-34.
Gábor-Tóth, E. and Vermeulen, P., 2018. The relative importance of taste shocks and price
movements in the variation of cost-of-living: evidence from scanner data. Available at SSRN
3246221.
Higgins, C.J., 2018. Simulating the Case against Stock Picking. Journal of Accounting, Business
and Finance Research, 4(1), pp.37-39.

Running head: BUSINESS FINANCE
Lahmiri, S., 2016. Intraday stock price forecasting based on variational mode
decomposition. Journal of Computational Science, 12, pp.23-27.
Milosevic, N., 2016. Equity forecast: Predicting long term stock price movement using machine
learning. arXiv preprint arXiv:1603.00751.
Lahmiri, S., 2016. Intraday stock price forecasting based on variational mode
decomposition. Journal of Computational Science, 12, pp.23-27.
Milosevic, N., 2016. Equity forecast: Predicting long term stock price movement using machine
learning. arXiv preprint arXiv:1603.00751.
⊘ This is a preview!⊘
Do you want full access?
Subscribe today to unlock all pages.
Trusted by 1+ million students worldwide
Running head: BUSINESS FINANCE
Appendix 1
Date ASX200 AGL.AX ($A) ANZ.AX ($A) NAB.AX($A) QAN.AX ($A) WBC.AX ($A) Portfolio (equal weight)
Jan-15
Feb-15 -0.01 0.03 0.04 0.02 0.08 0.04 0.04
Mar-15 -0.02 0.00 -0.07 -0.05 0.09 -0.07 -0.02
Apr-15 0.00 0.07 -0.02 -0.05 0.04 -0.08 -0.01
May-15 -0.06 -0.04 0.00 0.00 -0.10 -0.01 -0.03
Jun-15 0.04 0.07 0.01 0.04 0.19 0.08 0.08
Jul-15 -0.09 0.01 -0.15 -0.10 -0.10 -0.09 -0.09
Aug-15 -0.04 -0.03 -0.03 -0.04 0.11 -0.07 -0.01
Sep-15 0.04 0.05 0.00 0.01 0.00 0.06 0.02
Oct-15 -0.01 -0.01 0.00 -0.03 -0.08 0.02 -0.02
Nov-15 0.03 0.09 0.07 0.06 0.12 0.08 0.08
Dec-15 -0.05 0.03 -0.13 -0.08 -0.05 -0.08 -0.06
Jan-16 -0.02 -0.01 -0.07 -0.09 -0.01 -0.07 -0.05
Feb-16 0.04 0.01 0.05 0.08 0.05 0.06 0.05
Mar-16 0.03 0.00 0.03 0.04 -0.21 0.02 -0.02
Apr-16 0.02 0.02 0.05 0.00 -0.04 -0.01 0.00
May-16 -0.03 0.04 -0.02 -0.03 -0.08 -0.01 -0.02
Jun-16 0.06 0.07 0.07 0.04 0.12 0.06 0.07
Jul-16 -0.02 -0.10 0.04 0.03 0.03 -0.05 -0.01
Aug-16 0.00 0.05 0.03 0.02 -0.04 0.00 0.01
Sep-16 -0.02 0.01 0.01 0.00 0.00 0.03 0.01
Oct-16 0.02 0.09 0.02 0.03 0.08 0.03 0.05
Nov-16 0.04 0.05 0.10 0.06 0.01 0.06 0.06
Dec-16 -0.01 0.02 -0.04 0.02 0.02 -0.02 0.00
Jan-17 0.02 0.07 0.05 0.05 0.10 0.06 0.07
Feb-17 0.03 0.11 0.03 0.04 0.04 0.04 0.05
Mar-17 0.01 0.01 0.03 0.02 0.11 0.00 0.03
Apr-17 -0.03 -0.02 -0.14 -0.11 0.18 -0.13 -0.04
May-17 0.00 -0.03 0.05 0.01 0.14 0.03 0.04
Jun-17 0.00 -0.05 0.03 0.01 -0.07 0.04 -0.01
Jul-17 0.00 0.00 -0.01 0.01 0.08 -0.02 0.01
Aug-17 -0.01 0.00 0.01 0.04 0.02 0.02 0.02
Sep-17 0.04 0.08 0.01 0.04 0.07 0.03 0.05
Oct-17 0.01 -0.01 -0.05 -0.09 -0.08 -0.05 -0.06
Nov-17 0.02 -0.03 0.04 0.03 -0.11 0.03 -0.01
Dec-17 0.00 -0.04 -0.01 -0.01 0.05 -0.01 -0.01
1 out of 10
Related Documents


Your All-in-One AI-Powered Toolkit for Academic Success.
+13062052269
info@desklib.com
Available 24*7 on WhatsApp / Email
![[object Object]](/_next/static/media/star-bottom.7253800d.svg)
Unlock your academic potential
Copyright © 2020–2026 A2Z Services. All Rights Reserved. Developed and managed by ZUCOL.