Business Finance Report: Investment and Capital Budgeting Analysis
VerifiedAdded on 2020/10/23
|10
|2718
|485
Report
AI Summary
This business finance report delves into key concepts such as the Capital Asset Pricing Model (CAPM) used to determine the cost of equity and its relationship with systematic risk. It explores efficient capital markets and their importance for financial managers, along with the assumptions of the dividend valuation model. The report utilizes Net Present Value (NPV) as a capital budgeting tool to assess project viability. It presents a client's investment scenario, calculating the cost of equity, Weighted Average Cost of Capital (WACC), and evaluating projects using financial metrics. The analysis includes detailed calculations and interpretations, providing insights into investment decisions and financial planning. The report also covers the use of dividend valuation model to determine the worth of the stock prices.

BUSINESS FINANCE
Paraphrase This Document
Need a fresh take? Get an instant paraphrase of this document with our AI Paraphraser
Table of Contents
INTRODUCTION ..........................................................................................................................3
DISCUSSION .................................................................................................................................3
Capital Asset pricing Model .......................................................................................................3
Efficient capital market ..............................................................................................................4
Assumptions for general dividend valuation model....................................................................4
Net present value as capital budgeting tool ..............................................................................5
Client's Investment ..........................................................................................................................5
1. Cost of equity ........................................................................................................................5
2. Weighted average cost of capital...........................................................................................6
3. Project evaluation ..................................................................................................................8
CONCLUSION ...............................................................................................................................9
REFERENCES .............................................................................................................................10
INTRODUCTION
Business finance refers to the sources and utilization of the funds in the organisation in
effective and efficient manner in order ton increase the profitability and performance of the
organisation. This assignment will provide information regarding capital assets pricing model
which is used for calculating the cost of equity. Moreover, it will involved the discussion on the
efficient capital market and the importance of market efficiency for the financial managers. Also,
It will contain the information regarding net present value through the client is able to
understand the viability of the project. The assignment will also provide the information
regarding dividend valuation model.
DISCUSSION
Capital Asset pricing Model
The capital asset pricing model is used in order to determine the required rate of return
for the risky assets. This model describe the relationship between systematic risk and the
expected return associated with the assets. The capital assets pricing model provide that the
investors must be compensated in two ways that is time value of money and the risk. This
model assist in identifying the risk and return associated with the asset. This model is used to
decide what price should be paid for the assets or stock. the financial analyst uses the capital
assets pricing model in order to estimate the cost of shareholders equity (Burns and Dewhurst,
2016). It is used to determine the pricing of risky securities , generating expected return for
assets and for calculating cost of capital. It help in evaluating the return on assets by
comparing the price in which the investors should invest in order to generate higher return.
It mean to determine the cost of equity in order to reduce the risk of the investors while
investing their funds in the less risk investment which can generate higher return. The capital
assets pricing model calculate the cost of equity on the basis of the risk associated with the
investment and also include the risk free rate of return on the basis of which the investors are
able to make decision regarding the investment (Jordà, Schularick and Taylor, 2016). The
capital assets pricing model is effective way to identify the cost of equity as this method is easy
and simple to calculate which help in provide understanding and knowledge of the better
investment project.
⊘ This is a preview!⊘
Do you want full access?
Subscribe today to unlock all pages.
Trusted by 1+ million students worldwide
Efficient capital market
The efficient capital market is whereas the information related to the value of securities
is incorporate into its prices. As per the efficient capital market the investors are able to make
the decision regarding which market they should invest in order to generate higher return. With
the help of intrinsic value of shares helps in understanding the market efficiency (Maxwell, D.,
2017). market hypothesis re developed on the basis of which the securities of the companies
listed in different market are compared with each other on the basis of which the investors are
able to identify which market is efficient to provide higher return on their investment. market
efficiency reflect the prices which reflect the all the information regarding the stock.
The market efficiency is important for the financial managers because it helps in
understanding about the stock market and the performance and contribution to the economy. It
provide information to the financing managers regarding the decision made by the management
which are reflect in the stock prices. The financial managers with the help of net present value
of the investment are able to determine the future cash flows and can make and effective
decision regarding the investment which will help in increasing the return.
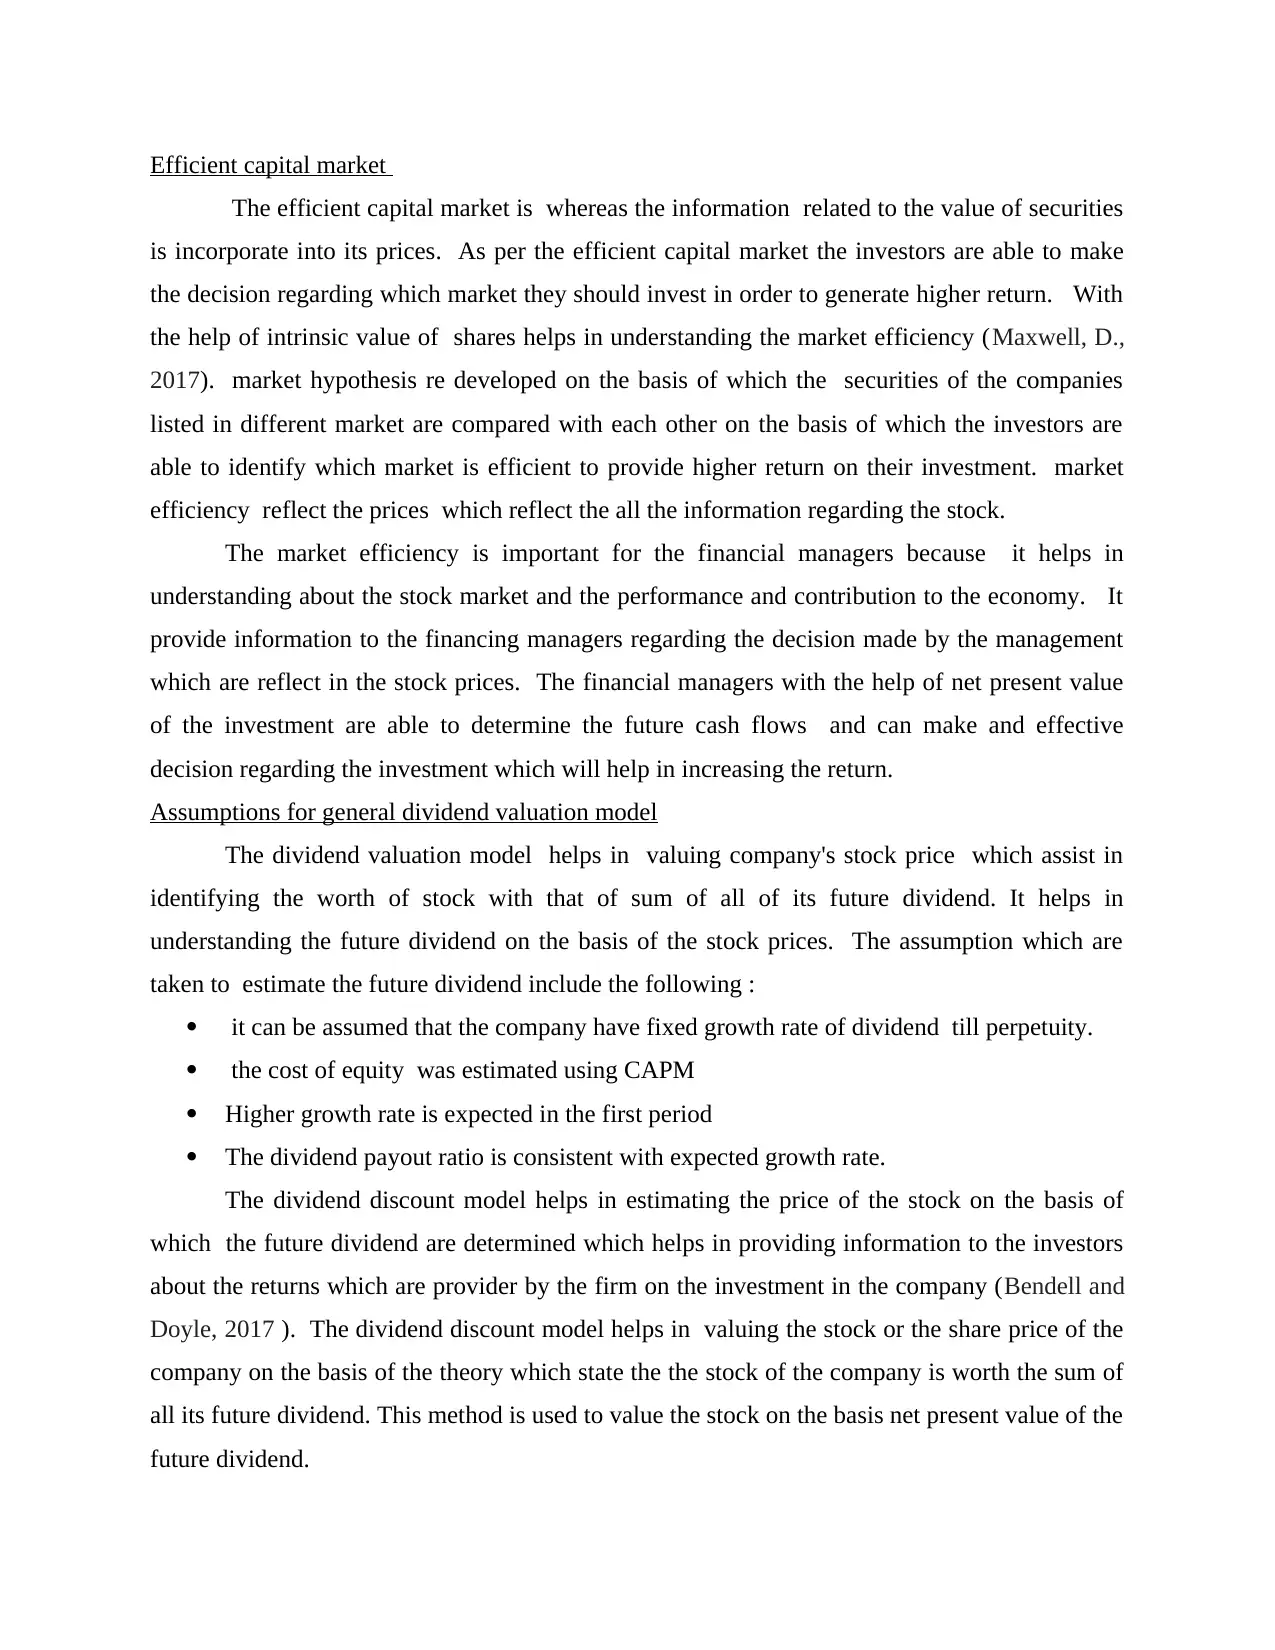
Assumptions for general dividend valuation model
The dividend valuation model helps in valuing company's stock price which assist in
identifying the worth of stock with that of sum of all of its future dividend. It helps in
understanding the future dividend on the basis of the stock prices. The assumption which are
taken to estimate the future dividend include the following :
it can be assumed that the company have fixed growth rate of dividend till perpetuity.
the cost of equity was estimated using CAPM
Higher growth rate is expected in the first period
The dividend payout ratio is consistent with expected growth rate.
The dividend discount model helps in estimating the price of the stock on the basis of
which the future dividend are determined which helps in providing information to the investors
about the returns which are provider by the firm on the investment in the company (Bendell and
Doyle, 2017 ). The dividend discount model helps in valuing the stock or the share price of the
company on the basis of the theory which state the the stock of the company is worth the sum of
all its future dividend. This method is used to value the stock on the basis net present value of the
future dividend.
The efficient capital market is whereas the information related to the value of securities
is incorporate into its prices. As per the efficient capital market the investors are able to make
the decision regarding which market they should invest in order to generate higher return. With
the help of intrinsic value of shares helps in understanding the market efficiency (Maxwell, D.,
2017). market hypothesis re developed on the basis of which the securities of the companies
listed in different market are compared with each other on the basis of which the investors are
able to identify which market is efficient to provide higher return on their investment. market
efficiency reflect the prices which reflect the all the information regarding the stock.
The market efficiency is important for the financial managers because it helps in
understanding about the stock market and the performance and contribution to the economy. It
provide information to the financing managers regarding the decision made by the management
which are reflect in the stock prices. The financial managers with the help of net present value
of the investment are able to determine the future cash flows and can make and effective
decision regarding the investment which will help in increasing the return.
Assumptions for general dividend valuation model
The dividend valuation model helps in valuing company's stock price which assist in
identifying the worth of stock with that of sum of all of its future dividend. It helps in
understanding the future dividend on the basis of the stock prices. The assumption which are
taken to estimate the future dividend include the following :
it can be assumed that the company have fixed growth rate of dividend till perpetuity.
the cost of equity was estimated using CAPM
Higher growth rate is expected in the first period
The dividend payout ratio is consistent with expected growth rate.
The dividend discount model helps in estimating the price of the stock on the basis of
which the future dividend are determined which helps in providing information to the investors
about the returns which are provider by the firm on the investment in the company (Bendell and
Doyle, 2017 ). The dividend discount model helps in valuing the stock or the share price of the
company on the basis of the theory which state the the stock of the company is worth the sum of
all its future dividend. This method is used to value the stock on the basis net present value of the
future dividend.
Paraphrase This Document
Need a fresh take? Get an instant paraphrase of this document with our AI Paraphraser
Net present value as capital budgeting tool
The net present value is the capital budgeting tool which is used to identify the viable
project in which the company should invest for generating higher return. The net present value
uses discounted cash flows in order to identify the project in which the company should invest.
while evaluating the capital investment project it is necessary to determine if the investment
project are independent or mutually exclusive (Net Present Value (NPV), 2019). The
independent project are those which are not affected by the cash flows of other project whereas
mutually exclusive projects are those which have two ways of determining the same result.
NPV = Discounted value of cash flows – cost of investment
The net present value is more effective process in order to evaluate the project. for
determining the net present value of the project is it important to identify the difference between
the cost of project and the cash flows which are being generated by that project. The capital
project are evaluated on the basis of the net present value (Burns, 2016). If the project is
independent than the project is accepted when NPV is positive and rejected when NPV is
negative. whereas if the project is mutually exclusive than the project with higher NPV is
accepted. the net present value is the difference between the present value of cash inflows and
the present value of cash outflows. The net present value is used as capital budgeting tool and
investment purpose in order to determine the profitability of the investment project.
Client's Investment
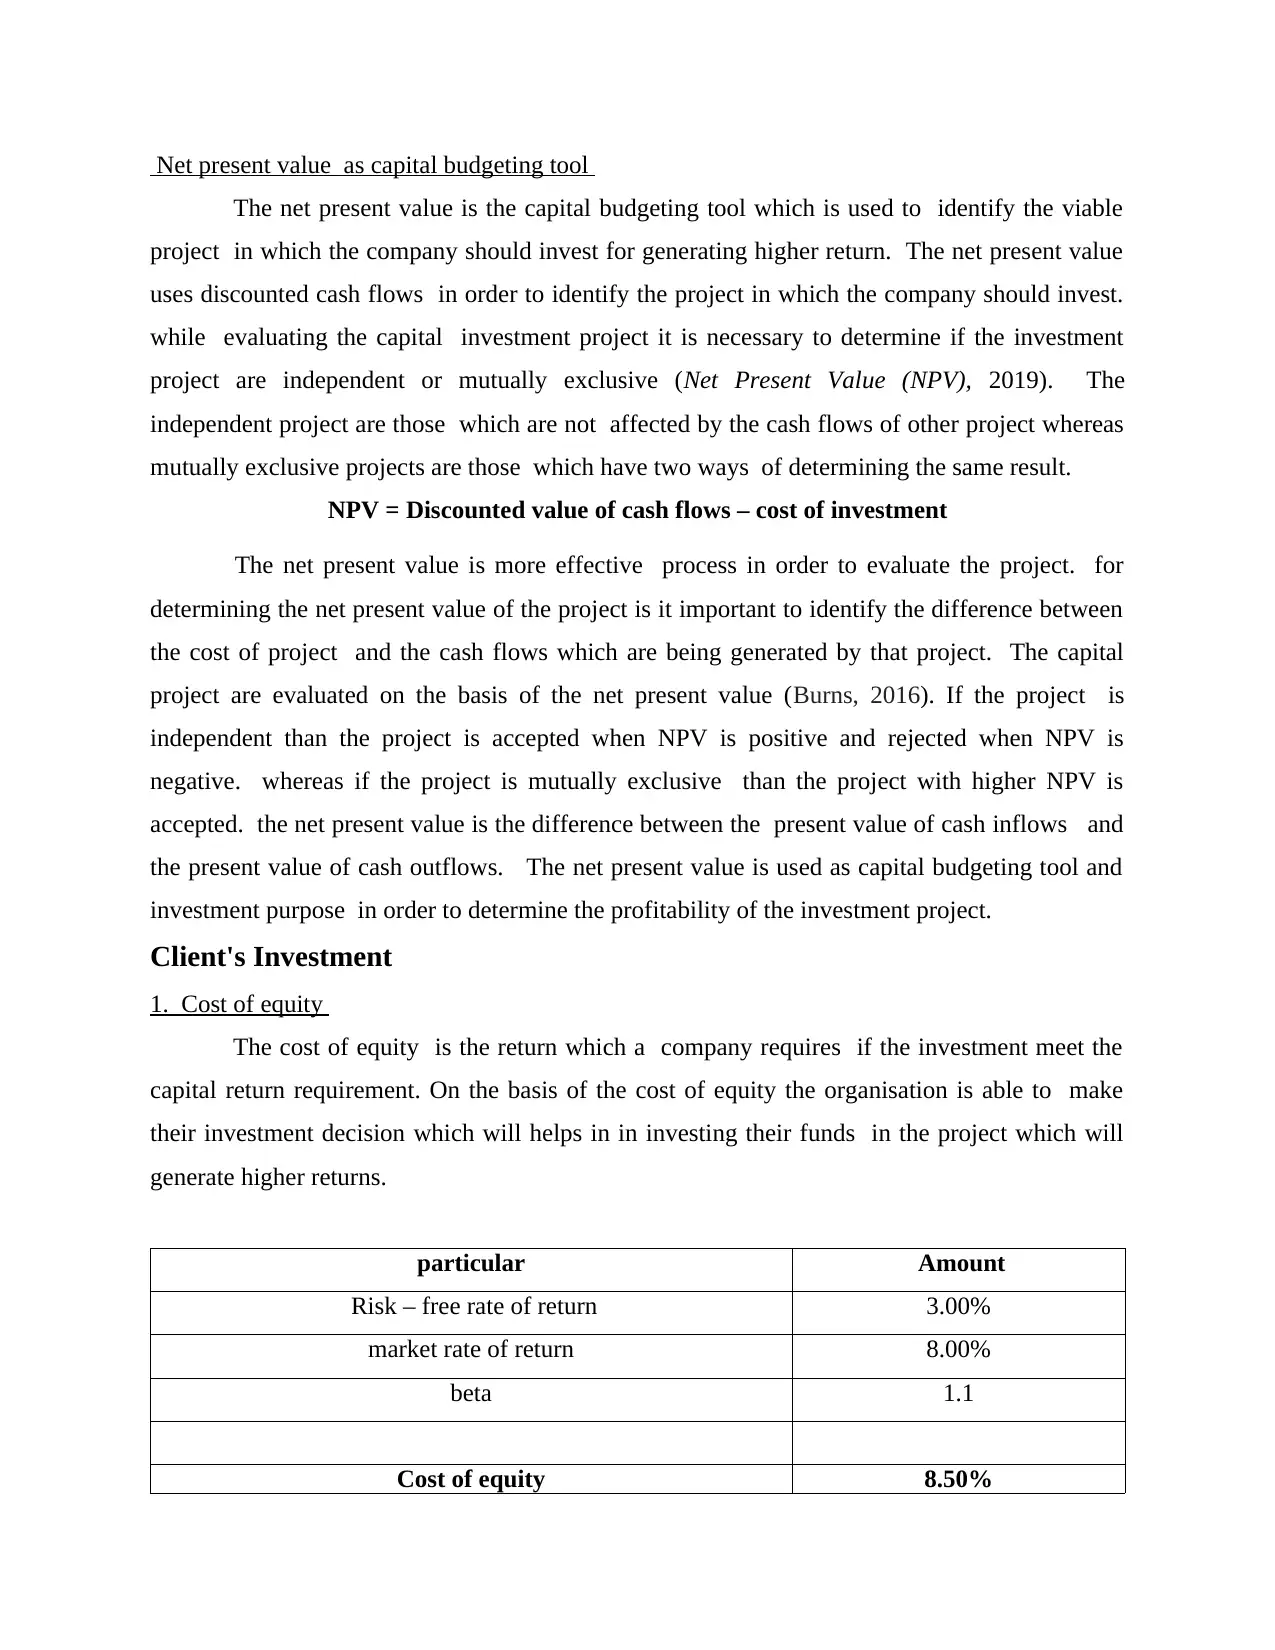
1. Cost of equity
The cost of equity is the return which a company requires if the investment meet the
capital return requirement. On the basis of the cost of equity the organisation is able to make
their investment decision which will helps in in investing their funds in the project which will
generate higher returns.
particular Amount
Risk – free rate of return 3.00%
market rate of return 8.00%
beta 1.1
Cost of equity 8.50%
The net present value is the capital budgeting tool which is used to identify the viable
project in which the company should invest for generating higher return. The net present value
uses discounted cash flows in order to identify the project in which the company should invest.
while evaluating the capital investment project it is necessary to determine if the investment
project are independent or mutually exclusive (Net Present Value (NPV), 2019). The
independent project are those which are not affected by the cash flows of other project whereas
mutually exclusive projects are those which have two ways of determining the same result.
NPV = Discounted value of cash flows – cost of investment
The net present value is more effective process in order to evaluate the project. for
determining the net present value of the project is it important to identify the difference between
the cost of project and the cash flows which are being generated by that project. The capital
project are evaluated on the basis of the net present value (Burns, 2016). If the project is
independent than the project is accepted when NPV is positive and rejected when NPV is
negative. whereas if the project is mutually exclusive than the project with higher NPV is
accepted. the net present value is the difference between the present value of cash inflows and
the present value of cash outflows. The net present value is used as capital budgeting tool and
investment purpose in order to determine the profitability of the investment project.
Client's Investment
1. Cost of equity
The cost of equity is the return which a company requires if the investment meet the
capital return requirement. On the basis of the cost of equity the organisation is able to make
their investment decision which will helps in in investing their funds in the project which will
generate higher returns.
particular Amount
Risk – free rate of return 3.00%
market rate of return 8.00%
beta 1.1
Cost of equity 8.50%
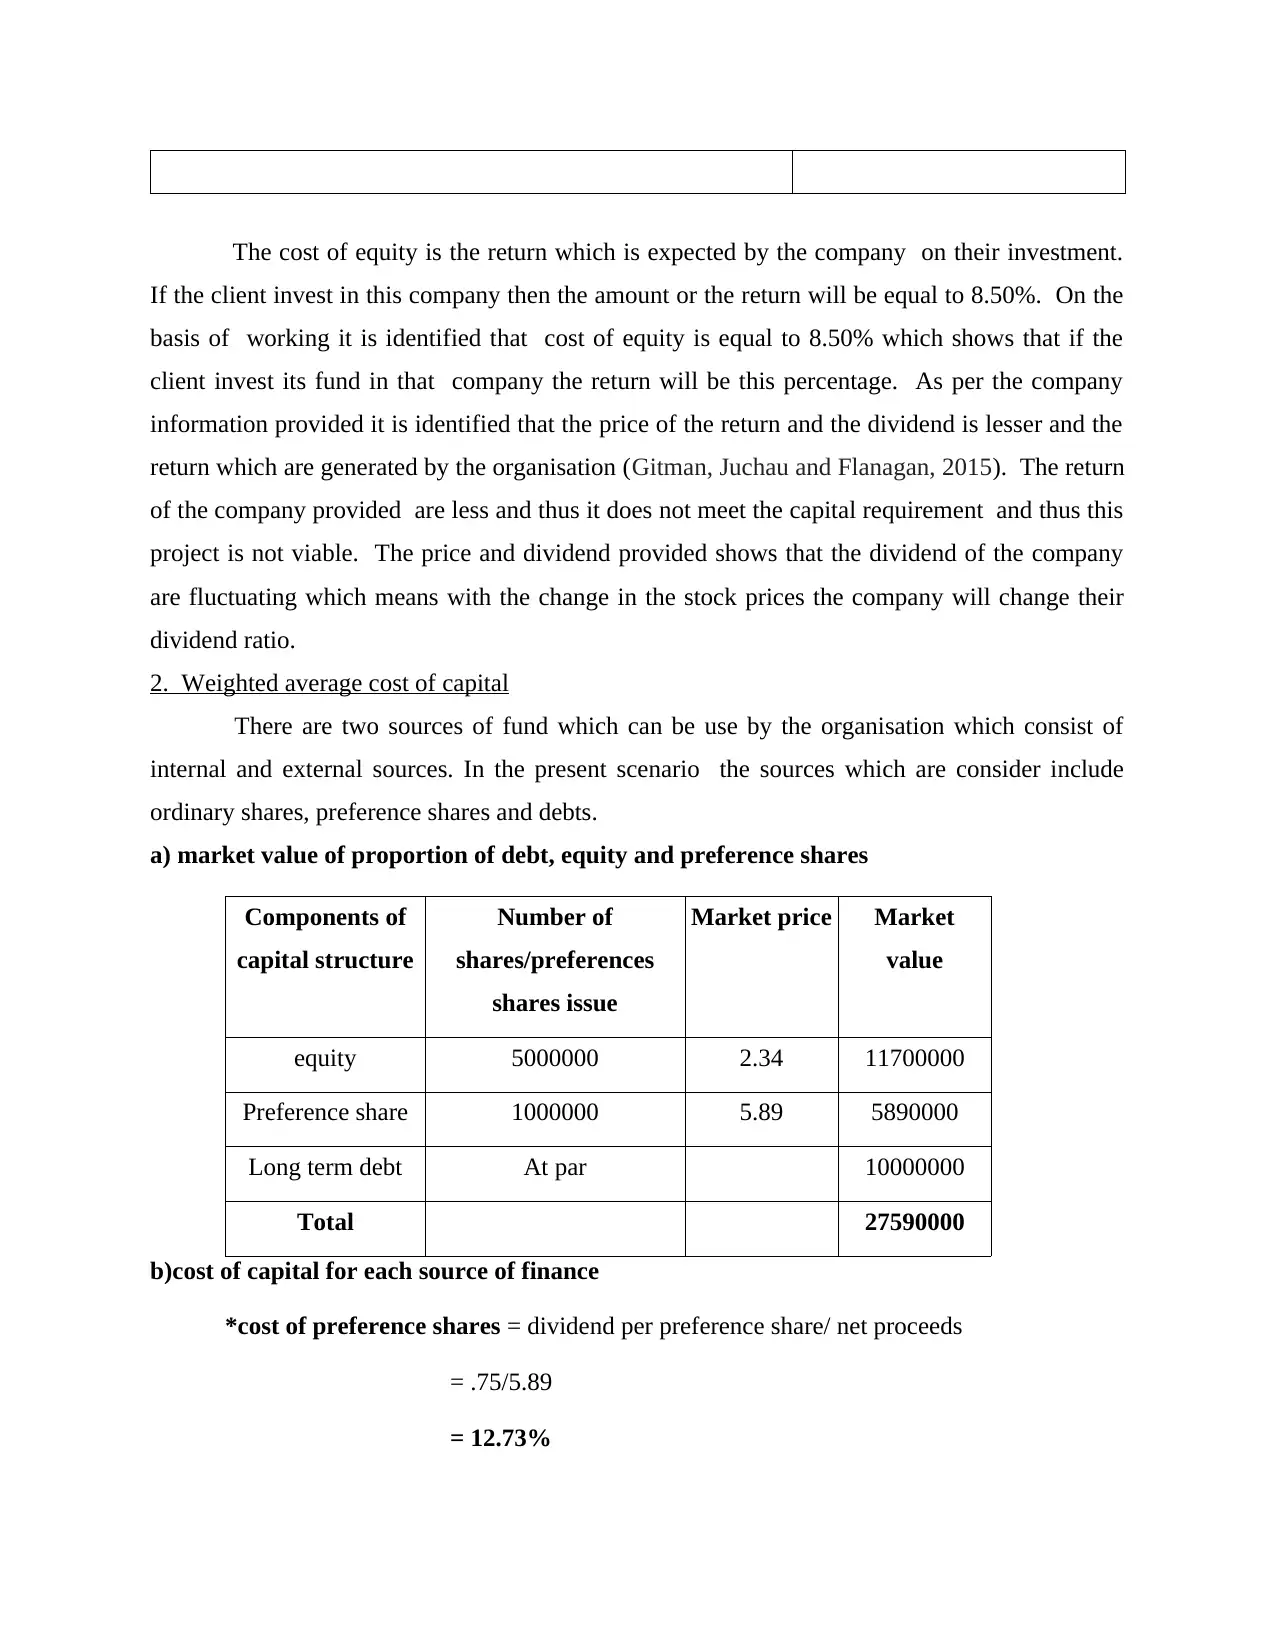
The cost of equity is the return which is expected by the company on their investment.
If the client invest in this company then the amount or the return will be equal to 8.50%. On the
basis of working it is identified that cost of equity is equal to 8.50% which shows that if the
client invest its fund in that company the return will be this percentage. As per the company
information provided it is identified that the price of the return and the dividend is lesser and the
return which are generated by the organisation (Gitman, Juchau and Flanagan, 2015). The return
of the company provided are less and thus it does not meet the capital requirement and thus this
project is not viable. The price and dividend provided shows that the dividend of the company
are fluctuating which means with the change in the stock prices the company will change their
dividend ratio.
2. Weighted average cost of capital
There are two sources of fund which can be use by the organisation which consist of
internal and external sources. In the present scenario the sources which are consider include
ordinary shares, preference shares and debts.
a) market value of proportion of debt, equity and preference shares
Components of
capital structure
Number of
shares/preferences
shares issue
Market price Market
value
equity 5000000 2.34 11700000
Preference share 1000000 5.89 5890000
Long term debt At par 10000000
Total 27590000
b)cost of capital for each source of finance
*cost of preference shares = dividend per preference share/ net proceeds
= .75/5.89
= 12.73%
⊘ This is a preview!⊘
Do you want full access?
Subscribe today to unlock all pages.
Trusted by 1+ million students worldwide
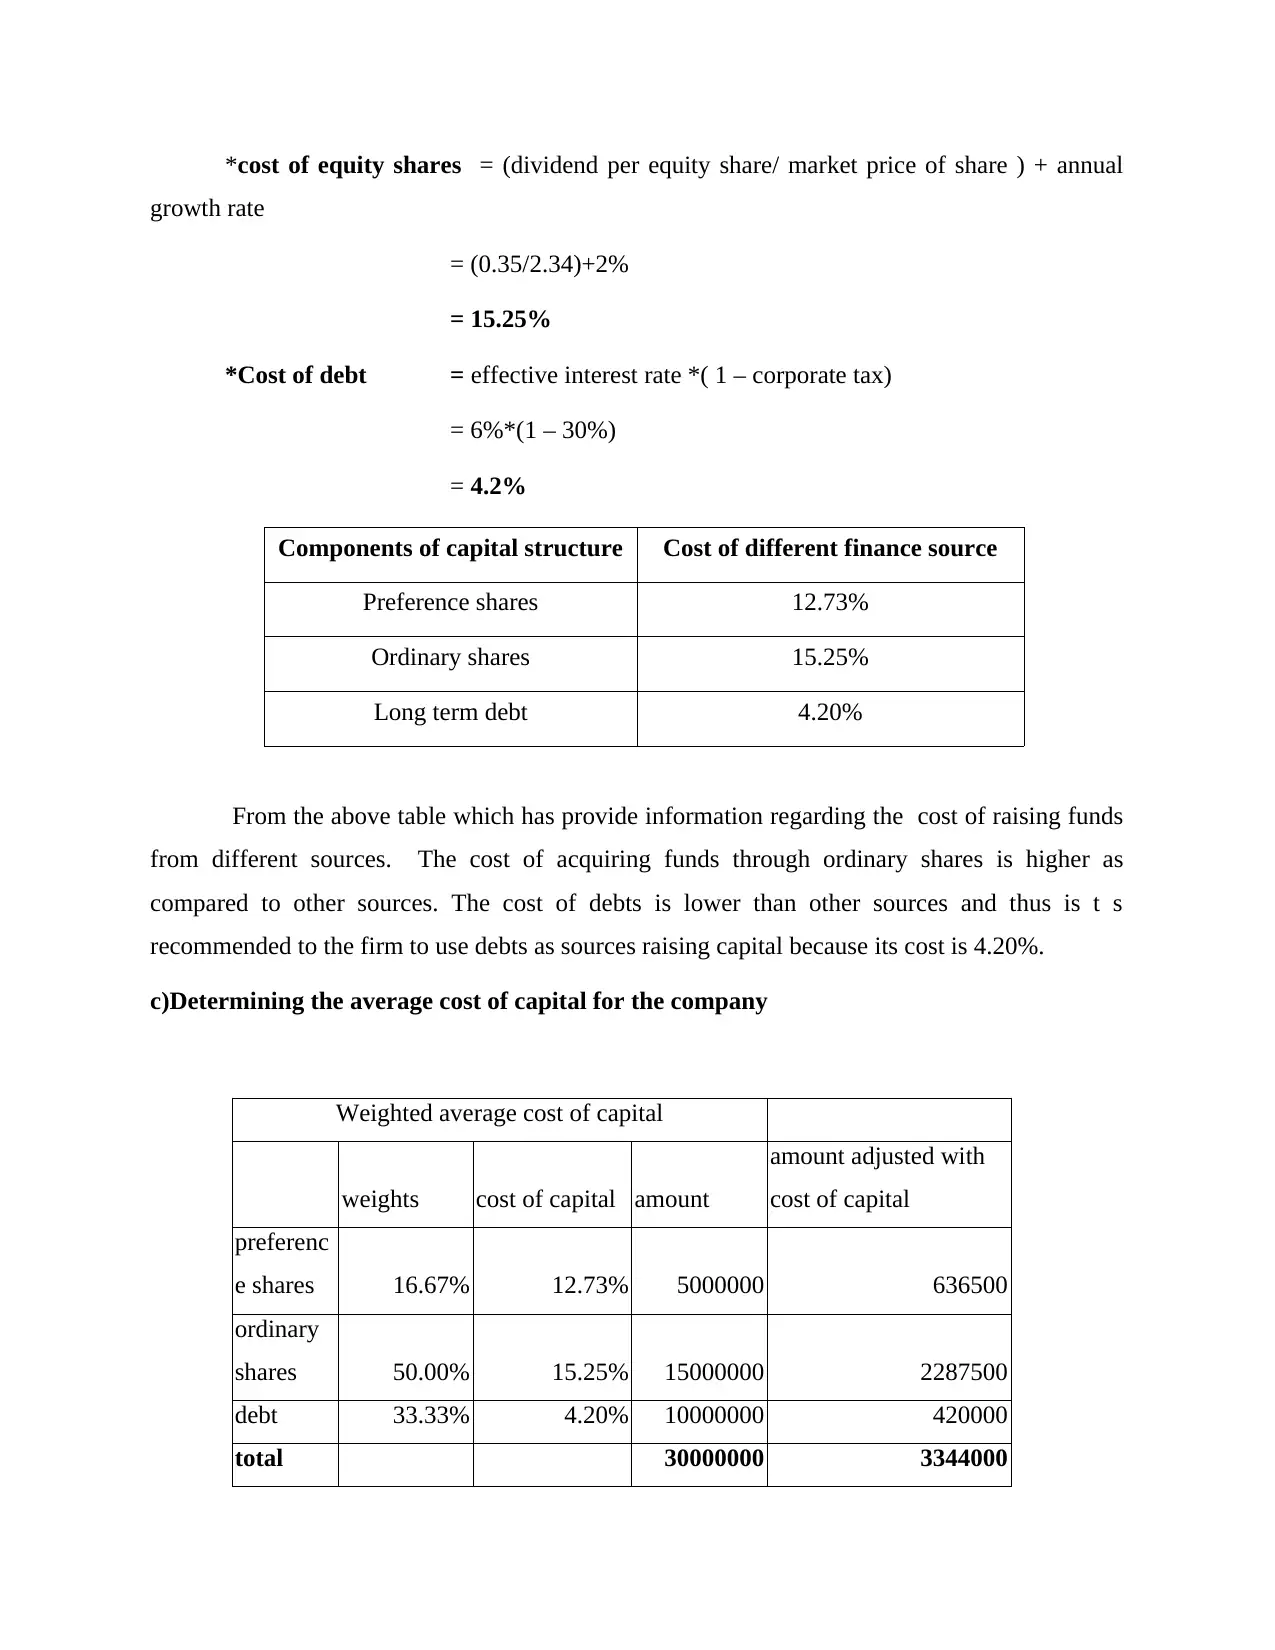
*cost of equity shares = (dividend per equity share/ market price of share ) + annual
growth rate
= (0.35/2.34)+2%
= 15.25%
*Cost of debt = effective interest rate *( 1 – corporate tax)
= 6%*(1 – 30%)
= 4.2%
Components of capital structure Cost of different finance source
Preference shares 12.73%
Ordinary shares 15.25%
Long term debt 4.20%
From the above table which has provide information regarding the cost of raising funds
from different sources. The cost of acquiring funds through ordinary shares is higher as
compared to other sources. The cost of debts is lower than other sources and thus is t s
recommended to the firm to use debts as sources raising capital because its cost is 4.20%.
c)Determining the average cost of capital for the company
Weighted average cost of capital
weights cost of capital amount
amount adjusted with
cost of capital
preferenc
e shares 16.67% 12.73% 5000000 636500
ordinary
shares 50.00% 15.25% 15000000 2287500
debt 33.33% 4.20% 10000000 420000
total 30000000 3344000
Paraphrase This Document
Need a fresh take? Get an instant paraphrase of this document with our AI Paraphraser
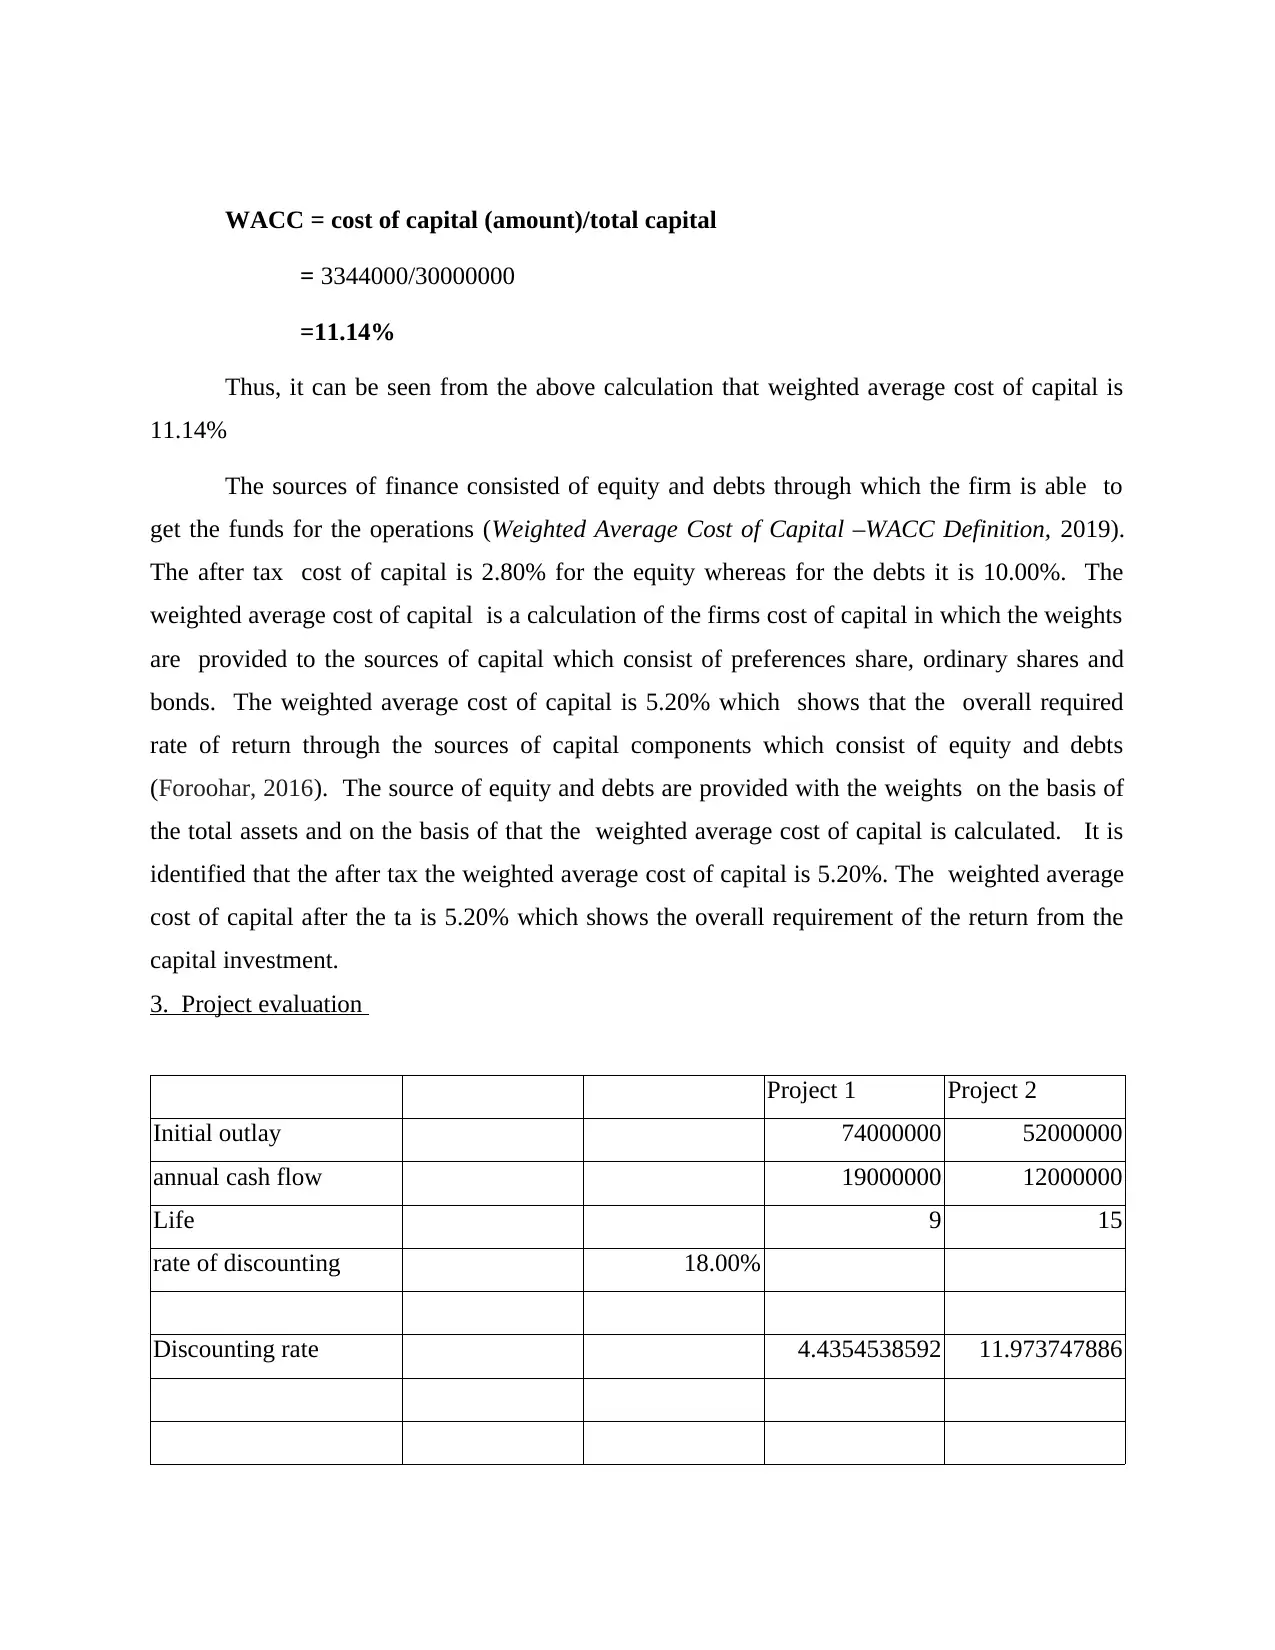
WACC = cost of capital (amount)/total capital
= 3344000/30000000
=11.14%
Thus, it can be seen from the above calculation that weighted average cost of capital is
11.14%
The sources of finance consisted of equity and debts through which the firm is able to
get the funds for the operations (Weighted Average Cost of Capital –WACC Definition, 2019).
The after tax cost of capital is 2.80% for the equity whereas for the debts it is 10.00%. The
weighted average cost of capital is a calculation of the firms cost of capital in which the weights
are provided to the sources of capital which consist of preferences share, ordinary shares and
bonds. The weighted average cost of capital is 5.20% which shows that the overall required
rate of return through the sources of capital components which consist of equity and debts
(Foroohar, 2016). The source of equity and debts are provided with the weights on the basis of
the total assets and on the basis of that the weighted average cost of capital is calculated. It is
identified that the after tax the weighted average cost of capital is 5.20%. The weighted average
cost of capital after the ta is 5.20% which shows the overall requirement of the return from the
capital investment.
3. Project evaluation
Project 1 Project 2
Initial outlay 74000000 52000000
annual cash flow 19000000 12000000
Life 9 15
rate of discounting 18.00%
Discounting rate 4.4354538592 11.973747886
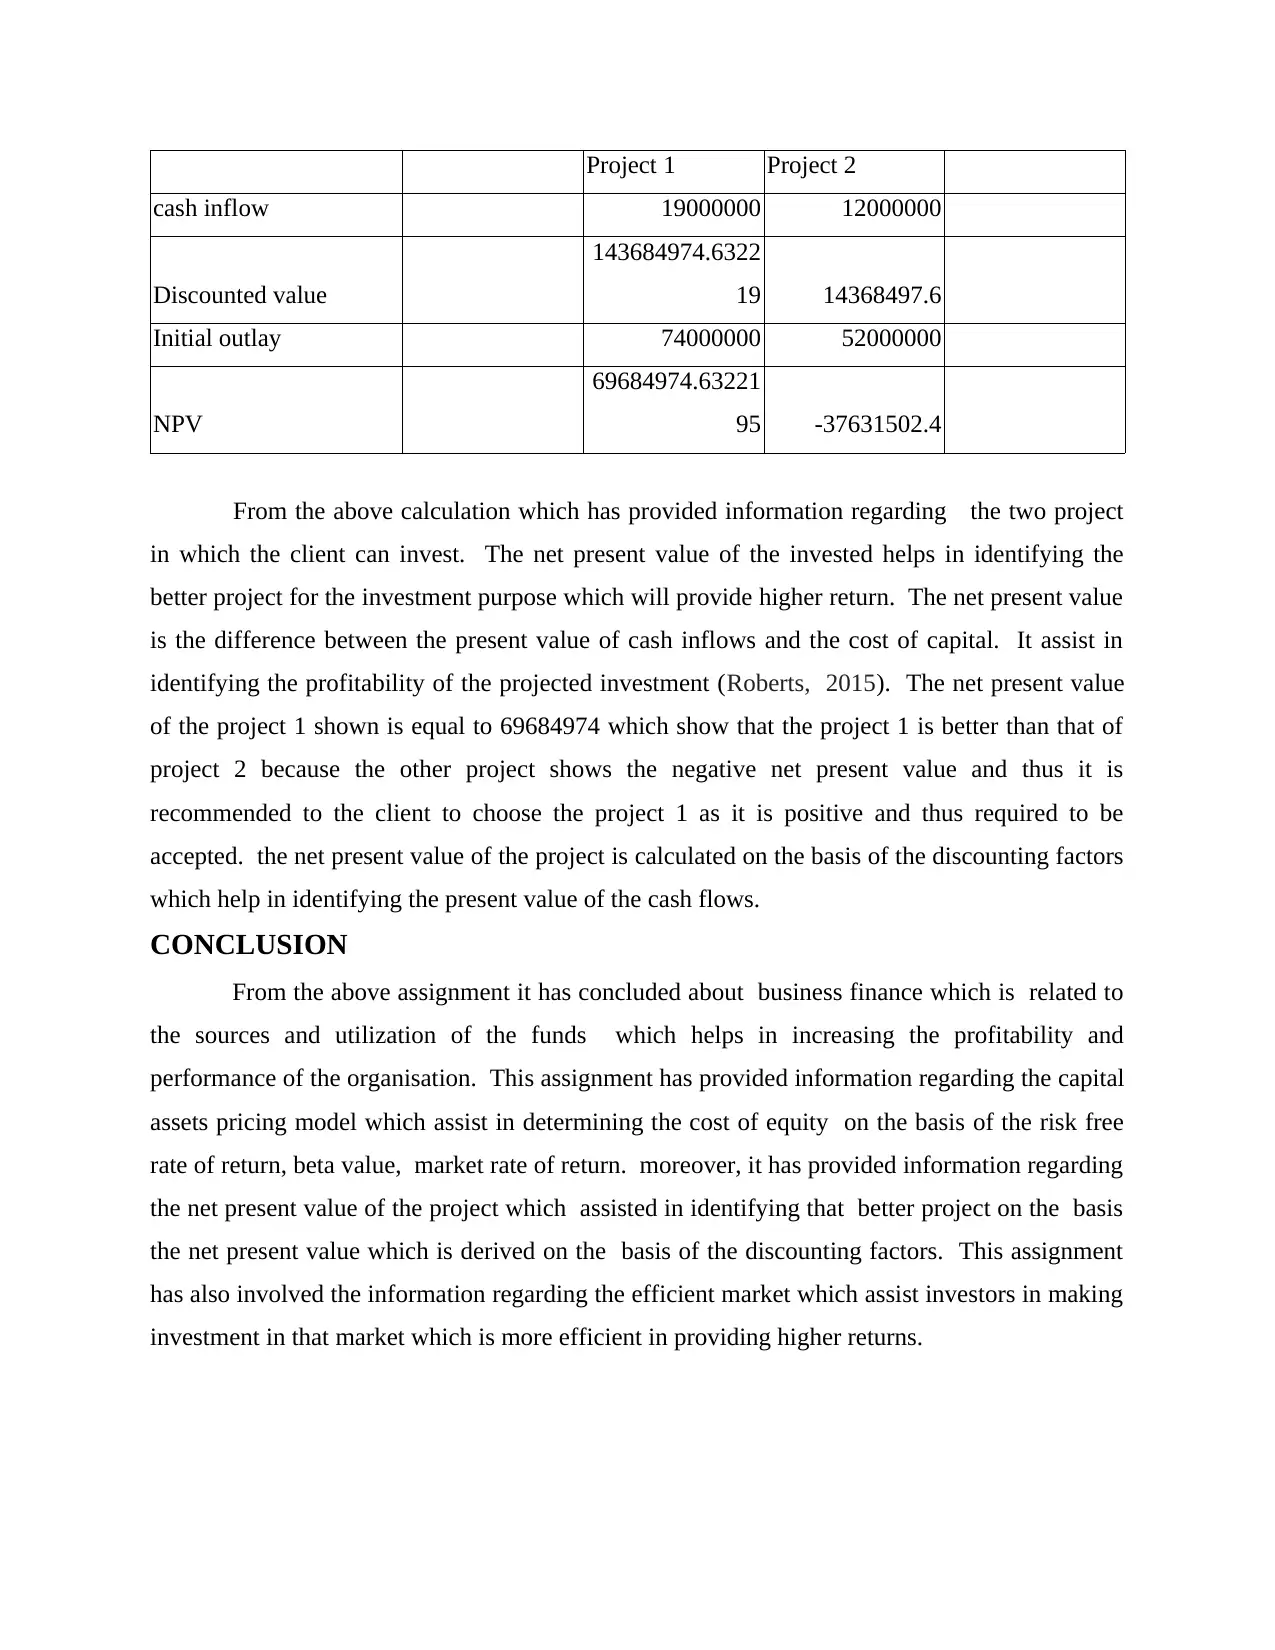
Project 1 Project 2
cash inflow 19000000 12000000
Discounted value
143684974.6322
19 14368497.6
Initial outlay 74000000 52000000
NPV
69684974.63221
95 -37631502.4
From the above calculation which has provided information regarding the two project
in which the client can invest. The net present value of the invested helps in identifying the
better project for the investment purpose which will provide higher return. The net present value
is the difference between the present value of cash inflows and the cost of capital. It assist in
identifying the profitability of the projected investment (Roberts, 2015). The net present value
of the project 1 shown is equal to 69684974 which show that the project 1 is better than that of
project 2 because the other project shows the negative net present value and thus it is
recommended to the client to choose the project 1 as it is positive and thus required to be
accepted. the net present value of the project is calculated on the basis of the discounting factors
which help in identifying the present value of the cash flows.
CONCLUSION
From the above assignment it has concluded about business finance which is related to
the sources and utilization of the funds which helps in increasing the profitability and
performance of the organisation. This assignment has provided information regarding the capital
assets pricing model which assist in determining the cost of equity on the basis of the risk free
rate of return, beta value, market rate of return. moreover, it has provided information regarding
the net present value of the project which assisted in identifying that better project on the basis
the net present value which is derived on the basis of the discounting factors. This assignment
has also involved the information regarding the efficient market which assist investors in making
investment in that market which is more efficient in providing higher returns.
⊘ This is a preview!⊘
Do you want full access?
Subscribe today to unlock all pages.
Trusted by 1+ million students worldwide
REFERENCES
Books and journals
Burns, P. and Dewhurst, J. eds., 2016. Small business and entrepreneurship. Macmillan
International Higher Education.
Jordà, Ò., Schularick, M. and Taylor, A. M., 2016. The great mortgaging: housing finance, crises
and business cycles. Economic Policy. 31(85). pp.107-152.
Maxwell, D., 2017. Valuing Natural Capital: Future Proofing Business and Finance. Routledge.
Bendell, J. and Doyle, I., 2017. Healing capitalism: five years in the life of business, finance and
corporate responsibility. Routledge.
Burns, P., 2016. Entrepreneurship and small business. Palgrave Macmillan Limited.
Gitman, L. J., Juchau, R. and Flanagan, J., 2015. Principles of managerial finance. Pearson
Higher Education AU.
Foroohar, R., 2016. Makers and takers: The rise of finance and the fall of American business.
Crown Books.
Roberts, R., 2015. Finance for small and entrepreneurial business. Routledge.
Online
Weighted Average Cost of Capital – WACC Definition. 2019. [Online]. Available
through :<https://www.investopedia.com/terms/w/wacc.asp>
Net Present Value (NPV). 2019. [Online]. Available through
:<https://www.investopedia.com/terms/n/npv.asp>
1 out of 10
Related Documents


Your All-in-One AI-Powered Toolkit for Academic Success.
+13062052269
info@desklib.com
Available 24*7 on WhatsApp / Email
![[object Object]](/_next/static/media/star-bottom.7253800d.svg)
Unlock your academic potential
Copyright © 2020–2026 A2Z Services. All Rights Reserved. Developed and managed by ZUCOL.